
In the dynamic world of finance, understanding change is paramount. Whether you’re tracking investment performance, analyzing budget cuts, evaluating sales figures, or deciphering economic reports, the ability to quantify a reduction is an indispensable skill. While an absolute decrease tells you how much something has gone down, a percentage decrease tells you how significant that drop is relative to its original state. This distinction is critical for context, comparison, and informed decision-making.
This article aims to demystify the calculation of percentage decrease, providing a clear, step-by-step guide with practical financial examples. By mastering this fundamental concept, you’ll gain a more profound understanding of financial shifts, enabling you to interpret data more accurately and make smarter choices, both in your personal finances and in business operations.
Understanding the Fundamentals of Percentage Decrease
Before diving into the mechanics, it’s essential to grasp what a percentage decrease truly represents and why it holds such significance in financial analysis.
What is Percentage Decrease?
Percentage decrease is a mathematical concept that expresses the relative change between an initial value and a smaller final value, as a proportion of the initial value, multiplied by 100 to convert it into a percentage. In simpler terms, it quantifies how much something has shrunk, not just in raw numbers, but in proportion to what it originally was.
Why is this relative measure so important? Consider a $100 decrease. If it’s from an original value of $1,000,000, it’s negligible. If it’s from an original value of $200, it’s catastrophic. The percentage decrease provides this crucial context, allowing you to compare reductions across different scales and scenarios, which absolute numbers alone cannot do effectively. For instance, a 10% decline in stock value might trigger a different response than a 1% decline, regardless of the initial stock price.
The Basic Formula Explained
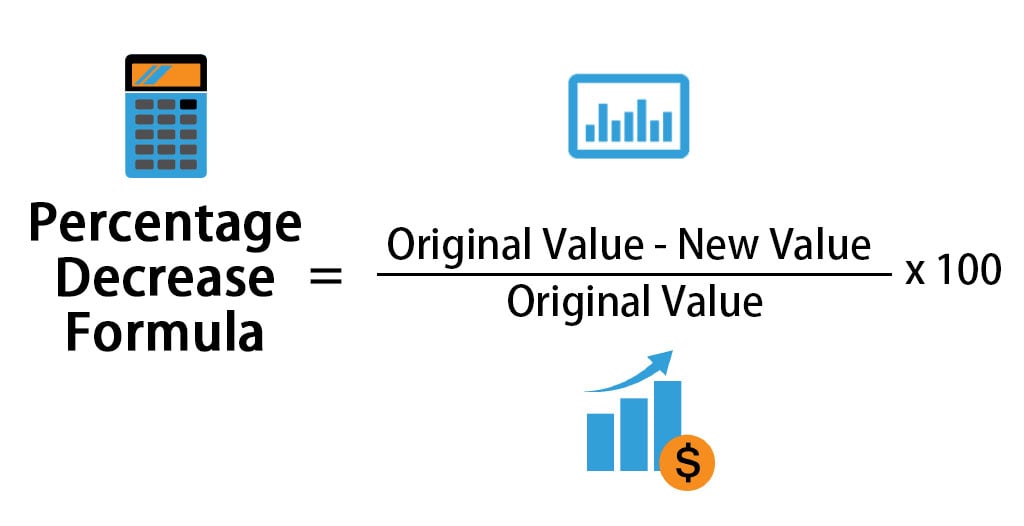
The calculation for percentage decrease is straightforward and relies on a fundamental formula. Understanding each component is key to accurate application:
Formula: ((Original Value - New Value) / Original Value) * 100
Let’s break down each element:
- Original Value: This is the starting point, the initial amount, or the baseline against which the decrease is measured. It’s crucial to correctly identify this value as it forms the denominator of our fraction.
- New Value: This is the final amount after the decrease has occurred. It must be smaller than the Original Value for a percentage decrease to exist.
- Original Value – New Value: This first part of the calculation determines the absolute decrease – the raw numerical difference between the starting and ending points. This tells you the actual amount by which the value has fallen.
/ Original Value: Dividing the absolute decrease by the Original Value converts this raw difference into a decimal fraction. This fraction represents the proportion of the original value that has been lost. For example, if the absolute decrease is 20 and the original value is 100, the fraction 20/100 = 0.20, meaning 20% of the original value has been lost.* 100: Multiplying the resulting decimal by 100 transforms it into a percentage. This is the final step that makes the figure easily digestible and comparable.
Mastering this formula is the bedrock of understanding any financial decline.
Step-by-Step Calculation Guide with Financial Examples
Applying the formula becomes clear when walked through practical financial scenarios. Let’s break down the process step-by-step.
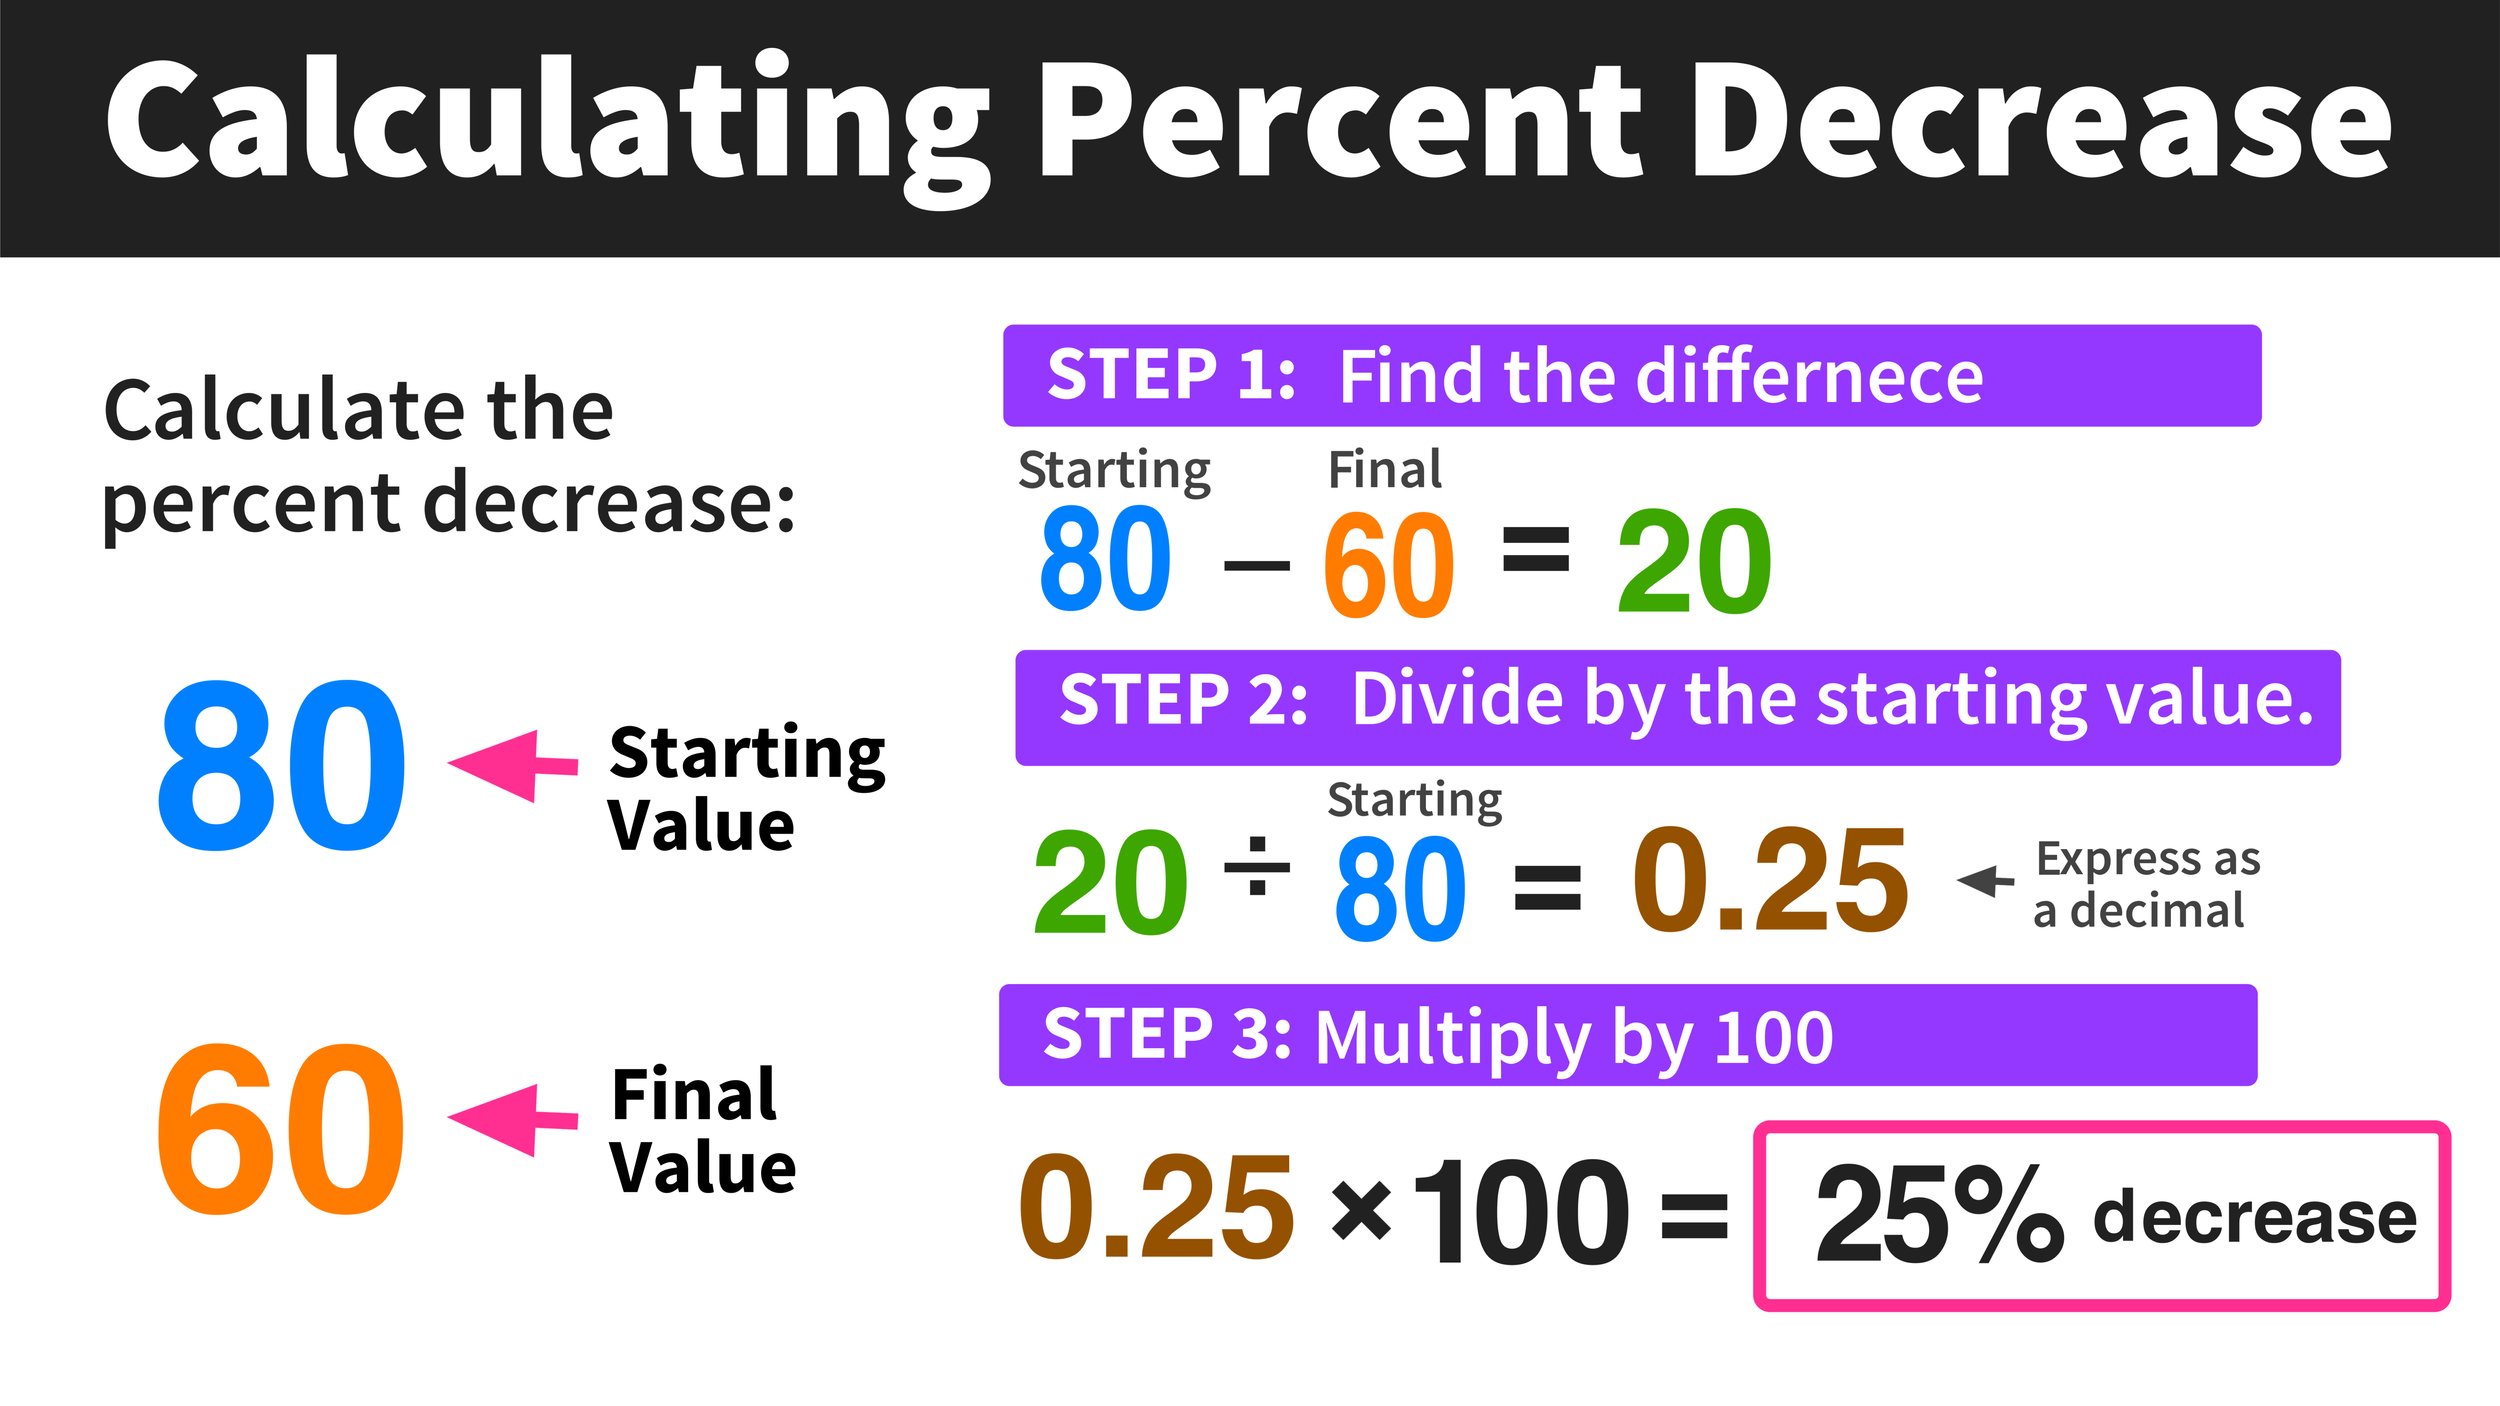
Step 1: Identify Original and New Values
The very first step is to correctly ascertain the original (starting) value and the new (ending) value. This might seem obvious, but misidentifying these can lead to incorrect results, particularly when dealing with complex datasets or multiple periods of change.
- Example 1 (Investment): You invested in a stock at $100 per share (Original Value). Due to market fluctuations, its price has now dropped to $80 per share (New Value).
- Example 2 (Budgeting): Your marketing department’s annual budget was $50,000 (Original Value). Due to company-wide cutbacks, it has been reduced to $45,000 (New Value).
Step 2: Calculate the Absolute Decrease
Once you have identified your original and new values, subtract the new value from the original value. This gives you the raw numerical difference, which is the absolute amount of the decrease.
- Example 1 (Investment): Absolute Decrease = Original Value – New Value = $100 – $80 = $20.
- Example 2 (Budgeting): Absolute Decrease = Original Value – New Value = $50,000 – $45,000 = $5,000.
This step shows you the direct monetary impact, but not its relative significance.
Step 3: Divide the Absolute Decrease by the Original Value
Now, take the absolute decrease calculated in Step 2 and divide it by the original value identified in Step 1. This action converts the absolute decrease into a decimal fraction, representing its proportion to the starting point.
- Example 1 (Investment): Proportionate Decrease = Absolute Decrease / Original Value = $20 / $100 = 0.20.
- Example 2 (Budgeting): Proportionate Decrease = Absolute Decrease / Original Value = $5,000 / $50,000 = 0.10.
At this stage, you have the decrease expressed as a decimal, which is already a complete mathematical answer.
Step 4: Convert the Decimal to a Percentage
The final step is to multiply the decimal fraction from Step 3 by 100. This converts the proportion into a percentage, making it universally understandable and easy to communicate.
- Example 1 (Investment): Percentage Decrease = 0.20 * 100 = 20%.
- Conclusion: The stock price has decreased by 20%.
- Example 2 (Budgeting): Percentage Decrease = 0.10 * 100 = 10%.
- Conclusion: The marketing budget has been cut by 10%.
Following these four steps will consistently yield an accurate percentage decrease, providing invaluable insight into financial changes.
Real-World Applications in Personal and Business Finance
The ability to calculate percentage decrease is not merely an academic exercise; it’s a critical tool with widespread applications across various facets of finance.
Investment Portfolio Performance
For investors, tracking decreases is as important as tracking increases. A percentage decrease allows you to:
- Evaluate individual asset performance: How much has a specific stock or bond lost since your purchase? A stock bought at $50 now at $45 shows a
((50-45)/50)*100 = 10%decrease. - Assess overall portfolio health: If your portfolio was worth $100,000 last year and is now $92,000, you’ve experienced an
((100,000-92,000)/100,000)*100 = 8%decrease. This metric is crucial for rebalancing, risk management, and making informed decisions about future investments. - Understand market corrections: When the overall market or an index drops, percentage decrease helps contextualize the severity of the downturn.
Budgeting and Expense Management
Whether for personal or corporate budgets, identifying and understanding decreases in spending is vital for financial health.
- Personal expense tracking: You might track your monthly utility bill from $150 to $135. That’s a
((150-135)/150)*100 = 10%decrease, indicating successful conservation or a seasonal change. - Cost reduction initiatives: A business aiming to cut costs might track a decrease in office supplies spending from $1,000 to $850, representing a
((1000-850)/1000)*100 = 15%reduction. This helps assess the effectiveness of new policies or vendor changes. - Budget adherence: If a department’s allocated budget was $20,000 and actual spending came in at $19,000, this is a positive
((20000-19000)/20000)*100 = 5%decrease relative to the allocated amount, indicating efficiency.
Business Finance and Performance Analysis
In the corporate world, percentage decrease is a key performance indicator (KPI) used across departments.
- Sales and Revenue Decline: If a company’s quarterly revenue drops from $1,000,000 to $900,000, this is a
((1,000,000-900,000)/1,000,000)*100 = 10%decrease, signaling potential market shifts, increased competition, or operational issues that require immediate attention. - Profit Margin Reduction: A decrease in profit margin from 25% to 20% (this is a percentage point decrease, but a different calculation for the decrease in the margin itself which we cover later) is a critical indicator of profitability challenges.
- Inventory Shrinkage: If inventory units go from 1,000 to 950 due to theft or damage, that’s a
((1000-950)/1000)*100 = 5%shrinkage, prompting security reviews. - Customer Churn: A reduction in active subscribers from 500,000 to 480,000 indicates a
((500,000-480,000)/500,000)*100 = 4%customer churn rate, prompting retention strategies.
Discounts and Price Reductions
For consumers and retailers alike, percentage decrease clarifies the value of discounts and sales.
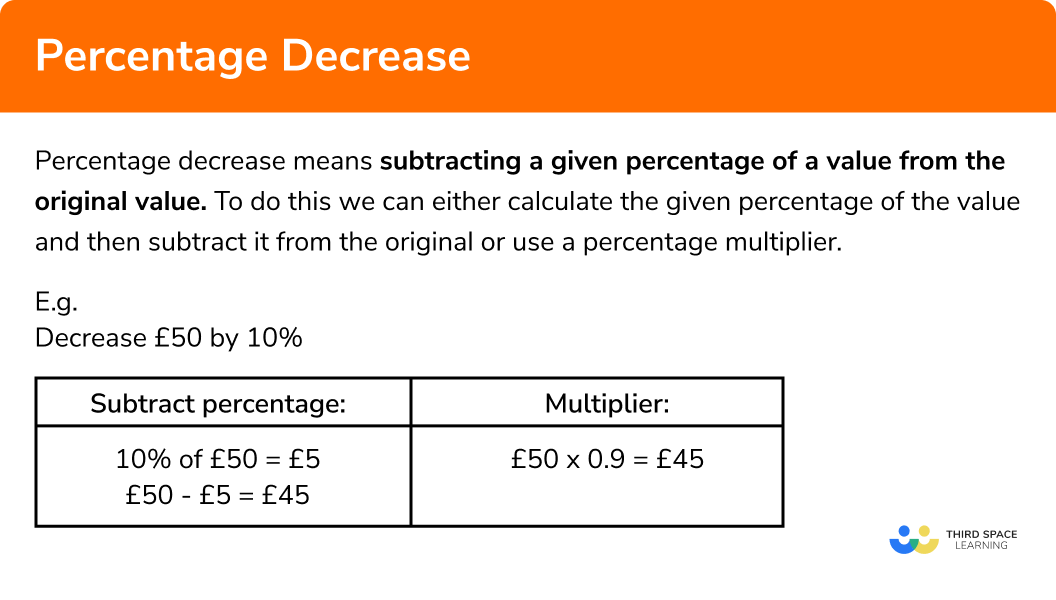
- Understanding Sale Prices: An item originally priced at $50 now selling for $40 represents a
((50-40)/50)*100 = 20%discount. This helps consumers quickly grasp the savings. - Negotiating Deals: Knowing the original price versus a discounted offer helps in calculating the true percentage reduction, empowering better negotiation.
Common Pitfalls and Best Practices
While the calculation of percentage decrease is straightforward, certain nuances and potential misinterpretations can lead to errors or flawed conclusions.
Distinguishing Between Original and New Values
The most common mistake is confusing which value is the “original” and which is the “new.” Always remember: the original value is the starting point, and it must always be the denominator in the division step. If you swap them, you will either get a percentage increase (if the new value is larger) or an incorrect decrease value. For example, if a stock went from $80 to $100, and you incorrectly used $100 as the original, you’d calculate a decrease when there was an increase.
The Difference Between Percentage Decrease and Percentage Point Decrease
This is a critical distinction, especially in financial reporting.
- Percentage Decrease (Relative Change): As discussed, this measures the relative change of a quantity. For example, if an interest rate drops from 5% to 4%, the rate itself has decreased by
((5-4)/5)*100 = 20%. - Percentage Point Decrease (Absolute Change): This refers to the simple arithmetic difference between two percentages. In the example above, the interest rate decreased by 1 percentage point (5% – 4% = 1%).
These are not interchangeable. Saying an interest rate decreased by 20% is very different from saying it decreased by 1 percentage point. The former tells you about the proportional change of the rate, while the latter tells you the absolute difference in the percentage values themselves. Be precise in your terminology.
Using the Right Tools
While manual calculation is good for understanding, for larger datasets or frequent computations, leverage technology:
- Spreadsheets (Excel, Google Sheets): These are invaluable. Simply input your original and new values, and apply the formula in a cell:
=( (A2-B2) / A2 ) * 100. This automates calculations and reduces human error. - Financial Calculators/Software: Many online tools and financial software packages incorporate percentage change functions, often providing more sophisticated analysis.
- Double-Checking: Regardless of the tool, always perform a quick mental check or reverse calculation to ensure your results make sense. If a stock price drops by 50%, the new value should be half the original.
Interpreting Results with Context
A percentage decrease, while powerful, should always be interpreted within its broader context.
- Scale Matters: A 5% decrease in a $100 personal expense is $5. A 5% decrease in a company’s $1 billion revenue is $50 million. The percentage is the same, but the absolute impact differs significantly.
- External Factors: Was the decrease due to market conditions, a policy change, a one-off event, or a systemic issue? Understanding the “why” behind the percentage decrease is as important as the calculation itself.
- Time Horizon: A 10% decrease over one day versus a 10% decrease over a decade tells very different stories about volatility and trend.
Conclusion
The ability to accurately calculate the decrease in percentage is a fundamental skill that underpins sound financial literacy and effective decision-making. From managing personal investments and household budgets to analyzing complex business performance and market trends, this calculation provides the essential context that raw numbers simply cannot.
By understanding the basic formula, diligently following the step-by-step process, and being mindful of common pitfalls, you equip yourself with a powerful analytical tool. Embrace this skill, apply it to your financial data, and watch as your understanding of monetary shifts deepens, empowering you to navigate the financial landscape with greater confidence and insight.
aViewFromTheCave is a participant in the Amazon Services LLC Associates Program, an affiliate advertising program designed to provide a means for sites to earn advertising fees by advertising and linking to Amazon.com. Amazon, the Amazon logo, AmazonSupply, and the AmazonSupply logo are trademarks of Amazon.com, Inc. or its affiliates. As an Amazon Associate we earn affiliate commissions from qualifying purchases.