
In the dynamic world of finance, understanding growth, change, and performance is paramount. Whether you’re a seasoned investor, a budding entrepreneur, or simply managing your personal budget, the ability to quantify progress is a fundamental skill. Among the most crucial metrics for gauging positive change is the percentage increase. It provides a standardized, relative measure that transcends the raw numbers, offering a clear perspective on how much something has grown in proportion to its original size. Far more insightful than absolute figures alone, percentage increase allows for meaningful comparisons across diverse financial scenarios, from tracking your stock portfolio’s appreciation to assessing the year-over-year revenue growth of a business. This article will demystify the calculation of percentage increase, embedding it firmly within the realm of personal and business finance, and illustrating its indispensable role in informed decision-making.

The Core Formula Unveiled: Calculating Percentage Increase
At its heart, finding the percentage increase between two numbers is a straightforward mathematical process. It involves comparing a new value to an original value to determine the relative magnitude of growth. Grasping this core formula is the first step towards unlocking deeper financial insights.
Understanding the Components
Before diving into the calculation, it’s essential to define the two critical components:
- Original Value (or Starting Value): This is the baseline number from which you are measuring the increase. It represents the state before any growth occurred. In finance, this could be last year’s sales figures, your initial investment amount, or your starting salary.
- New Value (or Ending Value): This is the number after the increase has taken place. It represents the current or subsequent state. Financially, this might be current year’s sales, the present value of your investment, or your updated salary.
The difference between these two values is the absolute increase, but to understand its significance, we normalize it against the original value.
Step-by-Step Calculation
The formula for percentage increase is as follows:
$$ text{Percentage Increase} = left( frac{text{New Value} – text{Original Value}}{text{Original Value}} right) times 100% $$
Let’s break it down into simple steps:
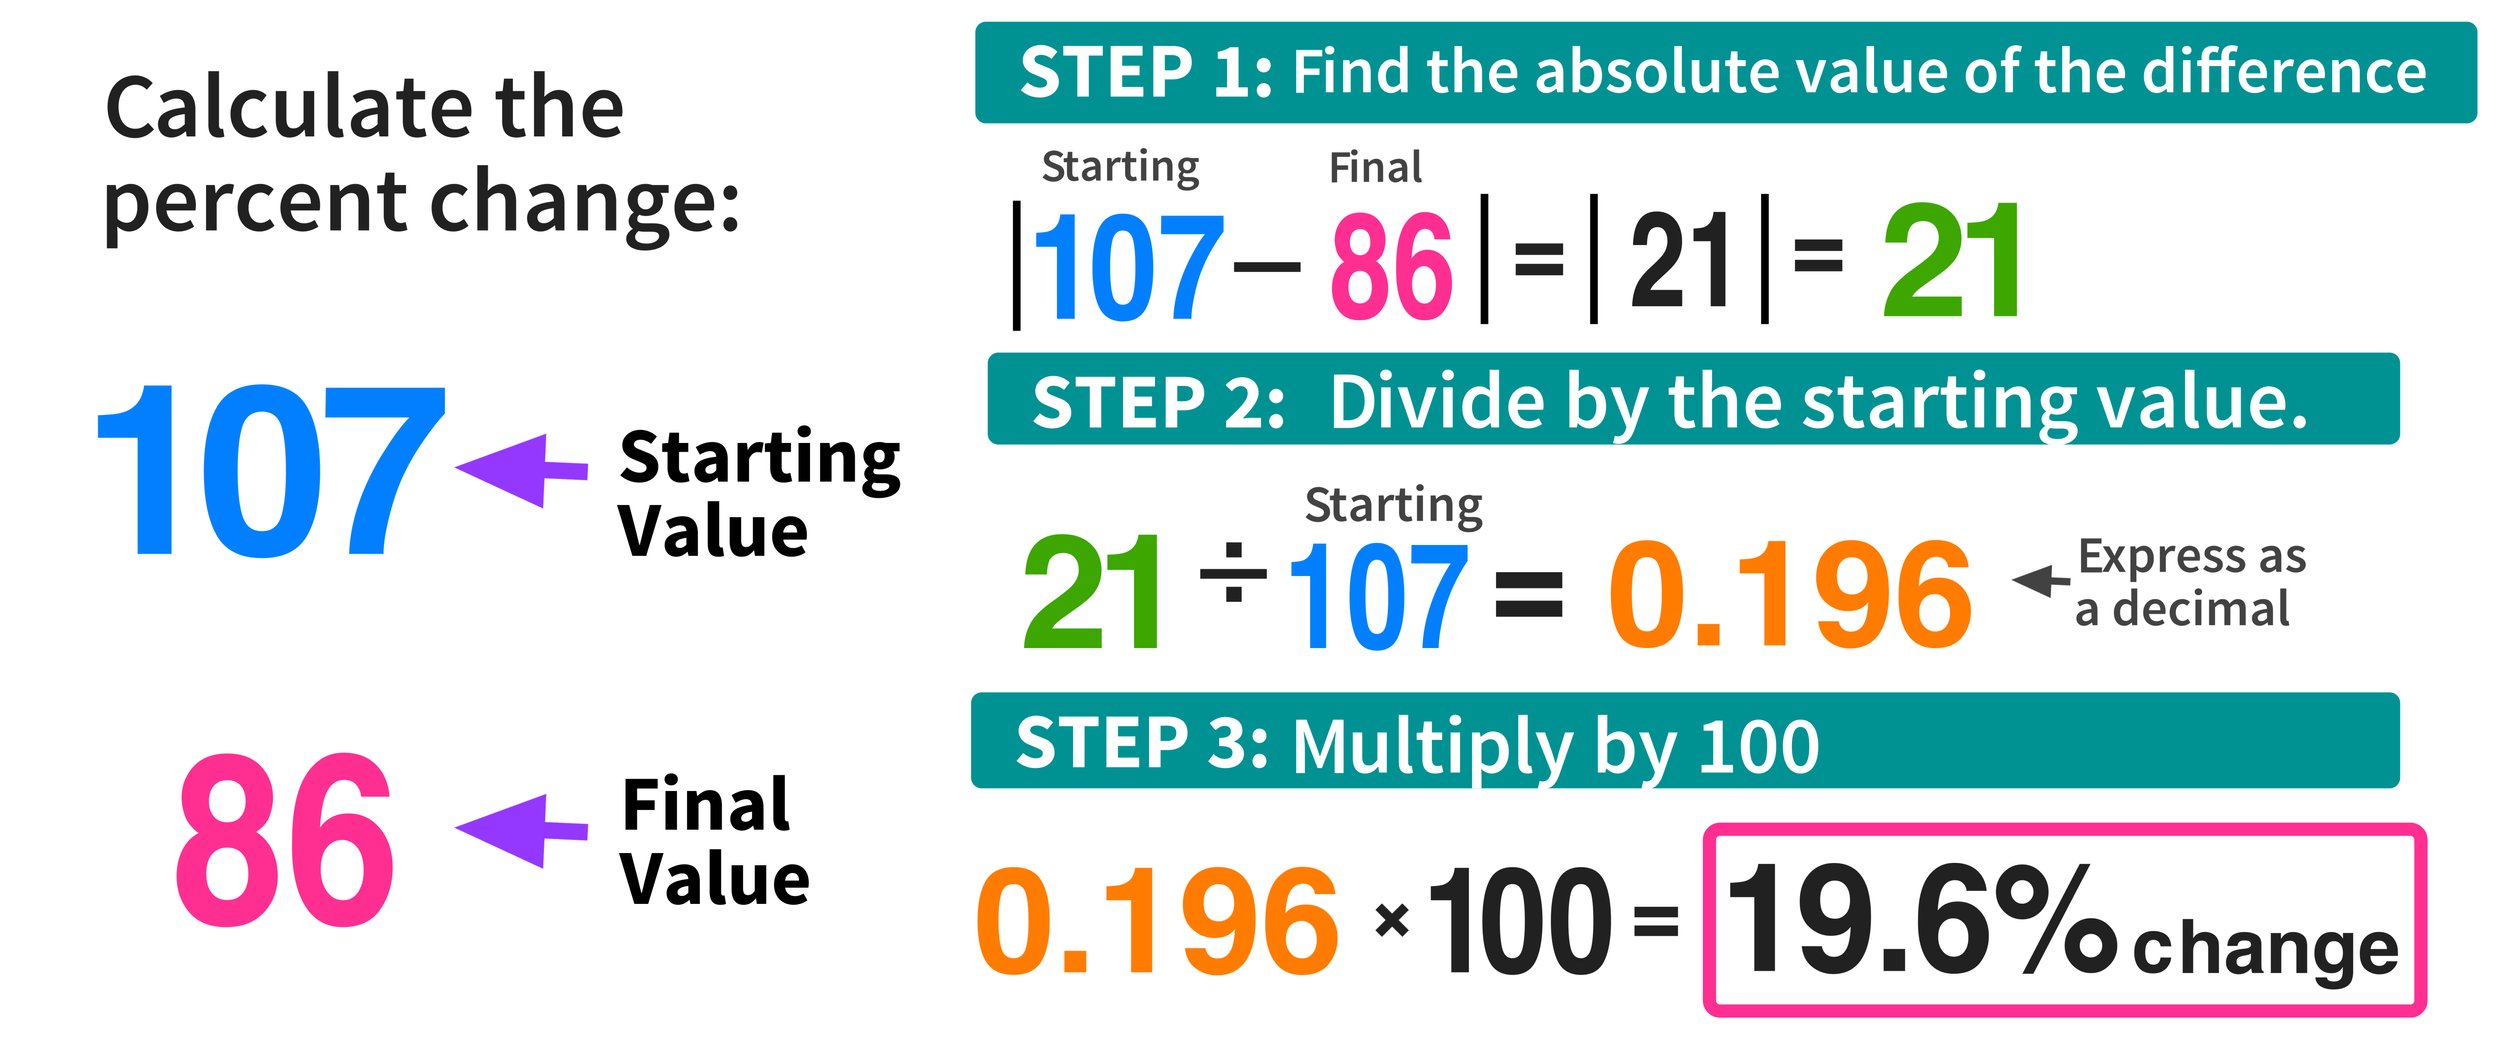
- Find the Difference: Subtract the Original Value from the New Value. This gives you the absolute amount of increase.
- Example: If your investment grew from $10,000 to $12,000, the difference is $12,000 – $10,000 = $2,000.
- Divide by the Original Value: Take the difference you calculated in step 1 and divide it by the Original Value. This step converts the absolute increase into a decimal representation of its proportion to the starting point.
- Example: $2,000 / $10,000 = 0.20.
- Multiply by 100: To express this decimal as a percentage, multiply the result from step 2 by 100.
- Example: $0.20 times 100% = 20%$.
Thus, an investment that grew from $10,000 to $12,000 experienced a 20% increase. This method provides a universal language for growth that is easy to understand and compare.
Practical Example in Personal Finance
Consider your monthly utility bill. Last month, it was $150. This month, it rose to $165.
- Original Value: $150
- New Value: $165
- Difference: $165 – $150 = $15
- Divide by Original Value: $15 / $150 = 0.10
- Multiply by 100: $0.10 times 100% = 10%$
Your utility bill experienced a 10% increase. This insight allows you to question the reasons for the surge and potentially adjust your consumption or look for cost-saving measures, a crucial element of proactive personal finance management.
Why Percentage Increase Matters in Money Management
The true power of understanding percentage increase extends far beyond the calculation itself. In the financial domain, it serves as a critical analytical tool, informing decisions across a spectrum of activities from personal budgeting to large-scale investment strategies.
Tracking Investment Growth
For investors, percentage increase is the cornerstone of performance evaluation. It allows you to:
- Assess Portfolio Performance: Compare the growth of your entire investment portfolio year-over-year, or quarter-over-quarter, irrespective of the absolute dollar amounts invested. A 7% increase in a $100,000 portfolio is $7,000, while a 7% increase in a $1,000,000 portfolio is $70,000. The percentage growth provides a standardized measure of efficiency and return on capital.
- Evaluate Individual Assets: Determine the return on specific stocks, bonds, or mutual funds. If Stock A increased by 15% and Stock B by 10% over the same period, the former performed better in relative terms, even if its absolute dollar gain was smaller due to a lower initial investment.
- Compare Investment Opportunities: When considering new investments, their projected percentage increases (or historical averages) are crucial for comparing potential returns and making informed allocation decisions.
Analyzing Personal Finance and Budgeting
Within personal finance, percentage increase offers clarity on various aspects:
- Salary Increases: Understanding your salary increase as a percentage (e.g., a 3% raise) provides context beyond the raw dollar amount, allowing you to benchmark it against inflation or industry standards.
- Budgeting and Expense Tracking: Monitor the percentage increase in categories like groceries, transportation, or entertainment. If your food budget increased by 20% in a month, it signals a need for closer examination and potential adjustments to maintain financial health.
- Debt Reduction: While often a “percentage decrease” topic, understanding how interest rates (a form of percentage increase on debt) impact your financial obligations underscores the importance of percentages in managing liabilities.
Evaluating Business Performance
For businesses and entrepreneurs, percentage increase is indispensable for strategic planning and operational insights:
- Sales Growth: Measuring year-over-year or quarter-over-quarter sales increase provides a clear indicator of market penetration and business expansion. A 10% increase in sales suggests healthy growth, which can inform decisions on staffing, production, and marketing spend.
- Profit Margins: Tracking percentage increase in profit allows businesses to assess operational efficiency and pricing strategies. A higher percentage increase in profit compared to revenue might indicate improved cost management.
- Cost Analysis: Monitoring the percentage increase in operational costs (e.g., raw materials, labor) helps identify potential inefficiencies, inflationary pressures, or areas where cost-cutting measures might be necessary to protect profitability.
Common Pitfalls and Best Practices
While calculating percentage increase is straightforward, its application requires nuance and an understanding of potential misinterpretations. Adhering to best practices ensures that the insights derived are accurate and actionable.
The Importance of a Clear Base Value
The “Original Value” is the anchor of the percentage increase calculation. Any ambiguity or error in identifying this base can lead to significantly misleading results.
- Consistency is Key: When comparing growth over different periods or across different entities, always ensure that the base values are truly comparable. For instance, comparing the growth of a startup’s revenue from $10,000 to $100,000 (a 900% increase) with a multinational’s growth from $1 billion to $1.1 billion (a 10% increase) isn’t directly comparable for absolute impact, but the percentages clearly illustrate relative growth rates from their respective bases.
- Avoiding Zero or Negative Base Values: The formula breaks down if the original value is zero, as division by zero is undefined. If dealing with values that start at zero or are negative, percentage increase becomes inappropriate, and absolute change or alternative metrics should be used.
Avoiding Misinterpretations: Relative vs. Absolute Change
Percentage increase provides a relative measure, which is its strength, but also a potential source of misinterpretation if not considered alongside absolute figures.
- Small Base, Huge Percentage: A stock price moving from $1 to $2 is a 100% increase, which sounds impressive. However, the absolute gain is only $1 per share. Conversely, a stock moving from $100 to $105 is a 5% increase, but an absolute gain of $5 per share. While the percentage is lower, the dollar impact per share is higher. Always consider the context of the base amount.
- Cumulative Growth: Be mindful when chaining percentage increases. An item that increases by 10% one year and then by another 10% the next year does not increase by 20% overall. If the initial value was $100, a 10% increase makes it $110. A subsequent 10% increase is on the new base of $110, resulting in $110 + ($110 * 0.10) = $121. The total increase is 21%, not 20%.
When Percentage Increase Might Be Misleading
While powerful, percentage increase isn’t always the perfect metric.
- Highly Volatile Data: For financial data that fluctuates wildly, a single percentage increase between two points might not represent the overall trend accurately.
- Small Numbers: A small absolute change can result in a massive percentage increase if the original number is very small. For example, growing from 1 customer to 5 customers is a 400% increase, but the absolute number (4 customers) might be more relevant for a nascent business.
Tools and Techniques for Calculation
While manual calculation is fundamental, leveraging technology can streamline the process, especially when dealing with large datasets or recurring financial analyses.
Spreadsheet Software (Excel, Google Sheets) for Automation
Spreadsheets are an investor’s and financial analyst’s best friend. They allow for easy calculation and tracking of percentage increases over time.
- Basic Formula: If your original value is in cell A1 and your new value is in cell B1, the formula for percentage increase would be
=(B1-A1)/A1. To display it as a percentage, format the cell as a percentage. - Dynamic Tracking: You can set up columns for monthly or annual values and then create a formula column that automatically calculates the percentage increase from the previous period, providing a dynamic dashboard of financial performance.
Financial Calculators and Online Tools
For quick, one-off calculations, a dedicated financial calculator or numerous online percentage increase calculators can be invaluable. These tools simplify the process, often requiring only the input of the two numbers to instantly provide the percentage increase. Many banking apps and investment platforms also incorporate these calculations into their reporting features.
Manual Calculation for Quick Checks
Despite the availability of technology, the ability to perform a quick mental or manual calculation of percentage increase is a critical skill for everyday financial literacy. It allows for immediate assessment of price changes, salary offers, or investment returns without needing to open an app or spreadsheet. A good rule of thumb for rough estimates is to think in terms of fractions (e.g., 25% is 1/4, 50% is 1/2).
Applying Percentage Increase for Strategic Financial Decisions
Beyond mere calculation, the true value of percentage increase lies in its application to strategic financial planning and decision-making. It transforms raw data into actionable insights.
Setting Financial Goals and Benchmarks
Percentage increase is crucial for defining and measuring progress towards financial goals:
- Investment Goals: Aim for a specific percentage increase in your investment portfolio annually (e.g., “I want to achieve a 7% portfolio growth next year”). This provides a measurable target against which to compare actual performance.
- Savings Goals: Track the percentage increase in your savings balance month-over-month to ensure you’re on track to meet long-term objectives, like a down payment on a house or retirement.
- Business Milestones: A startup might set a goal for a 50% year-over-year revenue increase, while an established company might target a 5% increase in profit margins.
Comparing Performance Across Different Periods and Assets
The standardized nature of percentage increase makes it ideal for comparative analysis:
- Time Series Analysis: Compare the percentage increase in your expenses from January to February, then February to March, to identify trends or seasonal variations.
- Cross-Asset Comparison: Easily compare the performance of a real estate investment that increased by 8% with a stock portfolio that increased by 12% over the same period, allowing for an objective assessment of which asset class provided a better relative return.

Informing Investment Strategies and Budget Adjustments
Understanding percentage changes directly impacts how you manage your money:
- Investment Rebalancing: If one asset class has seen a significantly higher percentage increase, it might have grown to represent too large a portion of your portfolio, prompting a rebalancing to maintain your desired asset allocation.
- Budget Modifications: A consistent percentage increase in discretionary spending might trigger a decision to cut back in that area or reallocate funds from other budget categories.
- Business Expansion: Strong percentage increases in sales in a particular market segment might prompt a business to invest more heavily in that area, while a decline might signal a need for strategic pivot.
In conclusion, the ability to find and interpret the percentage increase of two numbers is far more than a simple mathematical exercise; it is an indispensable skill for navigating the complexities of modern finance. From personal budgets and investment portfolios to business growth and economic analysis, this fundamental calculation provides the clarity and context needed to make informed, strategic decisions. By understanding its mechanics, recognizing its power, and being mindful of its nuances, individuals and organizations alike can unlock deeper financial insights and steer their monetary journeys with greater confidence and precision.
aViewFromTheCave is a participant in the Amazon Services LLC Associates Program, an affiliate advertising program designed to provide a means for sites to earn advertising fees by advertising and linking to Amazon.com. Amazon, the Amazon logo, AmazonSupply, and the AmazonSupply logo are trademarks of Amazon.com, Inc. or its affiliates. As an Amazon Associate we earn affiliate commissions from qualifying purchases.