
Understanding percentage increase is a fundamental skill in navigating the world of personal and business finance. From evaluating investment performance and tracking salary growth to analyzing business revenue trends and managing expenses, this simple yet powerful metric provides crucial insights into growth, change, and opportunity. It allows us to compare changes proportionally, offering a clearer picture than absolute figures alone.
The Core Formula: Unlocking Financial Growth Metrics
At its heart, calculating a percentage increase is about quantifying the relative change between two values. It tells you by what proportion a value has grown compared to its starting point.

The Simple Calculation: New Value vs. Old Value
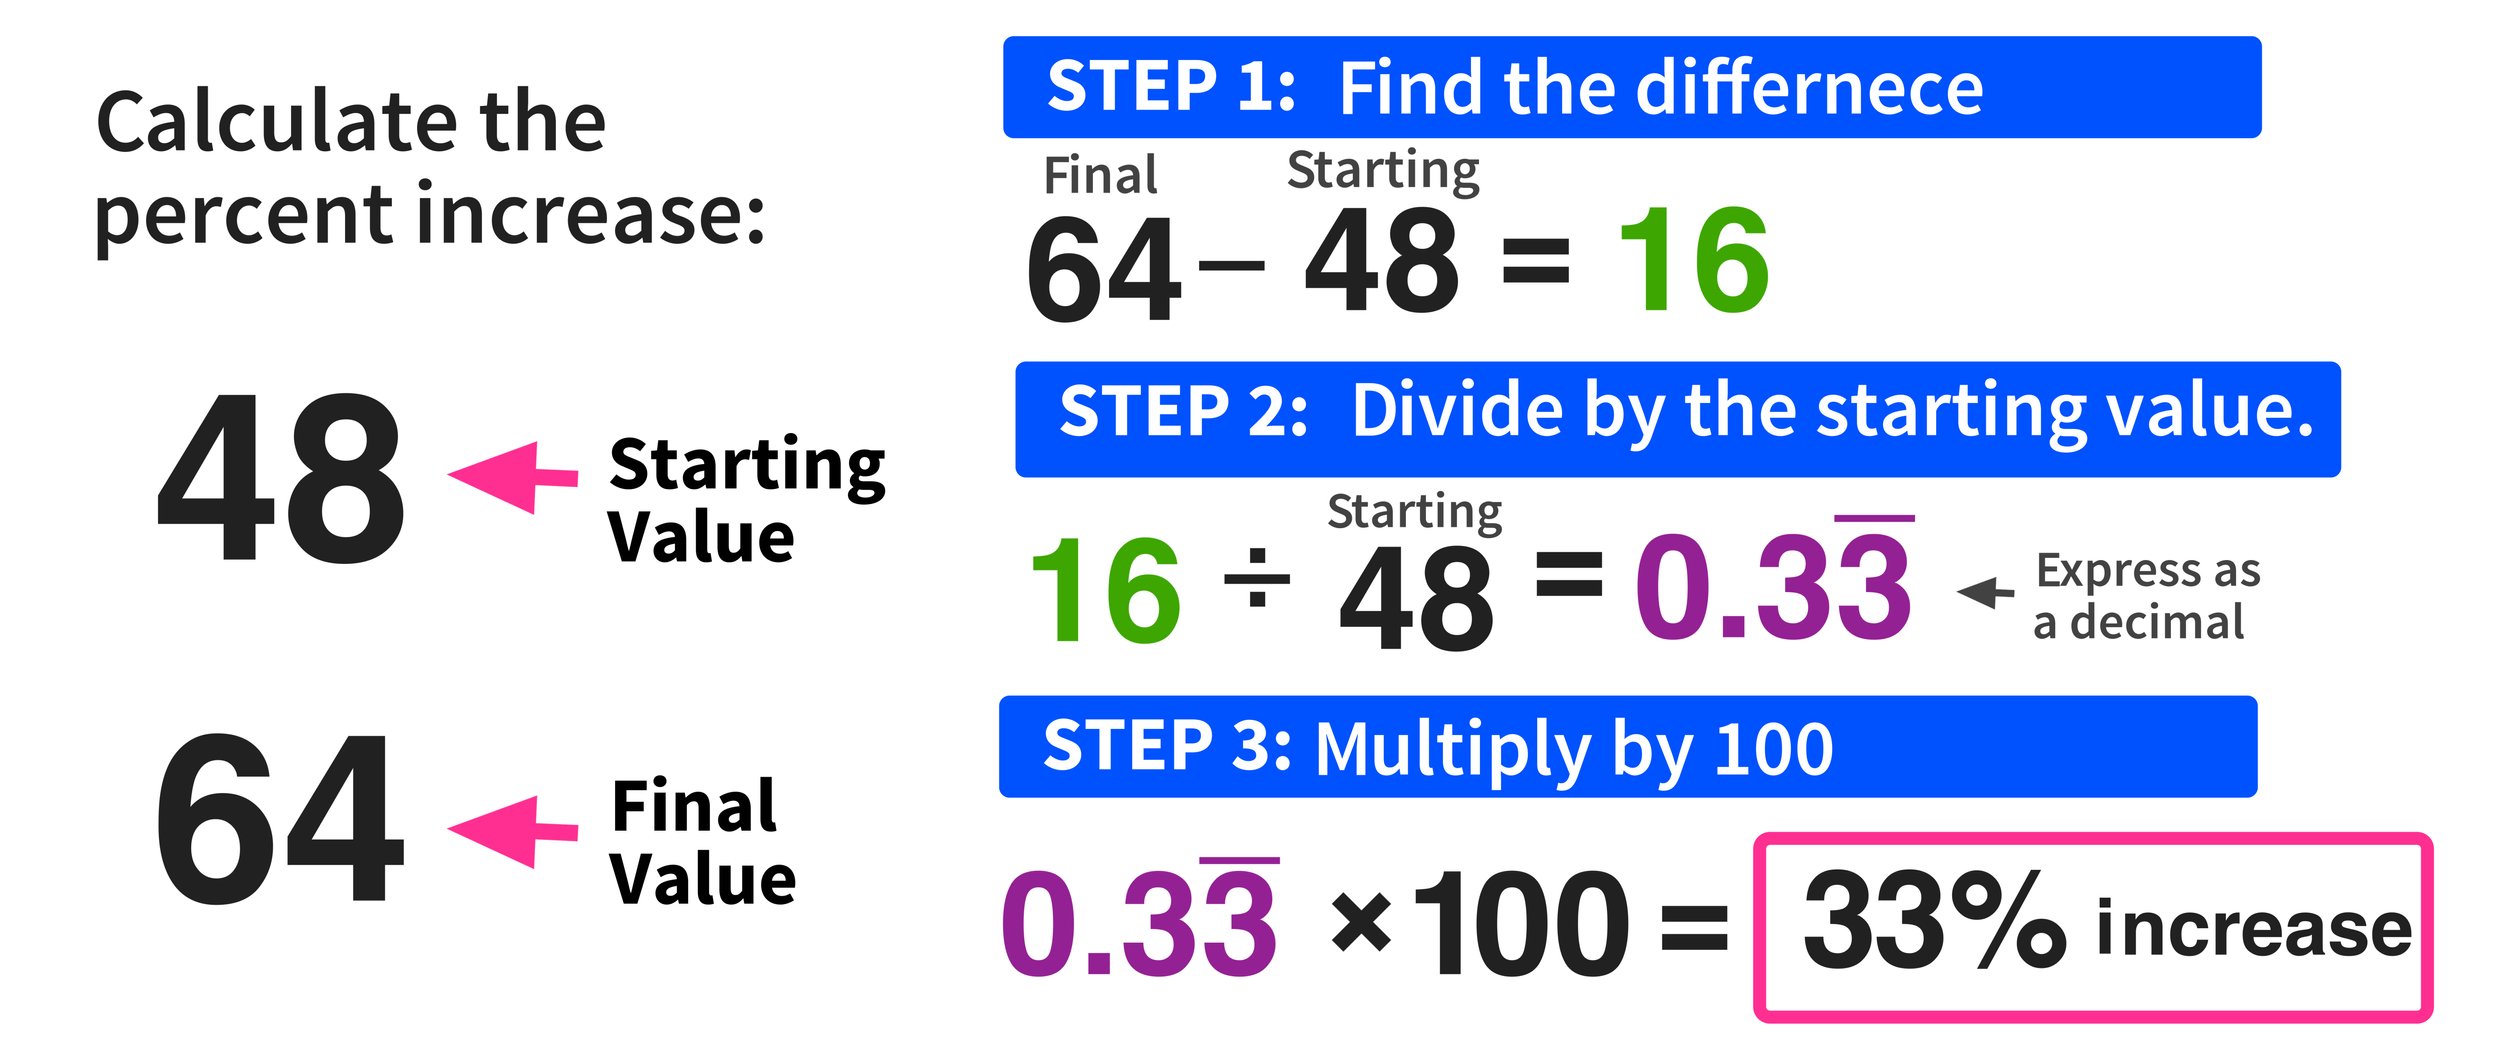
The universal formula for percentage increase is straightforward:
Percentage Increase = ((New Value - Old Value) / Old Value) * 100
Let’s break down each component:
- Old Value (or Original Value): This is your starting point, the baseline against which you are measuring growth.
- New Value: This is the current or end value, after the change has occurred.
- Difference (New Value – Old Value): This calculates the absolute amount of growth.
- Dividing by Old Value: This step normalizes the growth, expressing it as a fraction of the original size. This is crucial for comparison.
- Multiplying by 100: This converts the fractional result into a percentage, making it easily understandable.
Example: If your stock investment grew from $1,000 to $1,200.
- Old Value = $1,000
- New Value = $1,200
- Percentage Increase = (($1,200 – $1,000) / $1,000) * 100
- Percentage Increase = ($200 / $1,000) * 100
- Percentage Increase = 0.20 * 100
- Percentage Increase = 20%
This means your investment increased by 20%.
Why it Matters: Beyond Simple Subtraction
While the absolute dollar amount of change (e.g., $200) is useful, the percentage increase provides context. A $200 increase on a $1,000 investment (20%) is significantly different from a $200 increase on a $10,000 investment (2%). Percentages allow for standardized comparisons across different scales, making it an indispensable tool for financial analysis. Without it, comparing the performance of diverse assets or departments would be like comparing apples and oranges.
Practical Applications in Personal Finance
Percentage increase is a cornerstone of sound personal financial management, enabling individuals to track progress, make informed decisions, and plan for the future.
Tracking Investment Returns
Perhaps one of the most common applications, percentage increase is vital for evaluating investment performance. Whether it’s stocks, mutual funds, real estate, or even a savings account, knowing the percentage return helps you understand how effectively your money is working for you.
Example:
- You invested $5,000 in a mutual fund.
- After one year, its value is $5,600.
- Percentage Increase = (($5,600 – $5,000) / $5,000) * 100 = ($600 / $5,000) * 100 = 0.12 * 100 = 12%
This 12% return can then be compared to market benchmarks, other investments, or your personal financial goals. It’s the primary metric for judging investment success.
Evaluating Salary Raises and Wage Growth
When you receive a salary raise, understanding it as a percentage increase allows for a clear comparison of your growth year-over-year or against industry averages.
Example:
- Your annual salary was $60,000.
- After a raise, it’s $63,000.
- Percentage Increase = (($63,000 – $60,000) / $60,000) * 100 = ($3,000 / $60,000) * 100 = 0.05 * 100 = 5%
A 5% raise provides a more meaningful perspective than just the $3,000 absolute amount. You can compare this to inflation rates or the average wage growth in your industry to gauge if your purchasing power is truly increasing.
Understanding Inflation’s Impact
Inflation, the rate at which the general level of prices for goods and services is rising, is expressed as a percentage. Understanding percentage increase helps you measure how much more expensive goods have become and how it erodes the purchasing power of your money.
Example:
- A gallon of milk cost $3.50 last year.
- This year, it costs $3.65.
- Percentage Increase = (($3.65 – $3.50) / $3.50) * 100 = ($0.15 / $3.50) * 100 ≈ 0.0428 * 100 ≈ 4.28%
This percentage tells you the inflation rate for milk, allowing you to assess if your income growth is keeping pace.
Analyzing Budget Changes
Tracking your spending categories over time using percentage increase (or decrease) helps you identify trends and areas for adjustment in your personal budget.
Example:
- Your monthly utility bill was $150 in the winter.
- In the summer, with AC, it rose to $200.
- Percentage Increase = (($200 – $150) / $150) * 100 = ($50 / $150) * 100 ≈ 0.3333 * 100 ≈ 33.33%
This significant percentage increase highlights a seasonal expense pattern that might require budgeting adjustments.
Business Finance: Gauging Performance and Potential
In the business world, percentage increase is not just a useful metric; it’s a critical tool for strategic planning, performance evaluation, and investor communication. Businesses live and die by their growth rates.
Revenue and Profit Growth

Companies constantly track their revenue and profit growth as percentage increases. These figures are vital for assessing business health, setting targets, and attracting investors.
Example:
- A company’s quarterly revenue was $500,000 last year.
- This year, for the same quarter, it’s $625,000.
- Percentage Increase = (($625,000 – $500,000) / $500,000) * 100 = ($125,000 / $500,000) * 100 = 0.25 * 100 = 25%
A 25% revenue increase is a strong indicator of market success and operational efficiency, offering insight into the company’s trajectory.
Market Share Expansion
Businesses often want to know if their share of the overall market is growing. This is a percentage increase calculation applied to their sales relative to the total market sales.
Example:
- Your company’s sales accounted for $10 million of a $100 million market (10% market share) last year.
- This year, your sales are $12 million in a $105 million market (11.43% market share).
- While the absolute market share changed from 10% to 11.43%, the percentage increase in your market share is calculated on the market share figures themselves.
- Percentage Increase in Market Share = ((11.43% – 10%) / 10%) * 100 = (1.43% / 10%) * 100 = 0.143 * 100 = 14.3%
This shows a healthy growth in your competitive standing.
Expense Management and Cost Reduction
Just as percentage increase signals growth, percentage decrease helps identify cost savings. Calculating the percentage change in expenses over time is crucial for financial control.
Example:
- Monthly operating expenses were $20,000.
- After implementing new efficiencies, they dropped to $18,000.
- Percentage Decrease = (($18,000 – $20,000) / $20,000) * 100 = (-$2,000 / $20,000) * 100 = -0.10 * 100 = -10%
A -10% indicates a 10% reduction in expenses, a positive outcome for profitability.
Return on Investment (ROI) and Capital Appreciation
For businesses, especially when evaluating projects or new ventures, ROI is often expressed as a percentage increase. It compares the gain from an investment relative to its cost.
Example:
- A new marketing campaign cost $10,000.
- It generated an additional $15,000 in profit.
- ROI (Percentage Increase) = (($15,000 – $10,000) / $10,000) * 100 = ($5,000 / $10,000) * 100 = 0.50 * 100 = 50%
A 50% ROI demonstrates a strong return on the initial capital outlay.
Common Pitfalls and Nuances to Consider
While the calculation is simple, interpreting percentage increases correctly requires attention to detail and context.
Negative Starting Values
The standard percentage increase formula can produce misleading or nonsensical results if the “Old Value” is zero or negative. For instance, if a company went from losing $100 (negative profit) to breaking even ($0 profit), a percentage increase formula would fail. In such cases, it’s often more appropriate to discuss absolute change or a specific metric like “improved by $100.” When moving from negative to positive, the concept of a percentage increase loses its direct comparability and often requires a different analytical approach.
Percentage Points vs. Percentage Change
This is a common source of confusion, especially in financial news.
- Percentage Change: This is what we’ve been discussing – the relative increase from an old value. E.g., a stock increasing from $10 to $12 is a 20% percentage increase.
- Percentage Points: This refers to the absolute difference between two percentages. E.g., if a bond yield goes from 3% to 4%, it’s an increase of 1 percentage point, not a 1% increase. A 1% increase from 3% would be 3.03%. The difference between 3% and 4% is a 33.33% percentage change (calculated as ((4-3)/3)*100). Always clarify whether you are discussing percentage points or percentage change.
The Impact of Compounding (Annualized Growth)
For investments or loans over multiple periods, a simple percentage increase might not capture the full picture. Compound Annual Growth Rate (CAGR) is a more sophisticated measure that smooths out year-on-year volatility to show a steady annual growth rate. While it uses the principles of percentage increase, it accounts for the compounding effect over time, providing a more accurate representation of long-term financial performance.
Context is King: Absolute vs. Relative Change
A large percentage increase on a very small base can still represent a small absolute change. For example, an investment growing from $10 to $20 is a 100% increase, which sounds impressive. However, it’s only a $10 absolute gain. Conversely, a 1% increase on a $1 million portfolio is $10,000 – a relatively small percentage but a substantial absolute gain. Always consider both the percentage increase and the absolute change to fully understand the financial implications.
Leveraging Tools for Precision
While manual calculation is straightforward, financial professionals and individuals alike rely on tools to efficiently calculate and analyze percentage increases.
Spreadsheet Software (Excel, Google Sheets)
Spreadsheets are invaluable for financial calculations. They allow you to input your values, apply the percentage increase formula, and instantly see the results. Furthermore, you can apply the formula across entire datasets, track changes over time, and even visualize trends with charts.
- Formula in Excel/Google Sheets: If your old value is in cell A1 and your new value is in cell B1, the formula would be
=(B1-A1)/A1. To display it as a percentage, simply format the cell as “Percentage.” If you want it multiplied by 100 as a number, use=( (B1-A1)/A1 ) * 100.
Financial Calculators and Online Tools
Many dedicated financial calculators, both handheld and online, offer specific functions for calculating percentage change, growth rates, and returns. These can be particularly useful for more complex scenarios involving multiple periods or when dealing with concepts like CAGR. Numerous websites also offer simple percentage increase calculators where you can just plug in the two values and get an instant result.
Mastering the calculation and interpretation of percentage increase empowers you to make more informed financial decisions, whether you’re managing personal savings, evaluating investment opportunities, or steering a business towards profitability. It transforms raw numbers into actionable insights, revealing the story of financial growth and change.
aViewFromTheCave is a participant in the Amazon Services LLC Associates Program, an affiliate advertising program designed to provide a means for sites to earn advertising fees by advertising and linking to Amazon.com. Amazon, the Amazon logo, AmazonSupply, and the AmazonSupply logo are trademarks of Amazon.com, Inc. or its affiliates. As an Amazon Associate we earn affiliate commissions from qualifying purchases.