
In the dynamic world of finance, few metrics capture the collective health and investor sentiment of the U.S. stock market quite like the S&P 500. Representing 500 of the largest publicly traded companies in the United States, its performance is often viewed as a proxy for the broader economy. When investors ask, “How much is the S&P up this year?”, they’re seeking more than just a number; they’re looking for insight into market trends, economic strength, and the potential implications for their own portfolios. Understanding this year-to-date (YTD) performance involves delving into market mechanics, economic indicators, and the underlying forces shaping corporate America.
Understanding the S&P 500’s Year-to-Date Performance
The S&P 500’s year-to-date performance is a crucial metric that helps investors gauge the market’s trajectory over a specific period. It provides a snapshot, from January 1st to the current date, of how this bellwether index has performed, offering vital context for investment decisions.
What is “Up This Year”? Defining YTD Returns
Year-to-date (YTD) returns measure the percentage change in the value of an investment or index from the beginning of the current calendar year (January 1st) up to a specific point in time. For the S&P 500, this means tracking its movement from the opening bell on the first trading day of the year to the most recent close. A positive YTD return indicates that the index has gained value, while a negative return signifies a loss. This metric is particularly useful for short-to-medium-term analysis, allowing investors to quickly assess current market momentum and compare it against historical trends or other investment benchmarks. It’s a foundational piece of information for financial news, investor reports, and economic analyses, offering immediate context to market commentators and individual investors alike. However, it’s crucial to remember that YTD performance is a snapshot, not a forecast, and the actual number fluctuates constantly with market movements.
Key Factors Influencing S&P 500 Performance
The S&P 500’s movements are rarely arbitrary; they are the culmination of a complex interplay of macroeconomic forces, corporate fundamentals, and market sentiment.
Macroeconomic factors play a dominant role. Interest rate decisions by the Federal Reserve, for example, directly impact borrowing costs for businesses and consumers, influencing corporate profitability and economic growth. Higher rates can slow down economic activity, potentially dampening stock market returns, while lower rates can stimulate it. Inflation data, such as the Consumer Price Index (CPI) or Producer Price Index (PPI), also heavily influence market expectations. Persistent inflation can erode purchasing power and corporate margins, often prompting the Fed to raise rates. Conversely, deflationary pressures can signal economic weakness. Gross Domestic Product (GDP) reports offer a broad measure of economic output; stronger GDP growth generally bodes well for corporate earnings and, consequently, stock prices.
Corporate earnings are arguably the most direct driver of stock performance. The S&P 500 comprises 500 individual companies, and their combined profitability and growth prospects heavily dictate the index’s direction. Robust earnings reports, positive forward guidance, and strong revenue growth across multiple sectors provide a fundamental underpinning for market rallies. Conversely, widespread earnings misses or pessimistic outlooks can trigger broad sell-offs.
Geopolitical events introduce an element of unpredictable risk. Wars, trade disputes, political instability, and major international policy shifts can create uncertainty, leading to market volatility as investors reassess risks and opportunities. Finally, market sentiment – the collective attitude of investors towards financial markets – acts as an accelerant or decelerant. Optimism can fuel rallies, sometimes beyond fundamental justification, while fear and pessimism can lead to sharp downturns. This sentiment is often influenced by news cycles, expert opinions, and investor psychology.
The Current Landscape: Analyzing the Market’s Trajectory
To understand “how much the S&P is up this year” at any given moment, one must contextualize the current market environment. While providing a specific, real-time number here would be immediately outdated, the analytical approach remains constant. As investors look at the YTD return, they should consider the prevailing narratives shaping the economy. For instance, in some years, technological innovation and AI advancements might drive significant gains in the tech sector, pulling the entire index higher. In others, a focus on resilient consumer spending or a rebound in manufacturing could be the primary catalyst.
Interest rate expectations are almost always a central theme. Is the market pricing in rate cuts, suggesting an economic slowdown, or anticipating further hikes to combat inflation? The bond market, with its inverse relationship to interest rates, often provides critical clues. Furthermore, the labor market’s health, as indicated by job reports and unemployment rates, offers insights into consumer purchasing power and overall economic stability. A strong labor market typically supports economic growth and corporate earnings. Investors also track global economic data, as interconnected supply chains and international trade agreements mean that events in one part of the world can ripple through U.S. markets. Analyzing these broad themes allows one to understand why the S&P 500 is moving in a particular direction and what factors are most likely contributing to its current YTD performance, rather than just observing the numerical change.
Beyond the Headline Number: Deeper Dive into Market Dynamics
While the S&P 500’s headline YTD return offers a broad overview, a more granular examination reveals the nuanced forces at play within the market. Not all sectors or companies contribute equally to the index’s performance, and understanding these underlying dynamics is crucial for a complete picture.
Sectoral Performance: Winners and Losers
The S&P 500 is not a monolithic entity; it is composed of 11 distinct sectors, each with its own sensitivities to economic cycles and specific industry trends. When the overall index is “up,” it’s often due to outsized gains in one or a few dominant sectors, while others may lag or even decline. For instance, in periods of rapid technological advancement, sectors like Information Technology and Communication Services often lead the charge, driven by innovation, strong earnings from tech giants, and investor enthusiasm for growth stocks. Healthcare, typically seen as a defensive sector, might perform steadily regardless of the economic cycle due to its essential nature. Consumer Discretionary can thrive when consumer confidence and spending are high, whereas Consumer Staples tend to be more resilient during downturns.
Conversely, sectors like Real Estate or Utilities might be more sensitive to interest rate changes, facing headwinds when rates rise. Energy, dependent on commodity prices, experiences significant volatility. Financials are impacted by interest rates, lending activity, and overall economic health. A deep dive into sectoral performance helps investors understand the drivers of the index’s overall return and provides clues about the underlying economic strengths and weaknesses. It also highlights the importance of diversification, as relying too heavily on a single sector, even a high-performing one, can expose a portfolio to undue risk if that sector’s fortunes change.
The Role of Mega-Cap Stocks
A significant characteristic of the modern S&P 500 is the disproportionate influence of its largest companies, often referred to as “mega-cap” stocks. These are typically the behemoths of the tech world, but can also include dominant players in other sectors. Due to the S&P 500 being a market-capitalization-weighted index, companies with larger market caps have a greater impact on the index’s movements. This means that a strong performance from a handful of these mega-cap companies can significantly boost the S&P 500’s overall YTD return, even if a majority of the other 490+ companies are performing only moderately or even poorly.
This phenomenon has been particularly evident in recent years, where a select group of companies (sometimes dubbed the “Magnificent Seven” or similar monikers) has been responsible for a substantial portion of the index’s gains. While this concentration can lead to impressive headline returns, it also introduces a degree of risk. If these few dominant stocks face headwinds—due to regulatory scrutiny, competitive pressures, or a shift in market sentiment—their decline can exert a heavy drag on the entire index. Investors must be aware of this concentration effect and understand that the S&P 500’s performance doesn’t always reflect uniform strength across all 500 companies. It underscores the importance of looking beyond the aggregate number to see where the actual gains (and potential risks) are truly originating.
Volatility and Corrections
Even in a year where the S&P 500 shows a healthy YTD gain, the journey is rarely a straight line. Market volatility – the degree of variation in an index’s price over time – is a constant feature of investing. This means that even an “up” year will likely include periods of significant daily or weekly swings, including dips, pullbacks, and even full-blown corrections. A “correction” is typically defined as a decline of 10% or more from a recent peak. While frightening in the moment, corrections are a natural and often healthy part of market cycles, helping to wring out excesses and reset valuations.
Understanding volatility and the potential for corrections is vital for investors because it helps manage expectations and prevent panic selling. A strong YTD performance might be preceded or followed by a period of sharp declines. For instance, an index might be up 15% YTD, but within that period, it could have experienced a 12% drop at one point. These fluctuations test investors’ resolve and highlight the importance of emotional discipline. Long-term investors often view corrections as opportunities to buy quality assets at a discount, rather than signals to abandon their strategy. Recognizing that market movements are cyclical and that “up” years often contain significant periods of temporary decline is a key aspect of sophisticated financial literacy.
Interpreting S&P 500 Returns for Your Portfolio
Understanding the S&P 500’s YTD performance goes beyond mere observation; it’s about translating that information into actionable insights for personal financial planning and investment strategy. The index serves as a powerful benchmark, but its performance must be contextualized within an individual’s unique financial goals and risk tolerance.
Benchmarking Your Investments
For many investors, the S&P 500 is the gold standard for benchmarking. This means comparing the performance of your own investment portfolio against that of the index over the same period. If your diversified portfolio, consisting of a mix of stocks, bonds, and other assets, is up 8% YTD, but the S&P 500 is up 12% YTD, it indicates that your portfolio has underperformed the broad market. Conversely, if your portfolio is up 15% when the S&P 500 is up 12%, you’ve outperformed.
Benchmarking provides valuable feedback. It helps assess the effectiveness of your investment strategy, the performance of any actively managed funds you hold, or the relative strength of your stock selections. However, it’s crucial to apply this benchmark appropriately. If your portfolio is designed for lower risk and income generation, it might not be expected to match the S&P 500’s returns during strong growth periods. Similarly, if your portfolio is heavily concentrated in a specific sector or region, its performance might deviate significantly. The S&P 500 is a benchmark for U.S. large-cap equities, so comparing it against a globally diversified, multi-asset portfolio requires a nuanced interpretation. The goal isn’t always to beat the S&P 500, but to understand why your portfolio performed as it did in relation to it, and if that performance aligns with your financial objectives.
Long-Term vs. Short-Term Perspective
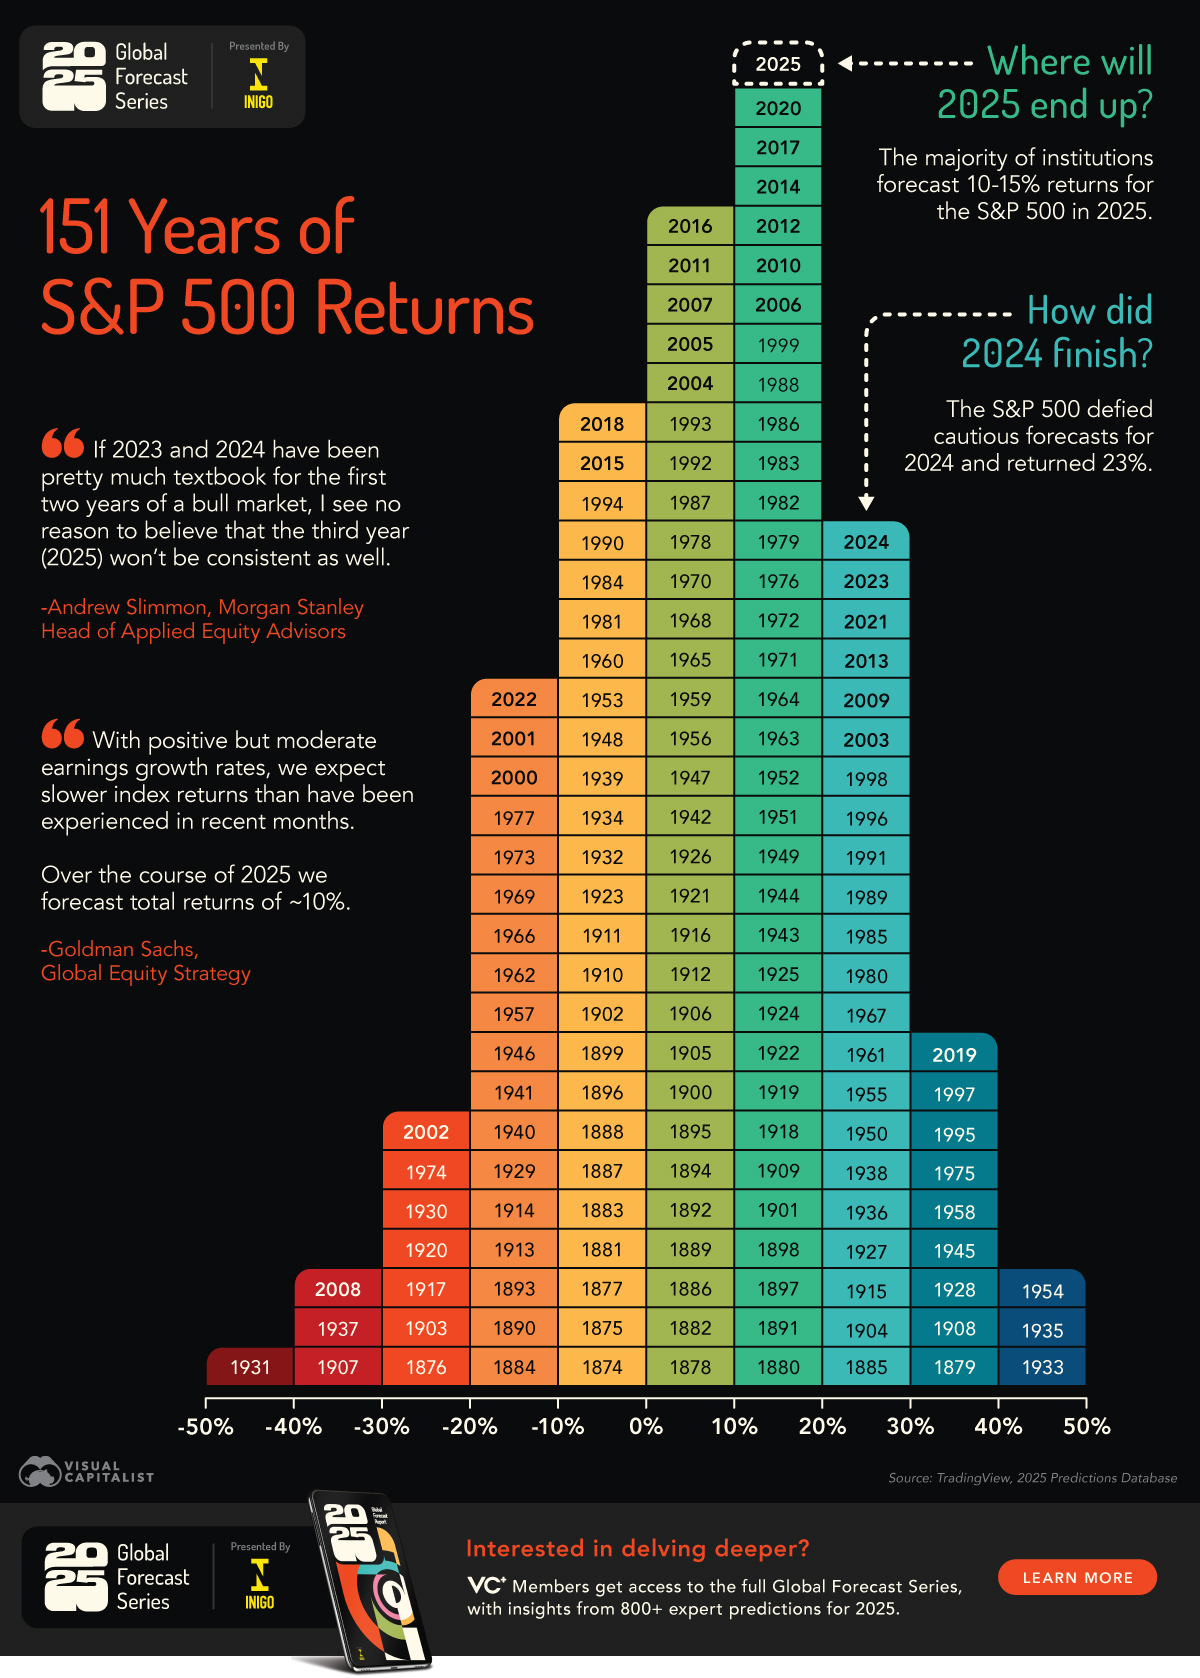
The “how much is the S&P up this year” question inherently focuses on a short-term, year-to-date perspective. While valuable for current market assessment, it’s critical to balance this with a long-term outlook. Stock markets are notoriously unpredictable in the short run. A single year’s performance, whether remarkably good or surprisingly bad, is just one data point in a much longer investment journey. Historically, the S&P 500 has demonstrated a strong upward trend over decades, averaging returns of around 10% annually over very long periods, despite numerous recessions, corrections, and even crashes along the way.
This long-term perspective emphasizes the power of compounding and the importance of staying invested through market cycles. Trying to time the market based on YTD figures often leads to suboptimal results, as investors frequently miss the best performing days or buy high and sell low out of fear or greed. A strong YTD return can be encouraging, but it should not lead to overconfidence or aggressive, short-sighted decisions. Conversely, a negative YTD return, while disheartening, should not trigger panic, especially for investors with many years until retirement. A consistent investment strategy, focused on long-term goals and periodic rebalancing, typically outperforms reactive approaches driven by short-term market fluctuations.
Diversification and Risk Management
No matter how impressive the S&P 500’s YTD gains might be, robust personal finance and investing strategies always prioritize diversification and risk management. Investing solely in an S&P 500 index fund or individual stocks within the index exposes you to specific risks. While the S&P 500 itself is diversified across 500 companies and 11 sectors, it still represents only U.S. large-cap equities. A truly diversified portfolio often includes:
- International equities: To capitalize on growth outside the U.S. and mitigate country-specific risks.
- Bonds: To reduce overall portfolio volatility, provide income, and act as a hedge during stock market downturns.
- Other asset classes: Such as real estate, commodities, or alternative investments, depending on the investor’s profile.
Even if the S&P 500 has a stellar year, an individual portfolio might not fully capture those gains if it’s deliberately diversified into lower-risk assets like bonds, or if it includes underperforming international markets. This is a trade-off for reduced overall risk. Diversification aims to smooth out returns, ensuring that a downturn in one area doesn’t derail the entire portfolio. Risk management also involves understanding your personal risk tolerance, setting appropriate asset allocations, and regularly rebalancing your portfolio to maintain your desired risk level. While the S&P 500 provides a crucial benchmark, it’s one piece of a much larger and more personal puzzle for achieving financial security.
Navigating Future Market Outlooks
Understanding “how much the S&P is up this year” is fundamentally a look backward at performance. However, for investors, the true utility of this information lies in how it informs their forward-looking strategies. Navigating future market outlooks requires a continuous assessment of economic indicators, a healthy skepticism towards forecasts, and a commitment to ongoing learning and adaptation.
Economic Indicators to Watch
For any investor concerned with the S&P 500’s future trajectory, a vigilant eye on key economic indicators is paramount. These data points provide the most objective insights into the health of the economy, which in turn influences corporate earnings and market sentiment.
Inflation data, primarily the Consumer Price Index (CPI) and the Personal Consumption Expenditures (PCE) price index, are critical. Persistently high inflation can erode profit margins and consumer purchasing power, often prompting central banks to raise interest rates, which can cool economic activity and equity valuations.
Employment reports, including the Non-Farm Payrolls, unemployment rate, and wage growth, indicate the strength of the labor market. A robust job market suggests strong consumer spending potential, supporting economic growth. Conversely, rising unemployment or stagnant wages can signal a slowdown.
Federal Reserve interest rate decisions are perhaps the most closely watched. Changes in the federal funds rate have widespread implications for borrowing costs, corporate investments, and economic expansion. The market often reacts strongly to the Fed’s commentary and rate projections.
Corporate earnings guidance from S&P 500 companies themselves offers direct insights into future profitability. When companies raise their outlooks, it can boost investor confidence; when they lower them, it can signal impending headwinds.
Finally, geopolitical stability and major international events always bear watching, as they can introduce significant unforeseen risks and opportunities to global markets. Collectively, these indicators form a mosaic that helps investors anticipate potential shifts in the S&P 500’s performance.
Expert Forecasts vs. Personal Strategy
Financial media is awash with expert forecasts about where the S&P 500 will end the year, what sectors will outperform, or whether a recession is imminent. These predictions come from seasoned analysts, economists, and market strategists, and they can be insightful, offering different perspectives and highlighting potential risks or opportunities. However, it’s crucial for individual investors to approach these forecasts with a healthy degree of skepticism and to prioritize their personal financial strategy above all else.
No one has a crystal ball, and even the most brilliant minds often disagree on market direction. Relying solely on a single expert’s prediction can lead to reactive and suboptimal investment decisions. Instead, investors should use expert forecasts as one piece of information to inform their understanding of market narratives and potential scenarios, rather than as mandates for action. Your personal strategy, built on your individual financial goals, risk tolerance, time horizon, and a well-diversified portfolio, should be the bedrock. This means sticking to your asset allocation, regularly rebalancing, and making adjustments based on your life circumstances, not on the latest market prediction. A disciplined, long-term approach, even if it means occasionally underperforming a “hot” sector or missing a short-term rally, generally proves more successful and less stressful than trying to chase every forecast.
Continuous Learning and Adaptation
The financial markets are not static; they are ever-evolving ecosystems shaped by technological advancements, demographic shifts, regulatory changes, and unforeseen global events. Consequently, navigating future market outlooks, and indeed maintaining financial health, requires a commitment to continuous learning and adaptation.
Staying informed means regularly consuming reputable financial news, reading analyses, and understanding the implications of new economic data. This doesn’t mean becoming a day trader, but rather developing a foundational understanding of how different economic forces can impact your investments. Adaptation involves being prepared to adjust your financial plan and portfolio as your life circumstances change (e.g., career shifts, family growth, retirement approaching) or as the broader economic landscape undergoes significant structural shifts. For instance, the rise of AI could create new investment opportunities and render others obsolete, necessitating a re-evaluation of sector exposures.
This process of learning and adaptation helps investors remain resilient through various market conditions, making informed decisions rather than reactive ones. It reinforces the idea that investing is a journey, not a destination, and that the most successful investors are those who remain curious, disciplined, and flexible in the face of an ever-changing financial world.

Conclusion
The question “How much is the S&P up this year?” serves as a powerful entry point into understanding the intricate dynamics of the financial markets. While the year-to-date return provides a concise snapshot of market performance, its true value emerges when viewed through the lens of deeper analysis. This involves dissecting the macroeconomic factors at play, recognizing the disproportionate influence of mega-cap stocks, appreciating the constant presence of volatility, and understanding the varying contributions of different market sectors.
For the savvy investor, the S&P 500’s YTD figure is not merely a number to be celebrated or lamented, but a critical benchmark. It prompts a reflective comparison with one’s own portfolio, a reinforcement of the long-term investment philosophy over short-term noise, and a reminder of the foundational importance of diversification and robust risk management. As we look ahead, navigating the future requires a continuous engagement with key economic indicators, a balanced perspective on expert forecasts, and an unwavering commitment to personal financial education and strategic adaptation. Ultimately, sustained financial well-being is not dictated by a single year’s S&P 500 performance, but by a consistent, informed, and disciplined approach to investing within the ever-evolving landscape of money and markets.
aViewFromTheCave is a participant in the Amazon Services LLC Associates Program, an affiliate advertising program designed to provide a means for sites to earn advertising fees by advertising and linking to Amazon.com. Amazon, the Amazon logo, AmazonSupply, and the AmazonSupply logo are trademarks of Amazon.com, Inc. or its affiliates. As an Amazon Associate we earn affiliate commissions from qualifying purchases.