
Understanding the daily gyrations of the stock market can feel like trying to catch mist with a sieve. Headlines scream about gains and losses, analysts offer conflicting forecasts, and the sheer volume of information can be overwhelming. Yet, for investors, business owners, and anyone concerned with their financial future, comprehending the forces at play in the market “today” is crucial. While no single article can capture the real-time, minute-by-minute fluctuations of a global financial system, we can dissect the mechanisms, indicators, and overarching themes that typically define a market day, empowering you to better interpret the headlines and make informed decisions.
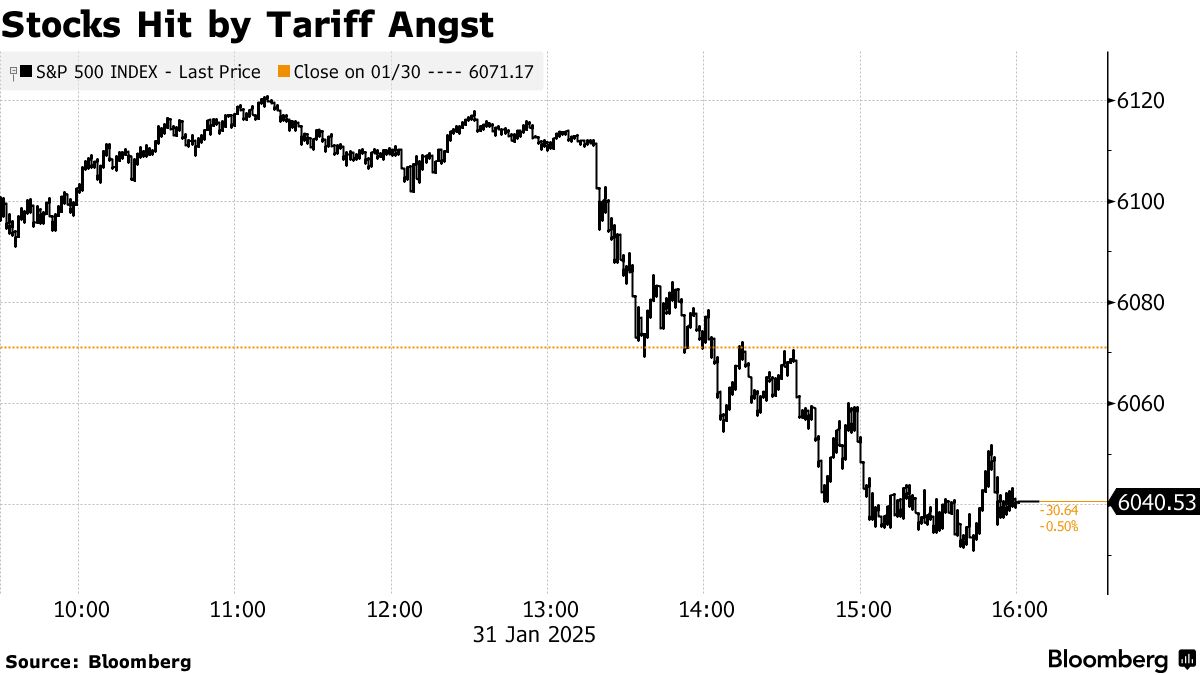
The stock market is a complex ecosystem, constantly reacting to a myriad of inputs—from economic data releases and corporate earnings reports to geopolitical tensions and shifts in investor sentiment. Focusing solely on “today’s” performance can be misleading if taken in isolation. Instead, we’ll explore how these daily movements fit into a broader narrative, offering a professional, insightful, and engaging look into the pulse of the market.
Unpacking Today’s Market Pulse: A Snapshot
Every trading day begins with anticipation and ends with reflection, as millions of transactions paint a picture of collective sentiment. But what does it truly mean when we ask “what is the market doing today?” It involves a real-time assessment of major indices, sector performance, and trading volumes that collectively tell a story.
The Major Indices: Dow, S&P 500, Nasdaq
When news outlets report on the stock market’s performance, they typically refer to the movements of key market indices. These indices are not individual stocks but baskets of stocks designed to represent different segments of the market or the broader economy.
- The Dow Jones Industrial Average (DJIA): Often simply called “the Dow,” this index tracks 30 large, publicly owned companies trading on the New York Stock Exchange and Nasdaq. It’s price-weighted, meaning stocks with higher share prices have a greater impact on the index’s value. While historically significant, it’s a narrow measure, representing only a small slice of the overall market.
- The S&P 500 Index: Widely considered the best gauge of large-cap U.S. equities and the overall health of the U.S. stock market, the S&P 500 tracks 500 large U.S. companies selected by S&P Dow Jones Indices. It’s market-capitalization weighted, meaning companies with larger market values have a greater impact. Its breadth makes it a much more representative indicator than the Dow.
- The Nasdaq Composite Index: This index measures the performance of all common stocks listed on the Nasdaq stock market. It’s heavily weighted towards technology and growth companies, making it a key indicator for the tech sector’s health. When tech stocks are soaring or struggling, the Nasdaq often reflects this more dramatically than the other indices.
On any given day, observing how these three indices move relative to each other can provide initial clues. Is the market broadly up or down (all three moving in the same direction)? Or is there a rotation, with tech leading while industrials lag, or vice versa?
Early Market Sentiment and Opening Bell Dynamics
The market’s initial direction is often set by pre-market trading and global market cues. Futures contracts for the S&P 500, Dow, and Nasdaq provide a hint of where the market might open. Asian and European market performance overnight can also set the tone. Economic reports released before the market opens (e.g., jobless claims, manufacturing data) can trigger immediate reactions. The “opening bell” is more than just a ceremony; it’s the moment when pent-up orders from overnight are executed, often leading to increased volatility in the first few minutes of trading. Understanding these early dynamics helps in forming an initial hypothesis about the day’s likely trend.
Mid-Day Trends and Volume Analysis
As the day progresses, patterns emerge. Does the initial move hold, or does the market reverse course? Volume—the number of shares traded—is a critical piece of the puzzle. High volume accompanying a significant price move suggests conviction behind that move, while low volume might indicate less certainty or participation. For instance, a strong rally on light volume might be viewed with skepticism, as it could easily reverse. Conversely, a sharp decline on heavy volume signals strong selling pressure. Analysts often scrutinize sector-specific volumes to identify areas of particular strength or weakness.
Key Drivers Behind Daily Fluctuations
The stock market doesn’t move arbitrarily. Its daily shifts are almost always attributable to a confluence of factors, ranging from macroeconomic announcements to individual corporate events. Pinpointing these drivers is essential for understanding the “why” behind today’s market action.
Economic Data Releases
Regularly scheduled economic data releases are powerful market movers. These reports offer insights into the health of the economy, influencing investor expectations about corporate profits, consumer spending, and interest rates.
- Inflation Reports (CPI, PPI): Higher-than-expected inflation often signals that central banks may need to raise interest rates, which can dampen corporate earnings and make bonds more attractive relative to stocks.
- Employment Data (Non-Farm Payrolls, Unemployment Rate): Strong job growth and low unemployment generally indicate a healthy economy, boosting consumer confidence and spending. However, excessively strong job data can also fuel inflation fears.
- Gross Domestic Product (GDP): This broad measure of economic output indicates whether the economy is growing or contracting. A robust GDP report is usually positive for stocks, while a contraction can spark recession fears.
- Consumer Confidence and Retail Sales: These reports gauge consumer sentiment and spending habits, which are critical drivers of corporate revenue.
Unexpected deviations from economists’ forecasts in any of these areas can cause immediate and significant market reactions.
Corporate Earnings and Announcements
Beyond broad economic trends, individual company performance is a major daily driver. During earnings season, which occurs quarterly, companies release their financial results.
- Earnings Per Share (EPS) and Revenue: Investors closely watch whether companies beat or miss analysts’ expectations for EPS and revenue. A strong beat can send a stock soaring, while a miss can lead to a sharp decline, often affecting entire sectors.
- Guidance and Outlook: Equally important is a company’s forward-looking guidance on future earnings and revenue. A cautious outlook, even after a strong quarter, can temper investor enthusiasm.
- Mergers & Acquisitions (M&A) and Product Launches: Significant corporate announcements, such as a major acquisition, a new product launch, or a change in leadership, can dramatically impact a company’s stock price and have ripple effects across its sector or even the broader market.
On any given day, a few major earnings reports or corporate news items can dominate the market narrative.
Geopolitical Events and Global Market Impact
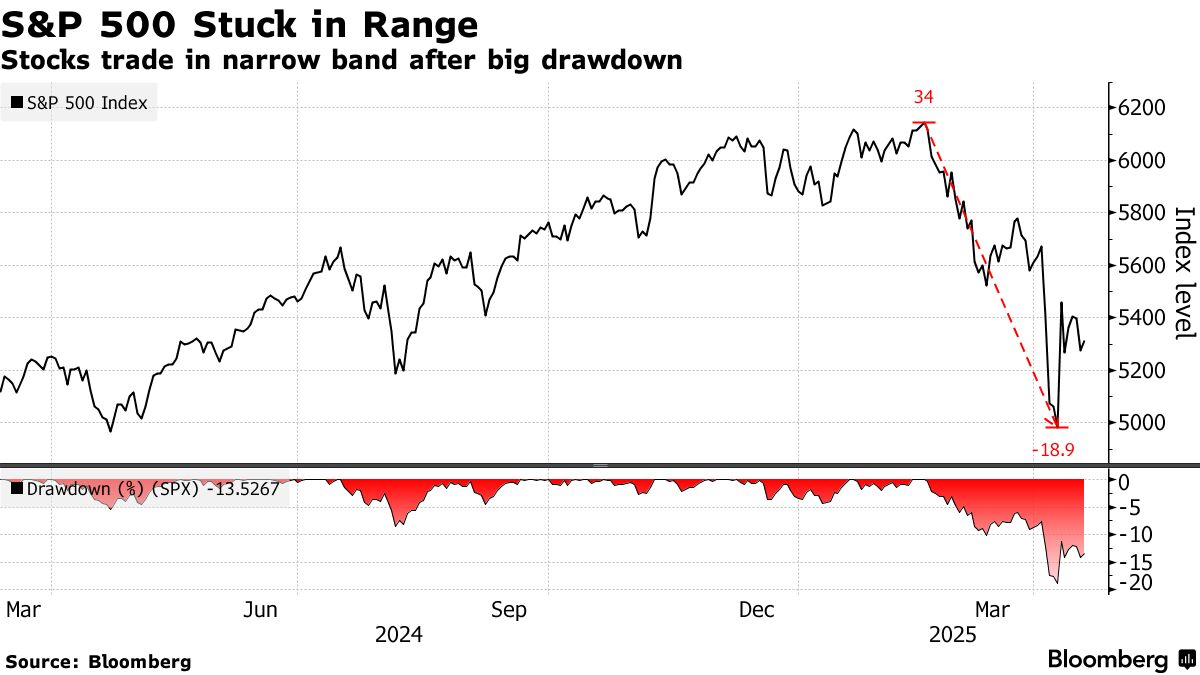
The stock market is not an island. International events—from political instability in key regions to trade disputes, natural disasters, or global health crises—can send shockwaves through financial markets worldwide.
- Geopolitical Tensions: Conflicts, sanctions, or heightened tensions between nations can disrupt supply chains, impact commodity prices (especially oil), and create uncertainty, leading investors to seek safer assets.
- Trade Policy: Changes in trade agreements or the imposition of tariffs can affect multinational corporations, altering their cost structures and revenue prospects.
- Global Economic Health: The performance of major economies like China and the Eurozone can have significant implications for global demand and corporate earnings, particularly for companies with international exposure.
These events introduce an element of unpredictability, often leading to knee-jerk reactions in the market as investors attempt to price in new risks or opportunities.
Central Bank Commentary and Monetary Policy Expectations
Central banks, such as the U.S. Federal Reserve, play a pivotal role in influencing financial markets through their monetary policy decisions. Their actions and guidance directly impact interest rates, liquidity, and investor confidence.
- Interest Rate Decisions: When central banks raise interest rates, borrowing becomes more expensive, potentially slowing economic growth and making bonds more attractive. Lowering rates has the opposite effect. Market participants constantly try to predict the next move.
- Quantitative Easing/Tightening: These policies involve buying or selling government bonds to inject or withdraw liquidity from the financial system, influencing long-term interest rates and market sentiment.
- Speeches and Minutes: Statements from central bank officials or the minutes of their meetings are dissected for clues about future policy direction. A hawkish tone (suggesting tighter policy) can lead to market jitters, while a dovish tone (suggesting looser policy) can be a positive catalyst.
Expectations surrounding central bank policy are often the most significant daily driver, as they ripple through every aspect of the financial system.
Interpreting Market Indicators and Sector Performance
Beyond the headline numbers, a deeper dive into market breadth, volatility, and sector-specific performance offers a more nuanced understanding of what the market is truly doing today.
Leading and Lagging Sectors
The stock market is composed of various sectors, such as technology, healthcare, financials, energy, and consumer discretionary. On any given day, some sectors will outperform while others underperform. This “sector rotation” can be a powerful indicator.
- Cyclical vs. Defensive: During periods of economic strength, “cyclical” sectors (e.g., industrials, consumer discretionary, energy) tend to do well. During downturns or uncertainty, “defensive” sectors (e.g., utilities, healthcare, consumer staples) often hold up better as they provide essential goods and services.
- Growth vs. Value: Technology stocks are often categorized as “growth” stocks, while older, more established companies with lower valuations are “value” stocks. Shifts between these styles can significantly impact market leadership.
Identifying today’s leading and lagging sectors can reveal underlying themes, such as a flight to safety, renewed enthusiasm for growth, or a response to commodity price movements.
Volatility Index (VIX) as a Fear Gauge
The CBOE Volatility Index, or VIX, is often referred to as the market’s “fear gauge.” It measures the market’s expectation of future volatility, derived from the implied volatility of S&P 500 index options.
- High VIX: A rising VIX indicates increased uncertainty and fear among investors, often accompanying sharp market declines.
- Low VIX: A low VIX suggests complacency and stability, typically seen during bull markets or periods of calm.
Monitoring the VIX alongside daily market movements provides context. Is today’s decline orderly, or is it accompanied by a surge in fear? This distinction can be crucial for investors deciding whether to panic or view the dip as a buying opportunity.
Bond Market Signals and Interest Rate Expectations
The bond market, particularly U.S. Treasury yields, provides critical signals about interest rate expectations and economic outlook.
- Treasury Yields: A rise in Treasury yields can make bonds more attractive relative to stocks, especially for income-seeking investors, and can increase borrowing costs for companies, potentially compressing their profits.
- Yield Curve: The shape of the yield curve (the difference between short-term and long-term bond yields) is a closely watched indicator. An “inverted” yield curve (where short-term yields are higher than long-term yields) has historically been a reliable predictor of economic recessions.
Today’s stock market action often correlates with movements in the bond market. For example, a sharp rise in long-term yields can put downward pressure on growth stocks, which are more sensitive to interest rate changes.
Strategic Considerations for Investors
While understanding what the stock market is doing today is engaging, it’s vital for investors to maintain a strategic, long-term perspective. Daily fluctuations are part and parcel of investing and rarely dictate the ultimate success of a well-thought-out financial plan.
Staying Informed Without Being Overwhelmed
It’s a fine line between being informed and being inundated. Choose a few reliable financial news sources and check them periodically rather than constantly. Focus on understanding the overarching themes and drivers rather than getting caught up in every hourly fluctuation. Real-time market data can be mesmerizing, but it often encourages emotional decision-making.
Rebalancing Your Portfolio
“What is the stock market doing today?” can also serve as a prompt for portfolio rebalancing. If one sector or asset class has performed exceptionally well, it might now represent a larger portion of your portfolio than you initially intended. Periodically rebalancing—selling some of the outperforming assets and buying more of the underperforming ones—helps maintain your desired asset allocation and risk profile. This disciplined approach prevents your portfolio from drifting too far from your strategic goals based on short-term market movements.
Consulting Financial Professionals
For many, navigating the complexities of the stock market requires expert guidance. A qualified financial advisor can help you understand your risk tolerance, set realistic financial goals, construct a diversified portfolio, and provide context to daily market events. They can help you differentiate between short-term noise and significant trends, ensuring your investment strategy remains aligned with your long-term objectives, regardless of what the market “is doing today.”
In conclusion, “what is the current stock market doing today?” is a question that opens a window into a vast and dynamic financial world. While the immediate answer involves observing indices, sectors, and volumes, a truly insightful response requires understanding the economic, corporate, and geopolitical forces driving those numbers. For the informed investor, this daily pulse is not a call to immediate action but a valuable piece of information to contextualize their long-term financial journey.
aViewFromTheCave is a participant in the Amazon Services LLC Associates Program, an affiliate advertising program designed to provide a means for sites to earn advertising fees by advertising and linking to Amazon.com. Amazon, the Amazon logo, AmazonSupply, and the AmazonSupply logo are trademarks of Amazon.com, Inc. or its affiliates. As an Amazon Associate we earn affiliate commissions from qualifying purchases.