
The Dow Jones Industrial Average (DJIA), often simply referred to as “the Dow,” stands as one of the oldest and most widely recognized stock market indices in the world. For over a century, it has served as a critical barometer for the health and direction of the U.S. stock market and, by extension, the broader economy. However, despite its pervasive influence and frequent mentions in financial news, the precise methodology behind its calculation remains a point of confusion for many. Understanding how the Dow is computed is essential for investors seeking to interpret market movements accurately and for anyone aiming to grasp the nuances of financial reporting.
Understanding the Dow Jones Industrial Average (DJIA)
Founded by Charles Dow in 1896, the DJIA was originally conceived to provide a clear, simplified view of the market’s performance. Unlike many modern indices that leverage sophisticated computational models, the Dow’s methodology harks back to an earlier era, employing a distinctive price-weighted approach.
A Brief History and Purpose
Initially comprising just 12 industrial companies, the DJIA expanded to 20 in 1916 and settled on its current roster of 30 companies in 1928. Its original intent was to track the performance of the largest and most influential industrial corporations in the United States, offering a snapshot of the nation’s economic engine. Over time, as the U.S. economy evolved from primarily industrial to a more diversified landscape encompassing technology, finance, and healthcare, the composition of the Dow has adapted, though its “Industrial Average” moniker persists as a historical legacy rather than a literal description. Its purpose remains to reflect the sentiment and performance of a select group of blue-chip companies, representing various sectors of the U.S. economy.
The “Average” Misnomer
One of the most common misconceptions about the DJIA is that it’s a simple arithmetic average of its component stock prices. While conceptually related, the term “average” is somewhat misleading in its modern application. If it were a straightforward average, a stock split by one of its high-priced components would dramatically skew the index’s value, suggesting a market decline that didn’t truly occur. To counteract such distortions and ensure continuity, a unique adjustment mechanism, known as the Dow Divisor, plays a crucial role in its calculation, moving it beyond a mere sum divided by 30.
The Price-Weighted Calculation Method
At its core, the DJIA is a price-weighted index. This means that stocks with higher share prices have a greater impact on the index’s value than those with lower share prices, regardless of their market capitalization (the total value of all outstanding shares). This stands in contrast to market-capitalization-weighted indices like the S&P 500, where a company’s influence on the index is proportional to its total market value.
Identifying the 30 Component Stocks
The selection of the 30 companies that constitute the DJIA is not based on rigid quantitative rules but rather on the discretion of a committee from S&P Dow Jones Indices. The primary criteria for inclusion are a company’s reputation, sustained growth, interest to a large number of investors, and its representation of the broader U.S. economy. These are typically large, well-established “blue-chip” companies with a significant track record. The committee aims for sector diversity while ensuring the chosen companies maintain “excellent reputations” and demonstrate a history of growth. Changes to the components are infrequent, typically occurring only when a company’s business is no longer representative of the overall economy, or due to significant corporate actions like mergers or bankruptcies.
The Role of the Divisor
The ingenious element that allows the Dow to maintain historical continuity and meaning despite stock splits, dividends, and changes in its constituent companies is the Dow Divisor. Originally, the Dow was calculated by summing the prices of its component stocks and dividing by the number of stocks (e.g., 12, then 20, then 30). However, if a stock in the index splits (e.g., a 2-for-1 split halves its price), a simple division by 30 would make the index appear to fall, even if the underlying value of the company and the market remains unchanged.
The divisor is adjusted to counteract these effects. When a component stock splits, or when a company is added or removed, the divisor is changed so that the index value remains the same immediately before and after the event. This ensures that the only factors affecting the Dow’s reported value are genuine movements in the market prices of its component stocks. The divisor is a small decimal number, significantly less than 30, and it continuously fluctuates based on these adjustments.
Formula Explained
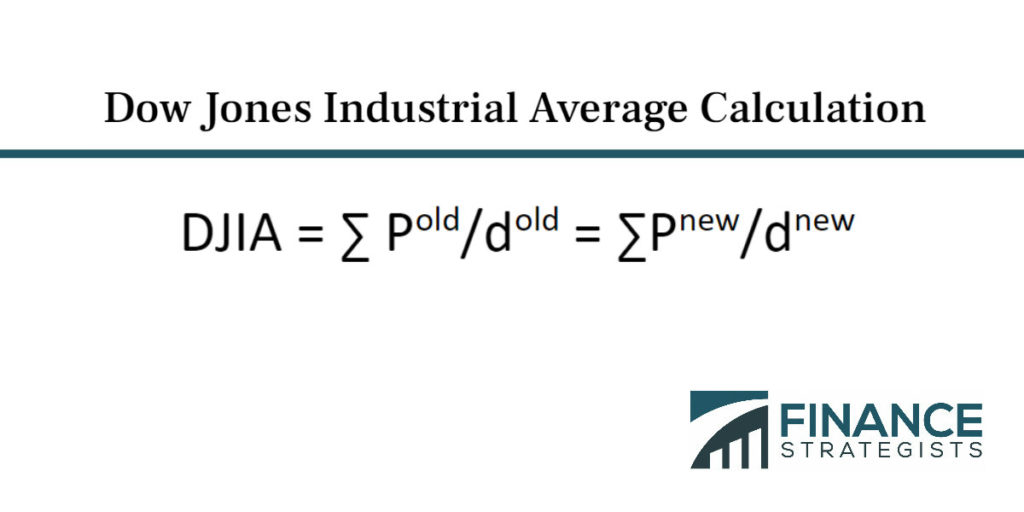
The calculation of the Dow Jones Industrial Average is elegantly simple once the concept of the divisor is understood:
DJIA = Sum of the prices of the 30 component stocks / Dow Divisor
To illustrate, if the sum of the prices of the 30 stocks is, for example, $3,000, and the current Dow Divisor is 0.15172752595384, then the DJIA would be approximately 19,772.39. Each dollar change in the price of any of the 30 component stocks translates to a change of approximately 1/Divisor points in the DJIA. This means a one-dollar movement in a high-priced stock has the same impact on the index as a one-dollar movement in a low-priced stock, reinforcing the price-weighted characteristic.
The Importance of the Dow Divisor
The Dow Divisor is perhaps the most critical, yet least understood, component of the DJIA’s calculation. It is not a fixed number and is constantly being re-evaluated and adjusted to ensure the index’s integrity and historical consistency.

Adjustments for Stock Splits and Dividends
When a stock within the DJIA undergoes a split (e.g., 2-for-1, 3-for-1), its share price decreases proportionately. Without an adjustment to the divisor, the index would immediately drop, creating a false impression of market decline. To prevent this, the divisor is reduced, ensuring that the total sum of the new, lower stock prices divided by the new, smaller divisor yields the exact same index value as before the split. Similarly, stock dividends (typically those greater than 10% of the share price) also necessitate an adjustment to the divisor. Normal cash dividends, however, do not trigger a divisor adjustment, as they are a routine distribution of corporate earnings.
Corporate Spin-offs and Mergers
Complex corporate actions also demand divisor adjustments. When a company within the Dow spins off a subsidiary into a separate publicly traded entity, the value of the original company’s stock typically changes. To reflect this and maintain continuity, the divisor is recalibrated. Mergers and acquisitions involving a Dow component can also lead to changes in its stock price or even its replacement within the index, all of which require precise adjustments to the divisor to prevent artificial fluctuations in the DJIA’s value.
Changes in Component Companies
Perhaps the most significant adjustments to the divisor occur when a component company is removed from the index and replaced by another. This happens when a company’s business no longer represents the broader economy, or in cases of bankruptcy or delisting. When a high-priced stock is replaced by a lower-priced one, or vice-versa, the divisor must be adjusted so that the index level remains unchanged at the moment of the substitution. This mechanism ensures that observed changes in the DJIA genuinely reflect market movements and not merely administrative changes to its composition.
Criticisms and Alternatives
While widely quoted, the DJIA is not without its critics. Its unique calculation method and limited scope have led many financial professionals to favor alternative indices for a more comprehensive market view.
Limited Scope and Representation
One of the primary criticisms is that 30 large companies, while significant, may not adequately represent the vast and diverse U.S. stock market, which includes thousands of publicly traded companies across all market capitalizations. The Dow’s focus on large-cap, established firms means it largely ignores the performance of small and mid-cap companies, as well as emerging sectors and innovative startups that might drive significant economic growth. This narrow focus can sometimes lead to a skewed perception of overall market health.
Disadvantage of Price-Weighting
The price-weighted nature of the DJIA is another frequent point of contention. A dollar change in a high-priced stock, like UnitedHealth Group (as of this writing, one of the highest-priced Dow components), has a much greater impact on the index than a dollar change in a lower-priced stock, like Cisco Systems, even if Cisco has a larger market capitalization or greater economic significance. This means that a relatively small company with a high share price can exert more influence over the Dow’s movements than a much larger, more economically significant company with a lower share price. This can create a distorted view of market-wide movements, as the performance of the largest companies by market value is not necessarily given the proportional weight one might expect.
Comparing with Market-Cap Weighted Indices
In contrast, market-capitalization-weighted indices, such as the S&P 500 and the Nasdaq Composite, assign weight to each component stock based on its total market value (share price multiplied by the number of outstanding shares). In these indices, companies with larger market caps have a proportionally greater impact on the index’s performance. This method is generally considered by many to be a more accurate reflection of the overall market’s performance, as it gives more weight to the companies that hold a larger slice of the economic pie. The S&P 500, with its 500 diverse companies across various sectors, is often preferred by institutional investors and analysts as a benchmark for the broader U.S. equity market.
Implications for Investors
For individual and institutional investors, understanding the Dow’s calculation and its inherent characteristics is key to interpreting market data and making informed decisions.
A Barometer, Not a Benchmark
The Dow Jones Industrial Average is best viewed as a barometer of market sentiment for a specific segment of the U.S. economy. It can provide a quick, digestible snapshot of how some of the largest blue-chip companies are performing. However, it should not be solely relied upon as a comprehensive benchmark for evaluating portfolio performance or for understanding the overall health of the entire U.S. stock market. For a more robust benchmark, indices like the S&P 500 or even total market indices are generally more appropriate given their broader representation.
Understanding Market Sentiment
Despite its limitations, the Dow’s long history and widespread media coverage make it an influential indicator of investor confidence and economic trends. Significant moves in the DJIA often reflect shifts in market sentiment regarding corporate earnings, economic data, or geopolitical events. Understanding why the Dow moved—whether it was driven by a few high-priced components or broader market forces—requires looking beyond the headline number and delving into its underlying components and calculation methodology.

Diversification Beyond the Dow
For investors building a diversified portfolio, focusing solely on the Dow’s components or using it as the sole gauge of market performance would be a significant oversight. A truly diversified portfolio will typically include exposure to a wider range of market capitalizations, sectors, and geographic regions than those represented by the 30 Dow stocks. While its historical significance and ongoing visibility are undeniable, a sophisticated understanding of financial markets demands an appreciation for the strengths and limitations of all major indices, including the venerable Dow Jones Industrial Average.
aViewFromTheCave is a participant in the Amazon Services LLC Associates Program, an affiliate advertising program designed to provide a means for sites to earn advertising fees by advertising and linking to Amazon.com. Amazon, the Amazon logo, AmazonSupply, and the AmazonSupply logo are trademarks of Amazon.com, Inc. or its affiliates. As an Amazon Associate we earn affiliate commissions from qualifying purchases.