In the ever-evolving landscape of cloud computing and data visualization, setting up robust monitoring and analytics tools is paramount. Grafana has emerged as a leading open-source platform for creating, exploring, and sharing dashboards, offering powerful insights into your data. When leveraging the flexibility and scalability of Amazon Web Services (AWS), specifically Amazon Linux, integrating Grafana becomes a strategic move for many organizations. This comprehensive guide will walk you through the process of installing Grafana on Amazon Linux, ensuring you can harness its full potential for your monitoring needs.
This tutorial is designed for individuals and teams looking to establish a centralized and visually appealing system for tracking metrics from various sources. Whether you’re managing infrastructure, applications, or business performance, Grafana provides the tools to transform raw data into actionable intelligence. By following these steps, you’ll be well on your way to a fully functional Grafana instance running seamlessly on your Amazon Linux environment.

The process involves preparing your system, downloading and installing the Grafana package, configuring it for your specific environment, and finally, accessing and exploring its rich features. We’ll cover essential commands, potential pitfalls, and best practices to ensure a smooth and successful installation.
Preparing Your Amazon Linux Environment
Before diving into the Grafana installation, it’s crucial to ensure your Amazon Linux instance is properly configured and up-to-date. This foundational step minimizes compatibility issues and sets the stage for a stable deployment.
Updating Your System
The first and most critical step is to update your Amazon Linux instance to the latest available packages. This ensures you have the most recent security patches, bug fixes, and software versions, which is essential for a secure and efficient installation.
You can achieve this by executing the following commands in your terminal:
sudo yum update -y
This command will refresh your package lists and upgrade all installed packages to their latest versions. The -y flag automatically confirms any prompts, making the process non-interactive. It’s recommended to run this command periodically to maintain a healthy system.
Installing Necessary Dependencies
While Grafana is relatively lightweight, it often relies on specific system libraries and tools. The primary dependency for Grafana on most Linux distributions is wget or curl for downloading packages, and gnupg for managing GPG keys to verify package integrity.
Ensure these are installed:
sudo yum install -y wget gnupg
wget: A non-interactive network downloader. It’s used here to download the Grafana repository configuration file.gnupg: GNU Privacy Guard, used for encrypting and signing data. In this context, it’s used to import the Grafana GPG key, ensuring that the packages you download are authentic and haven’t been tampered with.
Understanding Amazon Linux Repositories
Amazon Linux is based on Red Hat Enterprise Linux (RHEL) and uses the YUM (Yellowdog Updater, Modified) package manager. This means installation commands will often resemble those used on CentOS or RHEL. When installing software not readily available in the default Amazon Linux repositories, you’ll typically add a third-party repository. For Grafana, we’ll be adding the official Grafana Labs repository.
Installing Grafana on Amazon Linux
With your system prepared, we can now proceed with the actual installation of Grafana. This involves adding the Grafana repository to your YUM configuration and then installing the Grafana package itself.
Adding the Grafana Yum Repository
Grafana provides its own YUM repository, which simplifies the installation and ensures you always get the latest stable version. To add this repository, you need to download a configuration file and import Grafana’s GPG key.
First, import the Grafana GPG key. This key is used to verify the authenticity of the packages downloaded from the Grafana repository.
sudo rpm --import https://packages.grafana.com/gpg.key
Next, create a new repository configuration file for Grafana. This file tells YUM where to find Grafana packages.
sudo tee /etc/yum.repos.d/grafana.repo <<EOF
[grafana]
name=grafana
baseurl=https://packages.grafana.com/oss/rpm
repo_gpgcheck=1
enabled=1
gpgcheck=1
gpgkey=https://packages.grafana.com/gpg.key
sslverify=1
sslcacert=/etc/pki/tls/certs/ca-bundle.crt
EOF
Let’s break down this command:
sudo tee /etc/yum.repos.d/grafana.repo: This command creates a new file namedgrafana.repoin the/etc/yum.repos.d/directory with root privileges (sudo). Theteecommand allows you to read from standard input and write to standard output and also to files. In this case, it writes the content provided after<<EOFinto thegrafana.repofile.[grafana]: This is the repository section header.name=grafana: A human-readable name for the repository.baseurl=https://packages.grafana.com/oss/rpm: The URL where YUM can find the Grafana RPM packages. We are using the Open Source Software (OSS) version.repo_gpgcheck=1: Enables GPG signature checking for repository metadata.enabled=1: Enables the repository.gpgcheck=1: Enables GPG signature checking for packages downloaded from this repository.gpgkey=https://packages.grafana.com/gpg.key: The URL of the GPG key used to sign the packages.sslverify=1: Enables SSL certificate verification for the repository.sslcacert=/etc/pki/tls/certs/ca-bundle.crt: Specifies the path to the CA bundle certificate file used for SSL verification.
Installing the Grafana Package
Once the repository is added, YUM can now locate and install Grafana.
sudo yum install grafana -y
This command will download the Grafana package and its dependencies from the newly added repository and install them on your Amazon Linux system. The -y flag ensures that any prompts during the installation are automatically answered with “yes.”
After the installation completes, Grafana is installed, but it’s not yet running. We need to start the Grafana service and configure it to start automatically on boot.
Configuring and Running Grafana
With Grafana installed, the next steps involve ensuring the service is running, accessible, and configured to your needs. This includes starting the service, enabling it for automatic startup, and understanding how to access its web interface.
Starting and Enabling the Grafana Service
Grafana runs as a systemd service. You need to start the service and enable it to launch automatically when your Amazon Linux instance boots up.
To start the Grafana service, use the following command:
sudo systemctl start grafana-server
To verify that the service is running, you can use:
sudo systemctl status grafana-server
You should see output indicating that the service is active and running.
To ensure Grafana starts automatically every time your server reboots, enable the service:
sudo systemctl enable grafana-server
This command creates a symbolic link that tells systemd to start the grafana-server service during the boot process.
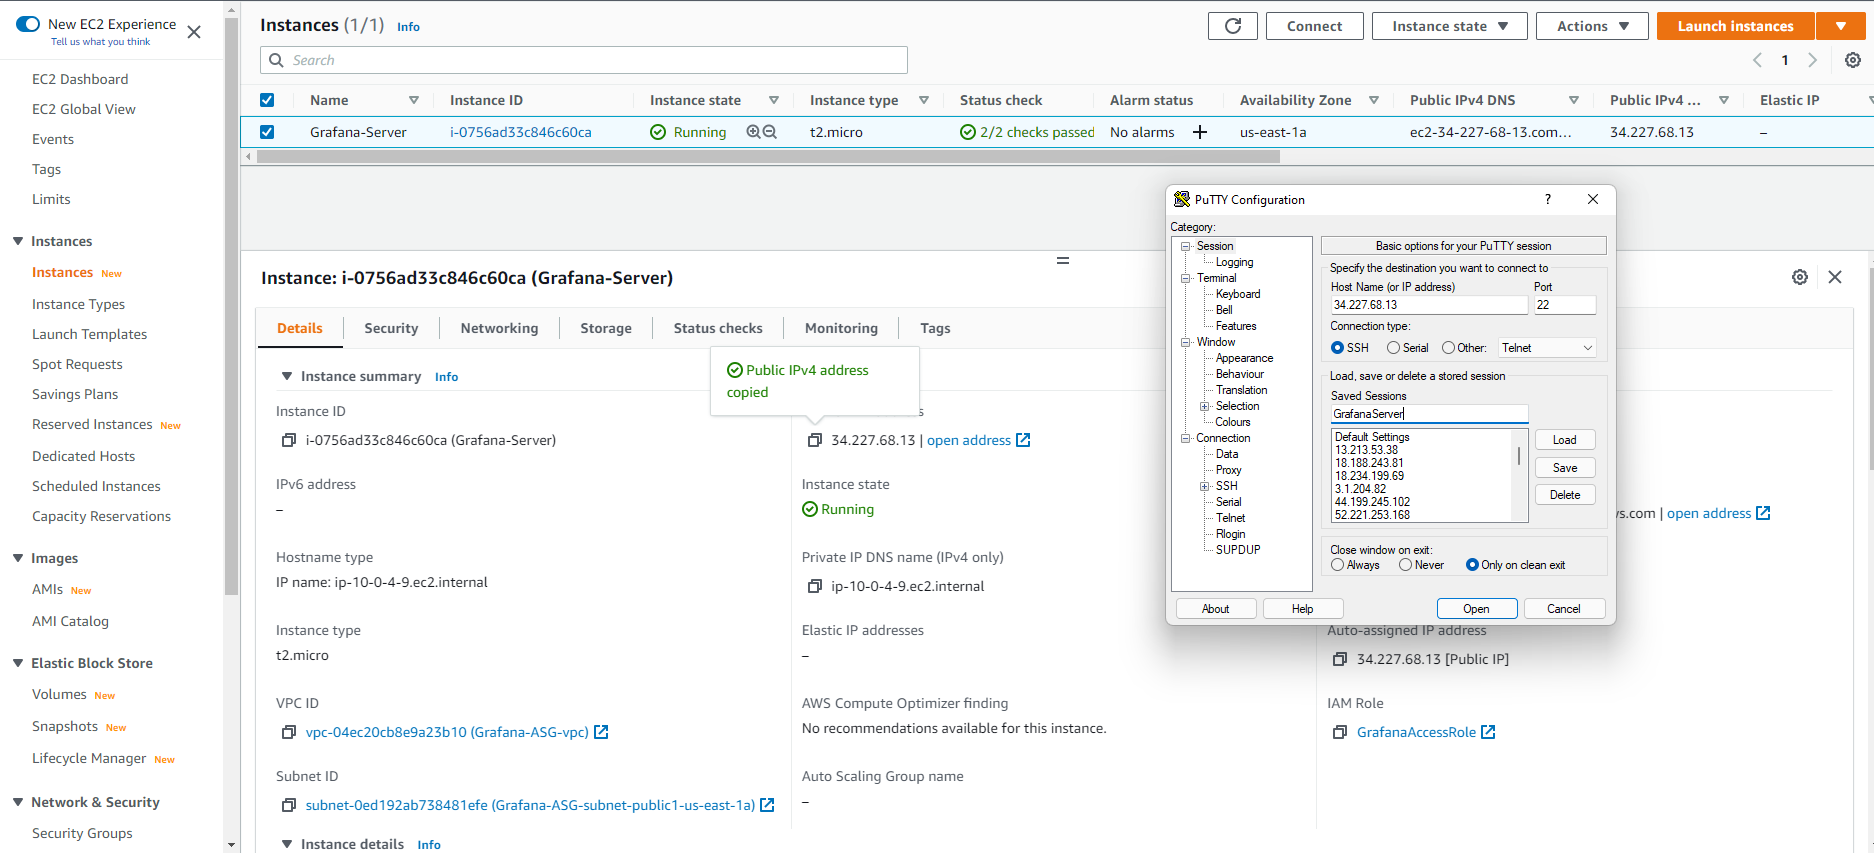
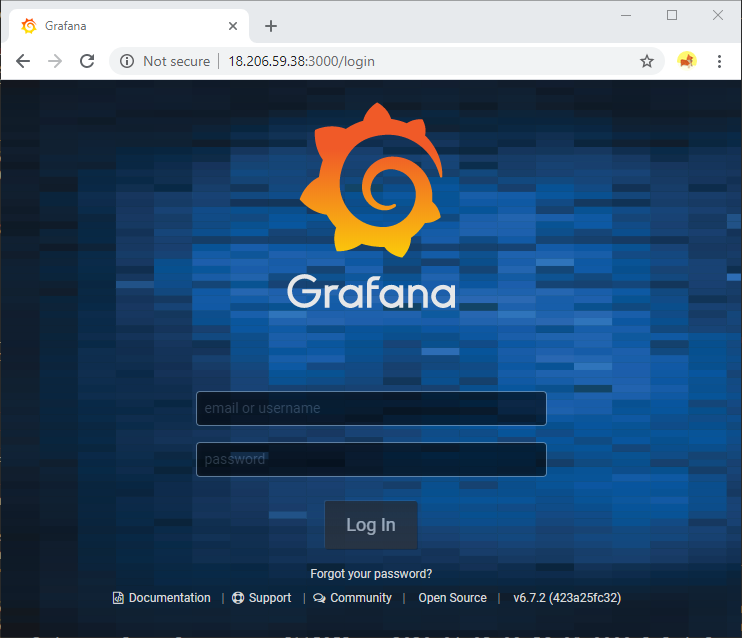
Accessing the Grafana Web Interface
Grafana listens on port 3000 by default. To access the Grafana web interface from your browser, you need to know your Amazon Linux instance’s public IP address or DNS name.
The default URL will be:
http://<your_instance_public_ip_or_dns>:3000
Replace <your_instance_public_ip_or_dns> with the actual public IP address or DNS name of your Amazon EC2 instance.
Important Security Note: If your Amazon Linux instance is within a Virtual Private Cloud (VPC) and you are accessing it from outside the VPC, you will need to configure your AWS Security Group to allow inbound traffic on port 3000 from your IP address or a trusted network. Without this, you won’t be able to connect to the Grafana web interface.
When you access Grafana for the first time, you will be prompted to log in. The default credentials are:
- Username:
admin - Password:
admin
You will be immediately prompted to change this default password for security reasons. It’s highly recommended to set a strong, unique password.
Basic Grafana Configuration
While Grafana is functional out-of-the-box, there are some common configuration options you might want to adjust. The main configuration file for Grafana is located at /etc/grafana/grafana.ini.
Before making any changes, it’s good practice to back up the original configuration file:
sudo cp /etc/grafana/grafana.ini /etc/grafana/grafana.ini.bak
You can then edit the file using your preferred text editor, such as nano or vim:
sudo nano /etc/grafana/grafana.ini
Within grafana.ini, you can find various sections to customize Grafana’s behavior. Some common settings include:
-
[server]section:http_port: Change the HTTP port Grafana listens on (default is 3000).domain: Set a domain name for Grafana if you are using one.root_url: The full URL used to access Grafana (e.g.,http://yourdomain.com).
-
[database]section:- By default, Grafana uses an SQLite database (
/var/lib/grafana/grafana.db). For production environments, it’s often recommended to configure an external database like PostgreSQL or MySQL for better performance and scalability.
- By default, Grafana uses an SQLite database (
-
[auth]section:- Configure various authentication methods, including LDAP, OAuth, and SAML.
After making any changes to grafana.ini, you must restart the Grafana server for the changes to take effect:
sudo systemctl restart grafana-server
Remember to adjust your AWS Security Group accordingly if you change the http_port.
Next Steps: Integrating Data Sources and Creating Dashboards
With Grafana successfully installed and running on your Amazon Linux instance, the true power of the platform can be unleashed by connecting it to your data sources and visualizing the information.
Connecting to Data Sources
Grafana is designed to be a versatile visualization tool, supporting a wide array of data sources. This includes time-series databases, relational databases, cloud monitoring services, and more. Some of the most common data sources include:
- Prometheus: An open-source systems monitoring and alerting toolkit.
- InfluxDB: A popular open-source time-series database.
- CloudWatch: AWS’s own monitoring and observability service, ideal for monitoring your AWS resources.
- Elasticsearch: A distributed search and analytics engine.
- SQL Databases: Such as PostgreSQL, MySQL, and SQL Server.
To connect a data source:
- Log in to your Grafana instance.
- Navigate to Configuration (gear icon on the left sidebar) -> Data sources.
- Click Add data source.
- Select your desired data source from the list.
- Fill in the connection details, such as URL, credentials, and database name, specific to your chosen data source.
- Click Save & test to ensure Grafana can connect successfully.
For AWS users, integrating Amazon CloudWatch as a data source is often a primary goal. Grafana provides a CloudWatch plugin that allows you to pull metrics directly from your AWS services (EC2, S3, Lambda, RDS, etc.) into Grafana dashboards. You will need to configure AWS credentials (either through IAM roles for EC2 instances or access keys) for Grafana to access CloudWatch.
Creating Dashboards and Visualizations
Once your data sources are connected, you can start building dashboards to visualize your metrics. Dashboards are collections of panels, where each panel displays a specific graph, table, or other visualization of your data.
To create a dashboard:
- Navigate to Create (plus icon on the left sidebar) -> Dashboard.
- Click Add new panel.
- Select your connected Data source from the dropdown menu.
- Write a query to fetch the data you want to visualize. The query language will depend on your chosen data source (e.g., PromQL for Prometheus, SQL for databases, or specific CloudWatch query syntax).
- Choose a visualization type (e.g., Graph, Stat, Gauge, Table).
- Configure the panel’s title, description, and appearance.
- Click Apply to add the panel to your dashboard.
- Arrange and resize panels as needed.
- Click the save icon at the top to save your dashboard.
Grafana offers a rich set of visualization options and customization capabilities, allowing you to tailor your dashboards to precisely display the information that matters most to your operations, business intelligence, or technical monitoring.
Conclusion
Installing Grafana on Amazon Linux provides a powerful and flexible platform for data visualization and monitoring within the AWS ecosystem. By following the steps outlined in this guide – from preparing your Amazon Linux environment and adding the Grafana repository to installing, configuring, and starting the Grafana service – you establish a solid foundation.
The ability to connect Grafana to a multitude of data sources, including native AWS services like CloudWatch, empowers you to gain deep insights into your infrastructure, applications, and business metrics. The intuitive dashboard creation process allows you to transform complex data into easily understandable visual representations, facilitating better decision-making and proactive issue resolution.
As you become more familiar with Grafana, explore its advanced features such as alerting, user management, and template variables. Continuously update your Grafana instance and its dependencies to benefit from the latest improvements and security patches. With Grafana running on your Amazon Linux instance, you are well-equipped to monitor, analyze, and understand your data like never before.
aViewFromTheCave is a participant in the Amazon Services LLC Associates Program, an affiliate advertising program designed to provide a means for sites to earn advertising fees by advertising and linking to Amazon.com. Amazon, the Amazon logo, AmazonSupply, and the AmazonSupply logo are trademarks of Amazon.com, Inc. or its affiliates. As an Amazon Associate we earn affiliate commissions from qualifying purchases.