
In the dynamic world of finance, understanding growth, decline, and relative performance is paramount. Whether you’re tracking your investments, analyzing business profits, managing a personal budget, or simply trying to comprehend economic news, the concept of percentage change is a fundamental building block. It transcends raw numbers, offering a standardized, digestible metric that reveals the true magnitude of a shift between two values over time. For anyone navigating the complexities of personal finance, investing, or business operations, mastering how to calculate and interpret percentage change isn’t just a useful skill—it’s an essential tool for informed decision-making and strategic planning.
Imagine hearing that a company’s stock price increased by $5. On its own, this figure tells you little. Was it a $5 jump from $10, signifying a massive 50% gain, or a $5 increase from $1,000, representing a modest 0.5% uptick? The percentage change clarifies the true impact, providing context that absolute values simply cannot. It allows for apples-to-apples comparisons across different scales and timeframes, making it invaluable for anyone serious about managing their money effectively. This article will demystify percentage change, guiding you through its calculation, practical applications, and the insights it unlocks across various financial scenarios.
The Fundamental Formula for Financial Clarity
At its core, percentage change is a simple mathematical concept, yet its implications in finance are profound. It provides a relative measure of change, indicating how much a quantity has increased or decreased relative to its initial value. This relativity is precisely what makes it so powerful for financial analysis, allowing us to gauge performance, assess risk, and project future outcomes more accurately.
Deconstructing the Percentage Change Formula
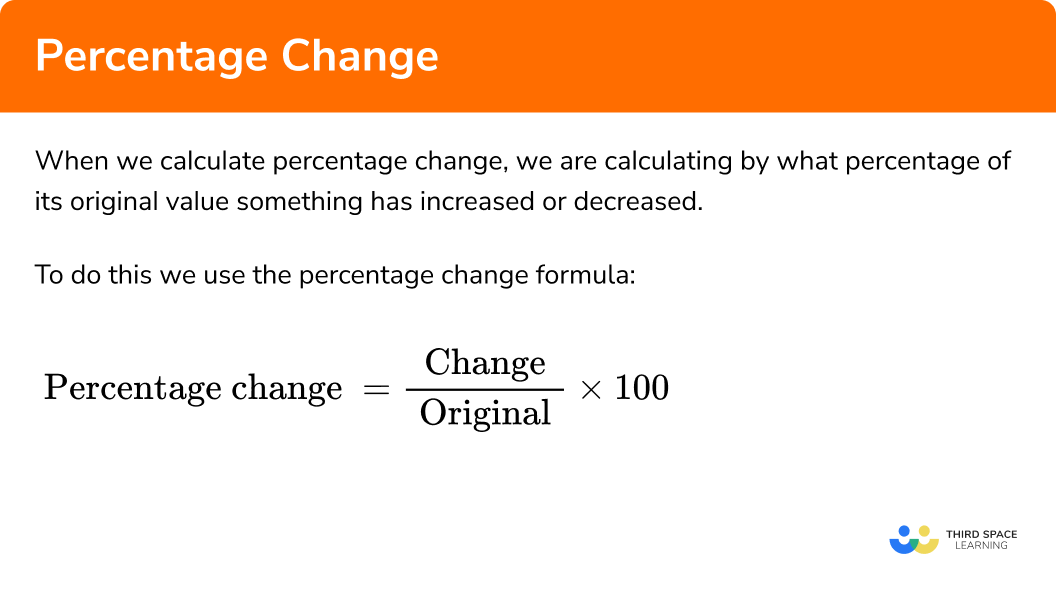
The basic formula for calculating percentage change is straightforward and universally applicable:
Percentage Change = [(New Value – Old Value) / Old Value] × 100
Let’s break down each component, emphasizing its financial significance:
- New Value: This is the current or subsequent value you are analyzing. In finance, this could be your current stock portfolio balance, the latest quarterly sales figure, the updated value of a property, or your current monthly expenses.
- Old Value (or Original Value / Base Value): This is the initial or previous value from which the change is being measured. Critically, this is the baseline against which the “New Value” is compared. Financially, this might be the initial investment amount, last year’s sales, the property’s purchase price, or your expenses from the previous month. The integrity of your calculation hinges on selecting the correct Old Value, as it serves as the reference point for the entire change.
- [(New Value – Old Value)]: This part of the formula calculates the absolute difference between the two values. This “change” can be positive (an increase) or negative (a decrease). For instance, if your stock went from $50 to $55, the absolute change is +$5. If it dropped from $50 to $45, the change is -$5.
- [/ Old Value]: Dividing the absolute change by the Old Value is what converts the absolute change into a relative change, or a decimal. This step normalizes the change, expressing it as a proportion of the original amount. This is the crucial step that allows for meaningful comparisons regardless of the scale of the numbers involved.
- [× 100]: Multiplying by 100 converts the decimal result into a percentage, making it easier to read and understand. A decimal of 0.15, for example, becomes 15%, indicating a 15% increase. A decimal of -0.05 becomes -5%, indicating a 5% decrease.
Interpreting the Results: Positive vs. Negative Changes
Once you’ve applied the formula, the sign of your result immediately tells you the nature of the change:
- Positive Percentage Change: A positive result signifies an increase or growth.
- Financial Context: This is what investors seek in portfolio returns, businesses aim for in revenue growth, and individuals desire in their savings balances. A stock increasing from $100 to $110 shows a +10% change, indicating growth.
- Negative Percentage Change: A negative result signifies a decrease or decline (often referred to as a “loss” or “drop”).
- Financial Context: This could represent a market downturn, a reduction in quarterly profits, or an increase in debt. If a cryptocurrency investment drops from $1,000 to $800, that’s a -20% change, reflecting a loss.
Understanding these interpretations is as vital as the calculation itself. A -50% change is devastating for an investment, while a +2% change might be solid for a bond. The percentage context is everything.
Practical Applications in Personal Finance and Investing
The utility of percentage change truly shines when applied to personal financial management and investment analysis. It transforms raw data into actionable insights, helping individuals make smarter decisions about their money.
Tracking Investment Performance
One of the most common and crucial applications of percentage change is in evaluating investments.
- Stock Price Changes: Suppose you bought shares of XYZ Corp at $75 per share, and today they trade at $90 per share.
- Percentage Change = [($90 – $75) / $75] × 100 = ($15 / $75) × 100 = 0.20 × 100 = +20%. This tells you your investment has appreciated by 20%.
- Portfolio Growth: If your investment portfolio was valued at $50,000 at the start of the year and is now worth $57,500.
- Percentage Change = [($57,500 – $50,000) / $50,000] × 100 = ($7,500 / $50,000) × 100 = 0.15 × 100 = +15%. This 15% return allows you to compare its performance against benchmarks or other investment vehicles.
- Mutual Fund/ETF Performance: Fund managers frequently report annual or quarterly percentage returns, enabling investors to quickly assess performance without needing to know the fund’s exact asset value.
Analyzing Budget Fluctuations and Savings Growth
For effective personal finance, percentage change helps monitor your spending habits and savings progress.
- Change in Monthly Expenses: If your electricity bill was $120 last month and $150 this month.
- Percentage Change = [($150 – $120) / $120] × 100 = ($30 / $120) × 100 = 0.25 × 100 = +25%. A 25% increase warrants investigation to understand the cause and adjust your budget if necessary.
- Savings Account Growth: You deposited $5,000 into a savings account, and after a year, it grew to $5,125 due to interest.
- Percentage Change = [($5,125 – $5,000) / $5,000] × 100 = ($125 / $5,000) × 100 = 0.025 × 100 = +2.5%. This is your annual percentage yield (APY) for that period.
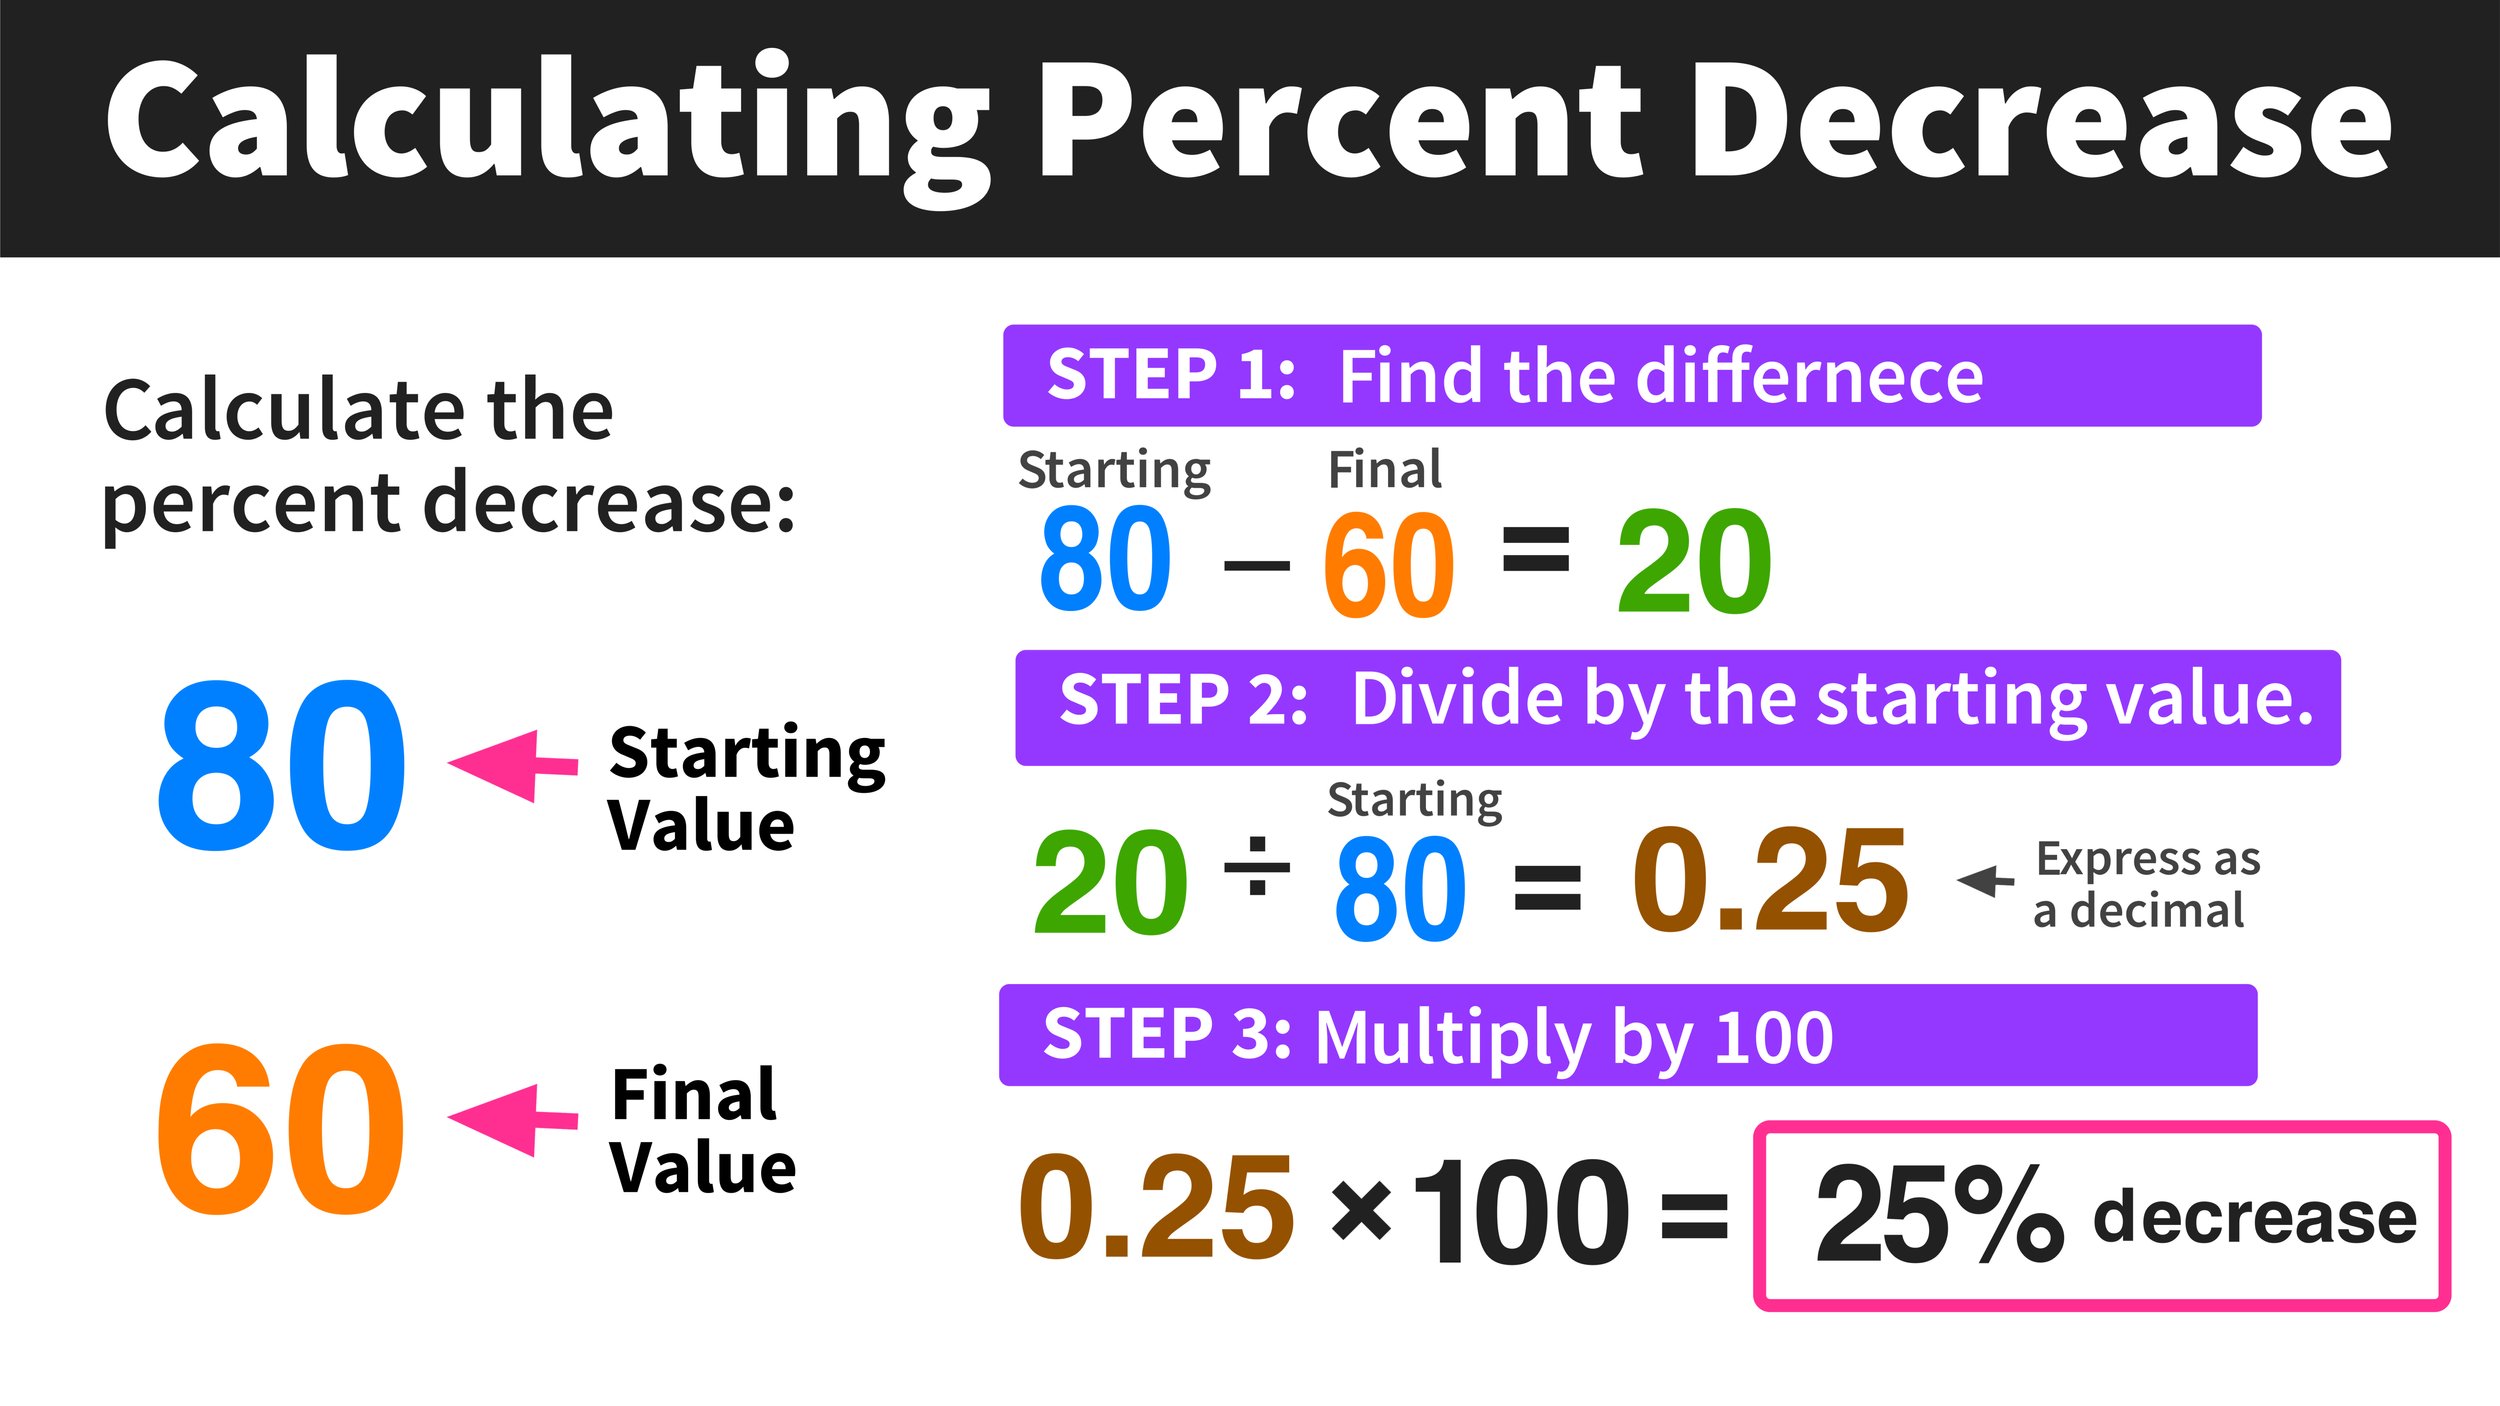
- Debt Reduction: If you reduced your credit card debt from $3,000 to $2,400.
- Percentage Change = [($2,400 – $3,000) / $3,000] × 100 = (-$600 / $3,000) × 100 = -0.20 × 100 = -20%. A 20% reduction is a clear indicator of progress in debt management.
Understanding Loan and Debt Changes
Percentage change is vital for understanding the true cost and evolution of debt.
- Loan Balance Fluctuation: Monitoring how your principal loan balance changes over time due to payments (reduction) or interest accrual (increase, if not paying enough) can be expressed as a percentage.
- Interest Rate Changes: When a central bank adjusts interest rates, the percentage change in that rate can significantly impact variable-rate loans or savings returns. While it might seem like a simple change from 3% to 4%, that’s a one percentage point change, but an actual percentage change of (4-3)/3 * 100 = 33.33%, which is substantial.
Percentage Change in Business Finance and Entrepreneurship
For business owners, entrepreneurs, and financial professionals, percentage change is an indispensable metric for assessing operational health, strategic performance, and growth trajectories. It underpins virtually every financial report and performance review.
Evaluating Sales and Revenue Growth
A business’s lifeblood is its revenue, and percentage change provides a clear picture of its growth or contraction.
- Year-over-Year Sales Increase: A small business sold $250,000 worth of products last year and $325,000 this year.
- Percentage Change = [($325,000 – $250,000) / $250,000] × 100 = ($75,000 / $250,000) × 100 = 0.30 × 100 = +30%. This 30% growth is a strong indicator of business success.
- Monthly Subscription Revenue: An online service grew its monthly recurring revenue (MRR) from $10,000 to $11,500.
- Percentage Change = [($11,500 – $10,000) / $10,000] × 100 = ($1,500 / $10,000) × 100 = 0.15 × 100 = +15%. This metric is crucial for projecting future revenue and assessing marketing effectiveness.
Monitoring Profit Margins and Cost Reductions
Understanding profitability and managing expenses are critical for any sustainable business.
- Gross Profit Margin Change: If a product’s gross profit margin (revenue minus cost of goods sold, divided by revenue) increased from 40% to 44%. While a 4 percentage point increase, the percentage change in the margin itself would be [($0.44 – $0.40) / $0.40] × 100 = ($0.04 / $0.40) × 100 = +10%. This shows a 10% improvement in the margin efficiency.
- Tracking Cost-Saving Initiatives: A company aimed to reduce its operating expenses. Last quarter, expenses were $80,000; this quarter, they are $72,000.
- Percentage Change = [($72,000 – $80,000) / $80,000] × 100 = (-$8,000 / $80,000) × 100 = -0.10 × 100 = -10%. A 10% reduction in costs directly impacts profitability.
Assessing Key Performance Indicators (KPIs)
Percentage change is integral to tracking almost any business KPI, providing context to performance improvements or declines.
- Customer Acquisition Cost (CAC) Change: If the average cost to acquire a new customer dropped from $50 to $40.
- Percentage Change = [($40 – $50) / $50] × 100 = (-$10 / $50) × 100 = -0.20 × 100 = -20%. A 20% reduction in CAC is a significant win for marketing efficiency.
- Conversion Rate Improvement: An e-commerce site improved its website conversion rate from 2% to 2.5%.
- Percentage Change = [($0.025 – $0.02) / $0.02] × 100 = ($0.005 / $0.02) × 100 = 0.25 × 100 = +25%. This is a 25% increase in the effectiveness of the website, leading to more sales.
Common Pitfalls and Advanced Considerations
While the percentage change formula is straightforward, misapplication or misinterpretation can lead to flawed financial conclusions. Awareness of these nuances is critical for robust analysis.
The Importance of the ‘Base Value’
The “Old Value” (or base value) in the denominator is paramount. An incorrect base can dramatically skew your percentage change.
- Small Base Exaggeration: When the base value is very small, even a minor absolute change can result in a disproportionately large percentage change. For example, if an investment goes from $1 to $2, that’s a +100% increase. If it goes from $10,000 to $10,001, that’s a negligible +0.01% increase, even though the absolute change is the same ($1). Financial analysts must be wary of highlighting massive percentage gains or losses from a tiny base, as they can sometimes be misleading about the actual monetary impact.
- Consistent Base: When comparing multiple percentage changes, ensure they all share a consistent and relevant base period or value to avoid comparing apples to oranges. For instance, always compare year-over-year sales against the previous year’s sales, not an arbitrary period.
Distinguishing Between Percentage Change and Percentage Point Change
This is a common source of confusion, especially in financial reporting and economic discussions.
- Percentage Point Change: Refers to the absolute difference between two percentages. For example, if an interest rate increases from 3% to 4%, that’s a 1 percentage point increase.
- Percentage Change: Refers to the relative change of the percentage value itself. Using the interest rate example:
- Percentage Change = [(4% – 3%) / 3%] × 100 = (1% / 3%) × 100 = +33.33%.
This distinction is crucial when discussing interest rates, market share, unemployment rates, or any metric already expressed as a percentage. Saying a company’s market share increased by 5 percentage points (e.g., from 10% to 15%) is very different from saying it increased by 5% (e.g., from 10% to 10.5%). The former represents a more significant shift.
- Percentage Change = [(4% – 3%) / 3%] × 100 = (1% / 3%) × 100 = +33.33%.
Leveraging Financial Tools for Calculation Accuracy
While mental math or a basic calculator suffices for simple percentage changes, more complex financial analysis often benefits from dedicated tools.
- Spreadsheets (Excel, Google Sheets): These are invaluable for calculating percentage changes across large datasets, automating calculations, and visualizing trends. Functions like
=(B2-A2)/A2can be easily applied to columns of financial data. - Financial Calculators and Software: Many advanced financial calculators and investment platforms have built-in functions for calculating percentage changes, compound annual growth rates (CAGR), and other related metrics, streamlining analysis for investors and business owners.

Conclusion
The ability to accurately work out percentage change is more than just a mathematical exercise; it’s a cornerstone of financial literacy and a critical skill for making informed decisions across all facets of the money landscape. From personal budgeting and investment portfolio management to corporate financial reporting and entrepreneurial ventures, percentage change provides the necessary context to truly understand growth, decline, and performance.
By mastering the simple yet powerful formula and understanding its applications in tracking investment returns, analyzing business profitability, and monitoring personal financial health, you equip yourself with an invaluable analytical tool. Remember to pay close attention to the base value and distinguish between percentage change and percentage point change to avoid common pitfalls. In a world increasingly driven by data, the savvy individual or business professional who can effectively calculate and interpret percentage change holds a significant advantage, translating raw numbers into meaningful insights that drive financial success. Embrace this fundamental concept, and you’ll find yourself navigating the complexities of finance with greater clarity, confidence, and control.
aViewFromTheCave is a participant in the Amazon Services LLC Associates Program, an affiliate advertising program designed to provide a means for sites to earn advertising fees by advertising and linking to Amazon.com. Amazon, the Amazon logo, AmazonSupply, and the AmazonSupply logo are trademarks of Amazon.com, Inc. or its affiliates. As an Amazon Associate we earn affiliate commissions from qualifying purchases.