
A graphing calculator is an indispensable tool for students and professionals across various STEM fields, offering capabilities far beyond basic arithmetic. Mastering its functions can significantly enhance problem-solving, visualization, and understanding of complex mathematical concepts. This guide delves into the essential operations and advanced features to help users harness the full potential of their graphing calculator.
Getting Started: Navigating Your Device
Before diving into complex calculations, it’s crucial to understand the fundamental mechanics of your graphing calculator. Familiarity with the basic interface and navigation will lay the groundwork for efficient usage.
Powering On and Basic Interface
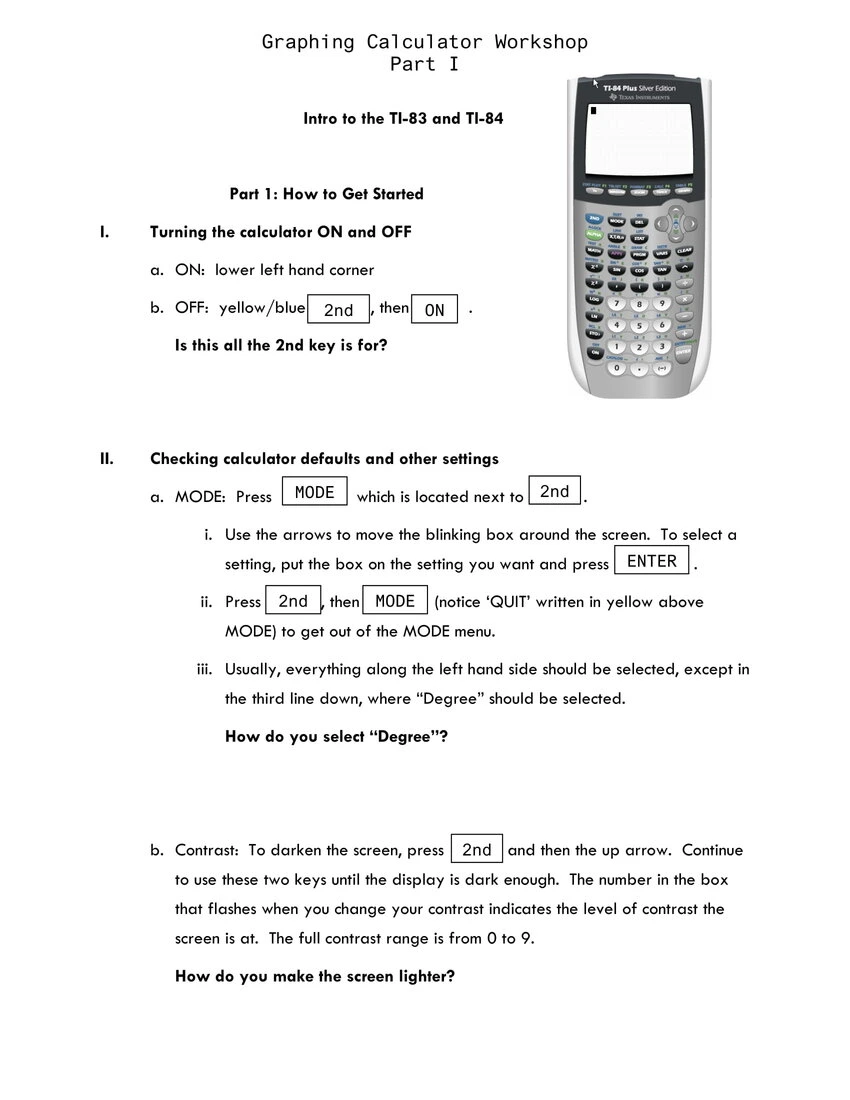
Most graphing calculators operate similarly, featuring a clear LCD screen, a keypad, and a series of dedicated function buttons. To power on the device, locate the “ON” button, typically situated in the bottom left corner of the keypad. Upon activation, you’ll usually be presented with the home screen, which functions as your primary workspace for direct computations. The cursor indicates where your input will appear, and the screen often displays previous calculations or results. To conserve battery, an “OFF” function, usually accessed by pressing “2nd” then “ON,” will power down the device. Understanding this basic ON/OFF mechanism and the layout of the home screen is the first step towards effective use.

Understanding the Keypad Layout
The keypad of a graphing calculator is organized into distinct zones, each serving a specific purpose.
- Numeric Keypad: Located at the bottom, this section contains standard numbers (0-9), decimal point, and basic arithmetic operators (+, -, *, /).
- Function Keys: Above the numeric keypad, you’ll find keys for advanced mathematical functions such as square root (√), exponents (^), logarithms (log, ln), and trigonometric functions (sin, cos, tan). These often require pressing a “2nd” or “ALPHA” key first to access their secondary or tertiary functions printed above the primary key.
- Graphing and Window Keys: Typically found in the top row (Y=, WINDOW, ZOOM, TRACE, GRAPH), these buttons are dedicated to plotting and analyzing functions.
- Navigation Keys: A directional pad (up, down, left, right arrows) allows you to move the cursor around the screen, navigate menus, and edit expressions.
- Mode and Menu Keys: Buttons like “MODE,” “DEL,” “CLEAR,” and “ENTER” control calculator settings, delete entries, clear the screen, and confirm commands, respectively.
- Variable Key (X,T,θ,n): This crucial key automatically inserts the appropriate variable depending on the calculator’s current mode (e.g., ‘X’ for function graphing, ‘T’ for parametric, ‘θ’ for polar, ‘n’ for sequence mode).
Familiarizing yourself with these zones and the multiple functions assigned to each key through the “2nd” and “ALPHA” modifiers is fundamental.
Menu Navigation and Mode Settings
Graphing calculators feature a hierarchical menu system that controls various settings and provides access to specialized functions. The “MODE” button is your gateway to configuring how the calculator operates. Pressing “MODE” reveals a screen with several settings, including:
- Angle Units: Switch between DEGREE and RADIAN mode for trigonometric calculations. This is a common source of error if not set correctly.
- Function Type: Select between FUNC (y=f(x)), PARAM (parametric equations), POL (polar equations), or SEQ (sequences).
- Display Format: Choose between NORMAL, SCI (scientific notation), or ENG (engineering notation) for results, and specify the number of decimal places.
- Graphing Style: Adjust settings related to how graphs are drawn (e.g., connected vs. dot mode).
Navigating these menus typically involves using the arrow keys to highlight an option and pressing “ENTER” to select it. Other menu buttons, such as “MATH,” “PRGM,” or “STAT,” open separate menus containing further specialized tools. Regular checks of your mode settings are essential to ensure the calculator is performing operations as expected.
Mastering Graphing Functions
The ability to graph equations is the defining feature of these calculators, offering powerful visual insights into mathematical relationships.
Inputting Equations (Y= Editor)
To graph a function, you must first input its equation into the calculator’s Y= editor. Press the “Y=” button to access this screen. Here, you’ll see a list of equations, typically from Y1 to Y0 (or Y9). Select an empty slot, say Y1, and type your equation using the variable key (X,T,θ,n) for the independent variable. For example, to graph y = 2x + 3, you would enter 2X + 3. Ensure that parentheses are used correctly for complex expressions, especially in denominators or exponents, to maintain the order of operations. You can activate or deactivate equations by highlighting the equals sign and pressing “ENTER.” A highlighted equals sign means the equation will be graphed.
Setting the Viewing Window (WINDOW)
Before pressing “GRAPH,” it’s crucial to set the viewing window to ensure your function is displayed meaningfully. The “WINDOW” button allows you to define the range and scale of the x and y axes. Key settings include:
- Xmin, Xmax: The minimum and maximum values for the x-axis.
- Xscl: The distance between tick marks on the x-axis.
- Ymin, Ymax: The minimum and maximum values for the y-axis.
- Yscl: The distance between tick marks on the y-axis.
- Xres: Controls the pixel resolution for graphing (1 is highest, 8 is lowest; higher values graph faster but with less detail).
Carefully adjusting these parameters helps focus on relevant parts of the graph, such as intercepts, vertices, or points of intersection. If you’re unsure about the appropriate window, the “ZOOM” menu offers several automatic settings.
Exploring Graphs (GRAPH, TRACE, ZOOM)
Once equations are entered and the window is set, press “GRAPH” to display the plot. The calculator will draw the functions according to your specifications.
- GRAPH: Displays the graph of the entered functions.
- TRACE: Allows you to move a cursor along the graphed function, displaying the x and y coordinates at each point. Use the left and right arrow keys to move along the curve, and the up/down arrows to switch between multiple graphed functions.
- ZOOM: This powerful menu provides various options for adjusting the view:
- ZoomIn / ZoomOut: Manually zoom in or out around the cursor’s position.
- ZoomBox: Draw a box around a specific area to zoom into it.
- ZoomFit: Attempts to adjust the y-axis to fit all parts of the graph within the x-axis range.
- ZoomStandard (ZStandard): Sets the window to a default view (Xmin=-10, Xmax=10, Ymin=-10, Ymax=10).
- ZoomStat (ZStat): Automatically adjusts the window to fit statistical plots.
Effective use of the ZOOM functions is critical for accurately analyzing graphs and identifying key features.
Analyzing Key Features (ZERO, INTERSECT, MAXIMUM/MINIMUM)
Graphing calculators offer powerful tools to analyze specific points on a graph without manual estimation. These functions are typically found under the “CALC” menu, accessed by pressing “2nd” then “TRACE.”
- ZERO (or ROOT): Used to find the x-intercepts of a function (where y=0). You will be prompted to select a “Left Bound,” “Right Bound,” and “Guess” to guide the calculator to the desired zero.
- INTERSECT: Finds the point(s) where two or more functions cross each other. After selecting “INTERSECT,” you’ll choose the “First curve,” “Second curve,” and provide a “Guess” near the intersection point.
- MINIMUM / MAXIMUM: Locates the lowest or highest point of a function within a specified interval. Similar to “ZERO,” you’ll define a “Left Bound,” “Right Bound,” and a “Guess” to pinpoint the extremum.
- VALUE: Evaluates the function at a specific x-value that you input.
These analytical tools are indispensable for solving equations, finding optimal points, and understanding the behavior of functions.
Advanced Computational Capabilities
Beyond basic graphing, these calculators are equipped with robust capabilities for advanced mathematical operations, making them versatile tools for higher-level courses and professional applications.
Performing Calculus Operations
Graphing calculators can perform both differential and integral calculus, albeit numerically.
- Numerical Derivative (nDeriv): Found under the “MATH” menu, this function approximates the derivative of a function at a specific point. For example,
nDeriv(Y1, X, 2)would calculate the derivative of the function in Y1 at X=2. - Numerical Integral (fnInt): Also in the “MATH” menu,
fnIntapproximates the definite integral of a function over a given interval. The syntax is typicallyfnInt(Y1, X, lower_limit, upper_limit). These numerical methods are incredibly useful for visualizing and understanding calculus concepts even when analytical solutions are complex or impossible.
Working with Matrices and Vectors
Many graphing calculators include a dedicated “MATRIX” menu (often accessed via “2nd” then a specific key like x^-1). Here, you can define, edit, and perform operations on matrices.
- Defining Matrices: Enter the dimensions (rows x columns) and then input the individual elements.
- Matrix Operations: Perform addition, subtraction, multiplication, find the determinant, transpose, inverse, and solve systems of linear equations using matrix methods.
For vectors, these operations can often be performed by treating vectors as single-column or single-row matrices. This functionality is invaluable for linear algebra, physics, and engineering problems.
Statistical Data Entry and Analysis
Graphing calculators excel at statistical analysis. The “STAT” button is the primary access point for these features.
- Edit Lists: Under the “STAT” menu, select “Edit” to access lists (L1, L2, etc.) where you can input datasets. Each list can hold a different variable or set of observations.
- One-Variable Statistics: After entering data into a list, select “CALC” from the “STAT” menu and choose “1-Var Stats.” This will compute key statistics like mean (x̄), standard deviation (Sx, σx), sum (Σx), sum of squares (Σx²), median (Med), quartiles (Q1, Q3), and number of data points (n).
- Regression Analysis: For analyzing relationships between two variables, input data into two lists (e.g., L1 for independent, L2 for dependent). Then, under “STAT” -> “CALC,” select an appropriate regression model (e.g., LinReg(ax+b) for linear, QuadReg for quadratic, ExpReg for exponential). The calculator will compute the coefficients of the regression equation and the correlation coefficient (r).
- Statistical Plots (StatPlot): Press “2nd” then “Y=” (STAT PLOT) to set up various graphical representations of your data, such as scatter plots, box-and-whisker plots, histograms, and normal probability plots. This visual analysis complements the numerical statistics.
Programming and Customization
For users who need to automate repetitive tasks or implement custom algorithms, graphing calculators offer basic programming capabilities.
Writing Simple Programs
The “PRGM” button grants access to the programming environment. You can create, edit, and execute programs written in the calculator’s native language. These programs consist of a series of commands, similar to those you’d input directly on the home screen, but executed sequentially. Common programming constructs include input/output commands, conditional statements (If-Then-Else), loops (For, While), and variable assignments. While not as powerful as modern programming languages, this feature is incredibly useful for:
- Automating complex formulas: Create a program to quickly solve quadratic equations or calculate specific physics quantities.
- Interactive tools: Design programs that prompt for input and provide formatted output for specific tasks.
- Educational simulations: Run simple simulations for probability or other mathematical concepts.
Learning to write even basic programs can significantly enhance efficiency for specialized tasks.
Utilizing Built-in Applications
Many modern graphing calculators come pre-loaded with or support the installation of “Apps” (Applications). These are more sophisticated, often graphically rich, programs designed to expand the calculator’s functionality. Common apps include:
- Polynomial Root Finder: Solves polynomial equations of higher degrees.
- Simultaneous Equation Solver: Solves systems of linear equations.
- Finance App: Provides tools for time value of money, amortization, and other financial calculations.
- Conic Graphing: Simplifies the graphing and analysis of conic sections.
- Inequality Graphing: Allows direct input and graphing of inequalities.
Access these apps via the “APPS” button. Exploring and utilizing these applications can save considerable time and effort compared to performing these calculations manually.
Connecting to Other Devices and Software
Graphing calculators often feature a port for connectivity, typically a mini-USB port or a 2.5mm I/O port. This allows for:
- Data Transfer: Connecting to a computer via a USB cable and accompanying software (e.g., TI-Connect, Casio fx-CG Manager) to transfer programs, lists, matrices, and screenshots. This is particularly useful for backing up data or sharing resources.
- Device-to-Device Transfer: Using a unit-to-unit link cable to transfer data directly between two calculators, ideal for sharing programs or datasets with classmates.
- Firmware Updates: Connecting to a computer is often necessary to update the calculator’s operating system (firmware), which can fix bugs, improve performance, or add new features.
Leveraging these connectivity options extends the calculator’s utility, integrating it more seamlessly into a digital workflow.
Tips for Efficiency and Problem-Solving
Optimizing your use of a graphing calculator involves more than just knowing the functions; it’s also about smart practices and troubleshooting.
Common Error Messages and Troubleshooting
Encountering error messages is a common part of using a graphing calculator. Understanding the common ones can help you quickly resolve issues:
- SYNTAX ERROR: Indicates an incorrect entry format (e.g., missing parentheses, incorrect function arguments). Review your input carefully.
- DOMAIN ERROR: Occurs when an operation is attempted on a value outside its defined domain (e.g., square root of a negative number, logarithm of zero or a negative number). Check your input values and function definition.
- DIVIDE BY 0 ERROR: Self-explanatory; you’ve attempted to divide by zero. Review expressions involving division.
- OVERFLOW ERROR: The result of a calculation is too large for the calculator to represent.
- GO TO: Many errors provide an option to “Go To” the location of the error in your expression or program, which is incredibly helpful for debugging.
- Memory Management: If the calculator slows down or crashes, you might be low on memory, especially if you have many large lists, matrices, or programs. Consider deleting unnecessary items.
When an error occurs, the first step is always to re-examine the last input or the specific line of code highlighted by the calculator.
Optimizing Battery Life and Maintenance
To ensure your graphing calculator is always ready for use:
- Power Off: Always turn off the calculator when not in use. Some models have an auto-off feature, but manually turning it off is more reliable.
- Battery Type: Most calculators use AAA batteries for power and a small lithium battery for memory backup. Replace both when needed. A low backup battery can lead to memory loss.
- Screen Brightness: If your model has adjustable contrast or brightness, keep it at a reasonable level. Higher brightness consumes more power.
- Storage: Store the calculator in its protective case to prevent physical damage and accidental button presses that can drain the battery. Avoid extreme temperatures.
- Cleaning: Use a soft, dry cloth to clean the screen and keypad. Avoid liquid cleaners.
Proper maintenance prolongs the life of your device and ensures consistent performance.

Leveraging Online Resources and Communities
The vast community of graphing calculator users provides a wealth of online resources:
- Manufacturer Websites: Check the official websites (e.g., Texas Instruments, Casio) for manuals, tutorial videos, software updates, and educational materials.
- Forums and Blogs: Many online forums and blogs are dedicated to graphing calculator use, offering tips, tricks, and solutions to common problems. These can be excellent places to ask questions and learn from experienced users.
- YouTube Tutorials: Video tutorials can provide step-by-step visual guides for specific functions or complex tasks, often clearer than text-based instructions.
- Educational Websites: Many academic institutions and educational platforms offer free resources and exercises designed for graphing calculator practice.
Engaging with these resources can unlock new ways to use your calculator and overcome challenges that arise during your studies or work. Continual learning and practice are key to becoming truly proficient with this powerful technological tool.
aViewFromTheCave is a participant in the Amazon Services LLC Associates Program, an affiliate advertising program designed to provide a means for sites to earn advertising fees by advertising and linking to Amazon.com. Amazon, the Amazon logo, AmazonSupply, and the AmazonSupply logo are trademarks of Amazon.com, Inc. or its affiliates. As an Amazon Associate we earn affiliate commissions from qualifying purchases.