
In an era dominated by advanced software and online calculators, the humble graphing calculator might seem like an anachronism. Yet, for students and professionals in STEM fields, this dedicated piece of hardware remains an indispensable tool. Its tactile interface, immediate feedback, and offline capabilities make it a reliable companion for visualizing complex functions, analyzing data, and solving intricate mathematical problems. This guide will demystify the process of graphing in a calculator, transforming it from a perplexing device into a powerful asset.
The Enduring Relevance of Graphing Calculators
While sophisticated computer programs and apps offer dynamic visualizations, the graphing calculator holds a unique and enduring place in education and practical application. Understanding its utility begins with appreciating its core advantages.

Beyond Basic Arithmetic: Visualizing Functions
Traditional scientific calculators excel at numerical computations, handling everything from basic arithmetic to logarithms and trigonometry. However, their limitations become apparent when dealing with functions and their graphical representations. A graphing calculator transcends these boundaries by allowing users to plot equations and immediately see their visual characteristics. This capability is fundamental to understanding algebraic concepts like slopes, intercepts, asymptotes, and transformations. For instance, plotting y = x^2 and y = x^2 + 3 side-by-side offers instant insight into vertical shifts, a concept far more challenging to grasp through numerical analysis alone.
The visual feedback provided by a graphing calculator reinforces abstract mathematical concepts, turning equations into tangible curves and lines. This direct interaction aids in developing a deeper intuition for how different variables and operations affect a function’s behavior. It’s not just about getting the right answer; it’s about seeing the math in action.
Essential Tools for STEM Education and Professionals
From high school algebra to advanced calculus, physics, and engineering, graphing calculators are integral to the learning process. Standardized tests like the SAT, ACT, and AP exams often permit or even require their use, acknowledging their role in problem-solving. In higher education, they serve as quick reference tools for checking work or exploring concepts during lectures and problem sessions.
Beyond academia, professionals in fields such as engineering, data science, and finance might still find graphing calculators useful for quick, on-the-go calculations or preliminary analysis when a computer isn’t readily available. Their robust, self-contained nature ensures reliability in environments where internet access or software installations might be problematic. They are purpose-built for numerical and graphical computation, offering a focused user experience free from the distractions of a multi-purpose device.
Navigating Your Graphing Calculator: Fundamental Steps
While specific button layouts may vary between brands like Texas Instruments (TI), Casio, and Hewlett-Packard (HP), the core principles of graphing remain remarkably consistent. This section outlines the universal steps to get you started.
Getting Started: Powering On and Clearing Memory
The first step is, naturally, to power on your calculator. Most graphing calculators have a prominent ON button. Before starting any significant work, it’s often a good practice to clear any previous equations or data that might interfere with your current task. This is usually done through a 2nd or SHIFT function combined with MEM or CLEAR options, often accessed via a dedicated menu (e.g., 2nd + MEM -> 7: Reset -> 1: All RAM on TI-84). Always refer to your calculator’s specific manual for precise instructions on resetting or clearing memory. This ensures you start with a clean slate, preventing unexpected errors from lingering settings or equations.
Entering Equations: The ‘Y=’ Editor
The heart of graphing lies in the equation editor. On most graphing calculators, this is accessed via a button labeled Y=, f(x), or similar. Pressing this button will display a list of Y variables (e.g., Y1=, Y2=, Y3=). Each Y variable represents a slot for a function you wish to graph.
To enter an equation:
- Navigate to an empty
Yslot (e.g.,Y1). - Type your function using the calculator’s keypad. Remember to use the variable button (usually
X,T,θ,nor justX) for your independent variable. - Pay close attention to parentheses, especially when dealing with fractions, exponents, or complex expressions, to ensure correct order of operations. For example, to graph
y = (x+1)/(x-2), you must enclose both the numerator and denominator in parentheses.(X+1)/(X-2)is correct, whileX+1/X-2would be interpreted asX + (1/X) - 2. - Ensure your calculator is in the correct mode (e.g.,
FUNCTIONfory=f(x)graphs,RADIANorDEGREEfor trigonometric functions). This is typically set in theMODEmenu.
Setting the View: Understanding the Window Settings
Once your equation is entered, the next critical step is to define the viewing window. This determines the range of x and y values that will be displayed on your screen. The WINDOW button (or similar) opens a menu where you can set:
Xmin: The minimum x-value shown on the graph.Xmax: The maximum x-value shown on the graph.Xscl: The increment between tick marks on the x-axis.Ymin: The minimum y-value shown on the graph.Ymax: The maximum y-value shown on the graph.Yscl: The increment between tick marks on the y-axis.Xres: (TI only) The pixel resolution; a higher number means faster graphing but potentially less detail. Set to 1 for best detail.
Adjusting these settings is crucial. If your window is too small, you might miss key features of your graph. If it’s too large, the graph might appear as a flat line. Experimentation is key here. Many calculators offer ZOOM functions to help quickly set standard windows (e.g., ZoomStandard for -10 to 10 on both axes) or to zoom in/out around a cursor.
Plotting the Graph: The ‘GRAPH’ Button
With your equation entered and window settings configured, the final step is to press the GRAPH button. Your calculator will then plot the function(s) on the screen according to your specified window. If you don’t see anything, or if the graph looks incorrect, revisit your equation entry and window settings. Often, the ZOOM menu’s ZoomFit or ZoomOut options can help you quickly locate your graph if you’re lost.
Mastering Advanced Graphing Techniques
The power of a graphing calculator extends far beyond simply plotting a single line. Modern devices offer a suite of tools for deeper analysis and visualization.
Graphing Multiple Functions Simultaneously
One of the most valuable features is the ability to graph several functions on the same coordinate plane. By entering equations into Y1=, Y2=, Y3=, and so on, you can compare and contrast their behaviors. This is incredibly useful for understanding transformations, finding points of intersection, or visualizing systems of equations. Each function is typically plotted in a different color or line style, making them easy to distinguish.
Analyzing Graphs: Intersections, Zeros, and Maximums/Minimums

Once a graph is displayed, the calculator’s analysis tools come into play. These are usually found under a CALC (Calculate) or G-SOLV (Graph Solve) menu, often accessed by pressing 2nd then TRACE.
- Zeros (Roots): Finds the x-intercepts of a function (where
y=0). You’ll typically be asked to define a “Left Bound” and “Right Bound” around the zero, and then make a “Guess.” - Minimum/Maximum: Locates the lowest or highest point of a curve within a specified interval. Similar to finding zeros, you’ll set bounds and provide a guess.
- Intersection: Determines the point(s) where two or more graphs cross. After selecting “Intersection,” you’ll usually select the first curve, then the second curve, and then provide a guess near the intersection point you’re interested in.
- Value: Calculates the y-value of a function for a given x-value, or vice-versa.
These analytical tools are indispensable for solving equations, optimizing functions, and understanding the critical points of a graph without tedious manual calculation.
Utilizing Tables for Data Analysis
Another powerful feature is the TABLE function (often 2nd + GRAPH). This generates a table of x and y values for your entered functions. You can configure the TABLE SETUP (often 2nd + WINDOW) to specify the starting x-value (TblStart) and the increment between x-values (ΔTbl). This allows you to quickly see how a function’s output changes as its input varies, or to find specific integer points on a graph. It’s particularly useful for creating a set of coordinates for plotting by hand or for identifying integer solutions.
Parametric and Polar Equations (Optional/Advanced)
For more advanced mathematics, graphing calculators also support parametric and polar equations.
- Parametric Mode: Instead of
y = f(x), equations are defined byx = f(t)andy = g(t), wheretis a parameter. This is used for plotting curves that cannot be easily expressed as a function ofx, such as cycloids or Lissajous curves. - Polar Mode: Equations are defined in terms of
r = f(θ), whereris the distance from the origin andθis the angle. This is essential for graphing spirals, cardioids, and other curves best described in polar coordinates.
Switching to these modes is done via the MODE menu. While less commonly used by beginners, they demonstrate the calculator’s versatility for a wide range of mathematical applications.
Troubleshooting Common Graphing Issues
Even experienced users encounter issues. Understanding how to diagnose and resolve common problems will save you time and frustration.
‘ERR: SYNTAX’ and Other Error Messages
Error messages are your calculator’s way of telling you something is wrong.
ERR: SYNTAX: This is one of the most common errors, indicating a mistake in how an expression is typed. Common causes include unmatched parentheses, incorrect function arguments (e.g.,sqrt(-1)in Real mode), or using a minus sign for negation when a negative sign is required (e.g.,(-3)vs.–3). Double-check your equation carefully, paying attention to every character.ERR: WINDOW RANGE: Occurs ifXminis greater thanXmax,Yminis greater thanYmax, or ifXsclorYsclare zero or negative.ERR: DIVIDE BY 0: Usually appears when trying to evaluate a function at a point where it’s undefined (e.g.,1/XatX=0). The calculator might skip plotting that point.ERR: INVALID DIMENSION: Often related to statistical plots, indicating a problem with list sizes or plot settings.
When an error occurs, the calculator often offers a GO TO option, which will place your cursor at the likely source of the error in your equation or setting.
Adjusting Window Settings for Better Visibility
A graph might appear blank or incomplete if the window settings are inappropriate for the function you’ve entered.
- No graph visible: Your function’s range might be entirely outside your current
Ymin/Ymax. TryZoomFitor manually adjustYmin/Ymaxbased on what you expect the function’s output to be. - Graph appears as a straight line: Your
Xmin/Xmaxmight be too large, compressing the function’s features. TryZoomStandardorZoomIn. - Missing features (e.g., asymptotes, turning points): Your
Xmin/Xmaxmight be too narrow. Expand the range or shift the window. - Pixelated or jagged lines: Your
Xres(on TI calculators) might be too high, or your window might be too wide for the calculator’s resolution. ReduceXresto 1 for the highest detail, or narrow your window.
Checking Equation Entry and Mode Settings
Always re-verify your equation entry. A misplaced +, a forgotten parenthesis, or an incorrect variable can lead to drastically different graphs. Additionally, ensure your calculator is in the correct mode:
FUNCTIONmode fory=f(x)graphs.RADIANorDEGREEmode for trigonometric functions, depending on the problem’s requirements. Most calculus problems use radians.REALora+bimode (complex numbers) if you are expecting real number outputs.
If all else fails, a full memory reset (as discussed in “Getting Started”) can often resolve persistent, inexplicable issues, though it will erase all saved data.
Choosing the Right Graphing Calculator and Maximizing Its Potential
The market offers several excellent graphing calculators, each with its strengths. Choosing the right one and then continuously exploring its capabilities will amplify your mathematical proficiency.
Popular Models: TI-84 Plus, Casio fx-CG50, HP Prime
- TI-84 Plus CE: The undisputed king in many classrooms, especially in the US. It’s incredibly robust, with a vast online community, numerous tutorials, and compatibility with most standardized tests. It features a color screen and is relatively easy to learn.
- Casio fx-CG50 (PRIZM): A strong competitor with a high-resolution color display and a more intuitive icon-based menu system. It often feels more modern and can be faster for some operations. It’s popular internationally and gaining traction in the US.
- HP Prime: A powerful and advanced calculator aimed at more technical users, with a full-color touchscreen, CAS (Computer Algebra System) capabilities, and a sleek design. It has a steeper learning curve but offers incredible functionality.
The best choice often depends on institutional requirements, personal preference, and budget. For general use and widespread compatibility, the TI-84 Plus CE remains a safe bet.
Integrating Calculator Skills with Modern Software
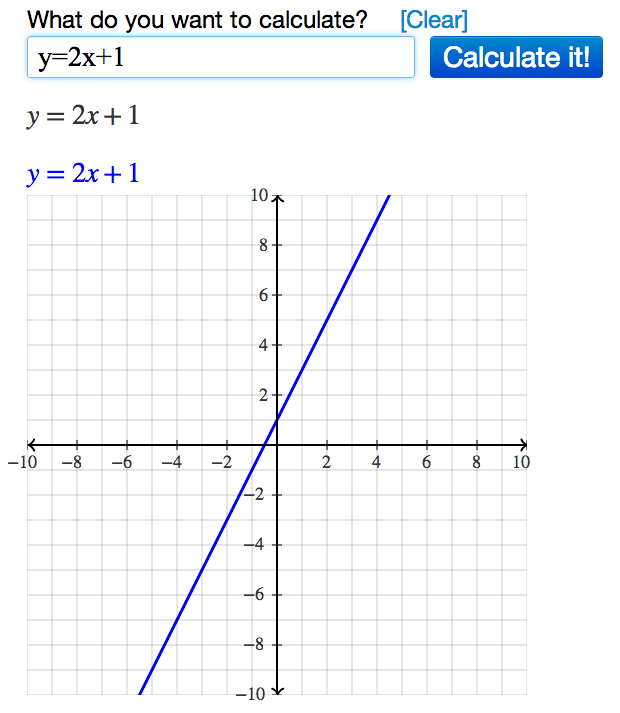
While dedicated graphing calculators are powerful, their functionality can be augmented by integrating their use with modern software. Tools like Desmos, GeoGebra, and Wolfram Alpha offer dynamic, interactive graphing capabilities that can help visualize functions even more clearly than a calculator screen. Use these software tools to explore concepts, confirm calculator results, or tackle problems that benefit from infinite zooming or advanced symbolic manipulation. The calculator then becomes a portable, exam-approved device for applying the principles learned through broader digital exploration.
Continuous Learning and Practice
Like any skill, mastering a graphing calculator requires practice. Don’t just use it to solve problems; use it to explore concepts.
- Experiment with different functions and their transformations.
- Graph equations to verify analytical solutions.
- Use the table feature to understand discrete points.
- Challenge yourself to graph unfamiliar types of equations.
Regular practice, coupled with an understanding of the underlying mathematical principles, will transform your graphing calculator from a mere gadget into an extension of your mathematical intellect, empowering you to tackle complex problems with confidence and precision.
aViewFromTheCave is a participant in the Amazon Services LLC Associates Program, an affiliate advertising program designed to provide a means for sites to earn advertising fees by advertising and linking to Amazon.com. Amazon, the Amazon logo, AmazonSupply, and the AmazonSupply logo are trademarks of Amazon.com, Inc. or its affiliates. As an Amazon Associate we earn affiliate commissions from qualifying purchases.