
In the intricate world of finance, understanding percentages isn’t just a useful skill—it’s an absolute necessity. From managing personal budgets to dissecting complex investment reports and strategizing for business growth, percentages serve as the universal language for comparison, analysis, and forecasting. They allow us to grasp relationships between numbers, quantify change, and make informed decisions that impact our financial well-being. This guide will demystify the core mechanics of calculating percentages and illustrate their indispensable role across various financial applications, helping you unlock deeper insights into your money.
The Core Formula: Unlocking Financial Insights
At its heart, finding what percentage of one number another is involves a straightforward mathematical operation. However, its simplicity belies its immense power when applied to financial contexts. Mastering this fundamental formula is the first step towards robust financial literacy.
Understanding the Components: Part, Whole, and Percentage
Before diving into the calculation, it’s crucial to identify the three key components involved:
- The Part: This is the specific amount or quantity you are comparing. It represents a portion of the larger whole.
- The Whole (or Total): This is the entire amount, the base against which the part is being measured. It serves as the reference point for your percentage calculation.
- The Percentage: This is the resulting value, expressed as a fraction of 100, indicating how much of the whole the part represents.
For instance, if you want to know what percentage of your income goes to rent, your rent payment is the “part,” and your total income is the “whole.”
The Simple Calculation: (Part / Whole) * 100
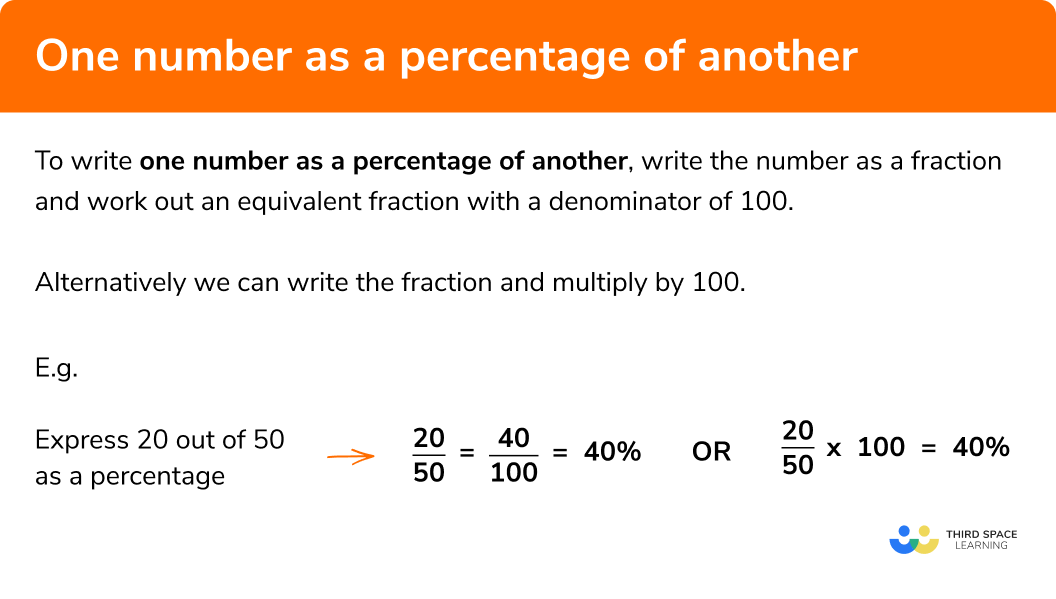
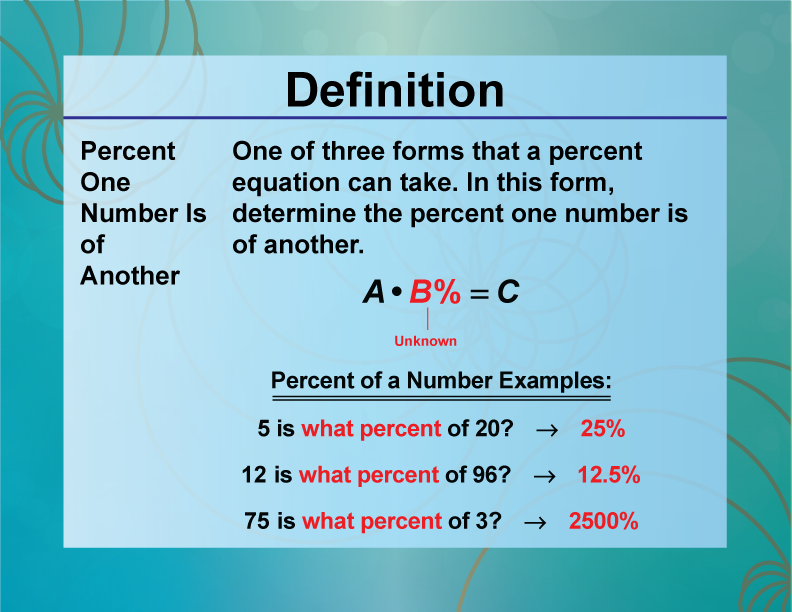
The formula for determining what percentage of a number another is remarkably simple:
Percentage = (Part ÷ Whole) × 100
Let’s break down why this works:
- Divide the Part by the Whole (Part ÷ Whole): This step converts the part into a decimal fraction of the whole. For example, if your rent is $1,000 and your income is $4,000, then $1,000 ÷ $4,000 = 0.25. This decimal represents that your rent is one-quarter of your income.
- Multiply by 100 (× 100): To express this decimal as a percentage (meaning “per hundred”), you multiply the result by 100. Continuing our example, 0.25 × 100 = 25%. This tells you that 25% of your income goes to rent.
This formula is the bedrock for nearly every percentage calculation you’ll encounter in finance, from calculating discounts to determining investment returns.
A Quick Example: Calculating Discount Rates
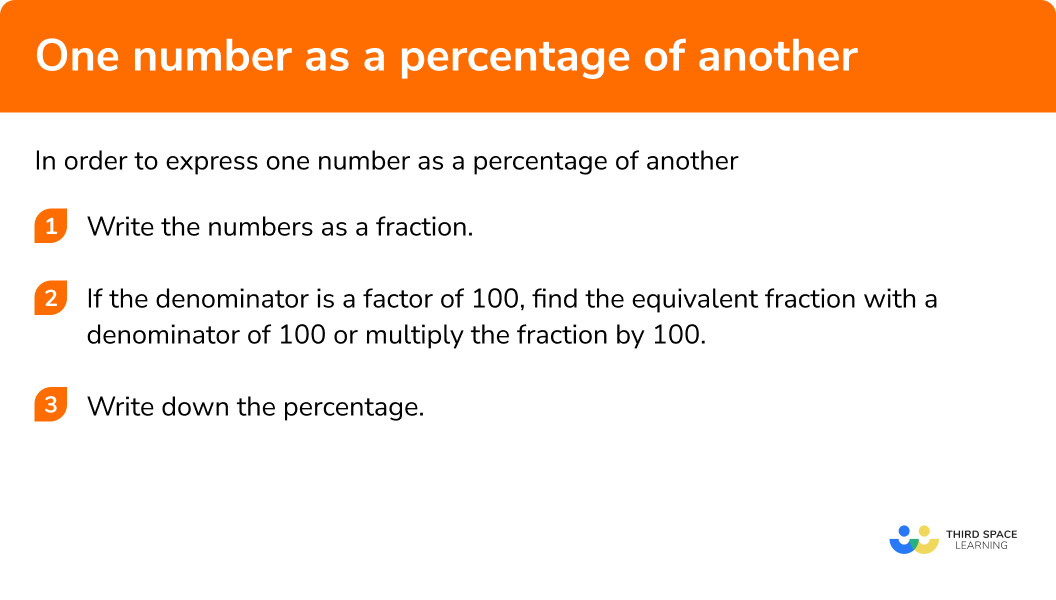
Imagine you’re shopping for a new gadget, originally priced at $500, but now on sale for $375. You want to know the percentage discount you’re receiving.
- Identify the Part and Whole:
- The “whole” is the original price: $500.
- The “part” in this case is the amount saved, not the sale price. Amount saved = Original Price – Sale Price = $500 – $375 = $125.
- Apply the Formula:
- Percentage Discount = ($125 ÷ $500) × 100
- Percentage Discount = 0.25 × 100
- Percentage Discount = 25%
You’re getting a 25% discount, a crucial piece of information for evaluating the deal’s value.
Practical Applications in Personal Finance
Personal finance is replete with scenarios where a solid grasp of percentage calculations is paramount. It empowers individuals to make informed decisions about their spending, saving, and debt management.
Budgeting and Income Allocation
One of the most fundamental applications is in budgeting. Understanding what percentage of your income is allocated to different categories helps you gain control over your spending and align it with your financial goals.
- Example: If your monthly take-home pay is $4,500, and you spend $1,350 on housing, $675 on food, and $450 on transportation:
- Housing: ($1,350 ÷ $4,500) × 100 = 30%
- Food: ($675 ÷ $4,500) × 100 = 15%
- Transportation: ($450 ÷ $4,500) × 100 = 10%
By visualizing these proportions, you can identify areas where you might be overspending or where adjustments could free up funds for savings or investments. This approach forms the basis of popular budgeting rules, like the 50/30/20 rule (50% needs, 30% wants, 20% savings/debt repayment).
Understanding Debt Ratios and Interest
Percentages are critical when dealing with debt, especially consumer loans and credit cards. They help you comprehend interest rates, assess your debt burden, and plan repayment strategies.
- Credit Card Interest: If your credit card balance is $2,000 and the annual interest rate is 18%, this 18% is a percentage of your outstanding balance that you will owe over a year. While calculating monthly interest involves more steps, understanding that 18% of $2,000 is $360 per year in interest (before compounding) highlights the cost of carrying a balance.
- Debt-to-Income Ratio (DTI): Lenders often use your DTI to assess your ability to manage monthly payments and repay new debts. If your total monthly debt payments (e.g., mortgage, car loan, credit cards) are $1,500 and your gross monthly income is $5,000:
- DTI = ($1,500 ÷ $5,000) × 100 = 30%
A lower DTI percentage generally indicates better financial health and a higher likelihood of loan approval.
- DTI = ($1,500 ÷ $5,000) × 100 = 30%
Tracking Savings Progress and Financial Goals
Achieving financial goals, whether saving for a down payment or retirement, requires consistent tracking. Percentages provide a clear metric for measuring progress.
- Example: You aim to save $20,000 for a down payment, and you’ve currently accumulated $7,000.
- Progress = ($7,000 ÷ $20,000) × 100 = 35%
Knowing you’re 35% of the way to your goal can be incredibly motivating and helps you adjust your savings rate if necessary.
- Progress = ($7,000 ÷ $20,000) × 100 = 35%
Leveraging Percentages for Investment Success
For investors, percentages are the lingua franca of performance analysis, risk assessment, and portfolio management. They enable direct comparison between different assets and strategies, irrespective of their absolute monetary values.
Measuring Return on Investment (ROI)
ROI is perhaps the most fundamental percentage in investing, indicating the profitability of an investment relative to its cost.
ROI = [(Current Value of Investment – Original Cost) ÷ Original Cost] × 100
- Example: You invested $10,000 in a stock, and it’s now worth $12,500.
- Gain = $12,500 – $10,000 = $2,500
- ROI = ($2,500 ÷ $10,000) × 100 = 25%
A 25% ROI provides a clear, comparable metric of how well your investment performed.
Analyzing Portfolio Diversification
Modern portfolio theory emphasizes diversification to manage risk. Percentages are essential for ensuring your assets are spread appropriately across different categories.
- Example: If your investment portfolio totals $100,000, and you have $40,000 in stocks, $35,000 in bonds, and $25,000 in real estate.
- Stocks: ($40,000 ÷ $100,000) × 100 = 40%
- Bonds: ($35,000 ÷ $100,000) × 100 = 35%
- Real Estate: ($25,000 ÷ $100,000) × 100 = 25%
This breakdown allows you to quickly see if your asset allocation aligns with your desired risk profile (e.g., a common 60% stocks, 40% bonds allocation for growth-oriented investors).
Deciphering Dividend Yields and Expense Ratios
For income-seeking investors, dividend yields are crucial, and for mutual fund or ETF investors, expense ratios are vital for understanding costs.
- Dividend Yield: This shows the percentage return on an investment purely from dividends. If a stock trades at $50 per share and pays an annual dividend of $2 per share:
- Dividend Yield = ($2 ÷ $50) × 100 = 4%
- Expense Ratio: This is the percentage of your investment that goes towards managing a fund annually. An expense ratio of 0.50% means that for every $1,000 invested, $5 will be deducted annually for fees. A seemingly small percentage can have a significant cumulative impact on long-term returns.
Business Finance: Driving Profitability and Growth
In the realm of business, percentages are fundamental tools for financial analysis, performance evaluation, and strategic planning. They allow businesses to benchmark against competitors, identify trends, and make decisions that impact the bottom line.
Calculating Profit Margins (Gross and Net)
Profitability is the lifeblood of any business, and profit margins, expressed as percentages, offer a clear picture of how efficiently a company converts revenue into profit.
- Gross Profit Margin: (Gross Profit ÷ Revenue) × 100. Gross profit is revenue minus the cost of goods sold. A high gross margin indicates efficient production or strong pricing power.
- Example: If a company has $1,000,000 in revenue and a cost of goods sold of $600,000, its gross profit is $400,000.
- Gross Profit Margin = ($400,000 ÷ $1,000,000) × 100 = 40%
- Net Profit Margin: (Net Income ÷ Revenue) × 100. Net income is what’s left after all expenses, including taxes, are subtracted from revenue. This is the ultimate measure of a company’s overall profitability.
- Example: If the same company has a net income of $150,000.
- Net Profit Margin = ($150,000 ÷ $1,000,000) × 100 = 15%
These percentages are vital for comparing a company’s performance over time and against industry averages.
Assessing Market Share and Growth Rates
Businesses use percentages to understand their position in the market and how quickly they are expanding.
- Market Share: If the total market for a product is $10 million, and your company’s sales for that product are $2 million:
- Market Share = ($2,000,000 ÷ $10,000,000) × 100 = 20%
This percentage tells you your competitive standing.
- Market Share = ($2,000,000 ÷ $10,000,000) × 100 = 20%
- Growth Rate: To calculate year-over-year revenue growth: [(Current Year Revenue – Previous Year Revenue) ÷ Previous Year Revenue] × 100.
- Example: If revenue grew from $1,000,000 to $1,200,000.
- Growth Rate = [($1,200,000 – $1,000,000) ÷ $1,000,000] × 100 = 20%
Tracking growth rates is critical for investors and management alike to gauge a company’s trajectory.
Understanding Cost Structures and Efficiency
Analyzing costs as a percentage of revenue or total expenses helps businesses identify inefficiencies and areas for optimization.
- Operating Expenses as a Percentage of Revenue: If operating expenses are $200,000 and revenue is $1,000,000:
- Operating Expense Ratio = ($200,000 ÷ $1,000,000) × 100 = 20%
A high or rising percentage might signal ballooning overheads that need to be addressed. Similarly, analyzing the percentage of specific costs (e.g., marketing, research & development) against total expenses or revenue helps manage budgets and allocate resources effectively.
- Operating Expense Ratio = ($200,000 ÷ $1,000,000) × 100 = 20%
Common Pitfalls and Advanced Considerations
While the core percentage formula is simple, its application in finance can sometimes be nuanced. Being aware of common pitfalls and understanding how context impacts interpretation is key to avoiding miscalculations and drawing accurate conclusions.
The Importance of the “Whole” in Context
The most frequent error in percentage calculations is misidentifying the “whole” or the base number. A percentage is always relative to its whole, and changing the whole changes the meaning of the percentage.
- Example: If your stock drops 10% in value one year and then rises 10% the next, you might assume you’re back to even. However, if your $100 investment drops to $90 (a 10% loss), a 10% gain on $90 is only $9, bringing your total to $99. The “whole” changed from $100 to $90 for the second calculation. Always confirm what figure you are taking a percentage of.
Using Financial Tools for Complex Calculations
While manual calculation of basic percentages is straightforward, complex financial scenarios often involve multiple percentages, compounding effects, or large datasets. Leveraging financial tools like spreadsheets (Excel, Google Sheets), dedicated financial calculators, or accounting software can streamline these processes and reduce errors. These tools often have built-in functions that handle the percentage calculations for you, allowing you to focus on interpreting the results.
- Spreadsheet Formulas:
=(Part/Whole)for decimal, and then format as percentage. For percentage change,=(New Value - Old Value) / Old Value. - Financial Calculators: Often have dedicated percentage keys or functions for calculating things like interest, discounts, and markups.
Interpreting Percentage Changes Over Time
When analyzing financial data over time, it’s crucial to distinguish between simple percentage changes and compound annual growth rates (CAGR). Simple percentage change shows the change between two points, while CAGR smooths out volatility to show an annualized growth rate over multiple periods. Understanding the difference is vital for accurately assessing long-term performance. A 10% year-over-year growth rate is very different from a 10% total growth over five years.
Conclusion
Mastering how to find what percentage of a number another is transcends a mere mathematical exercise; it is a foundational pillar of financial literacy. From meticulously managing your personal budget and strategically navigating investment opportunities to driving profitability in business, percentages provide the clarity and precision needed to make informed decisions. By understanding the core formula, diligently applying it to diverse financial contexts, and being mindful of contextual nuances, you empower yourself to better analyze, understand, and ultimately control your financial destiny. In a world increasingly driven by data, the ability to fluently speak the language of percentages is an invaluable asset for anyone seeking financial success.
aViewFromTheCave is a participant in the Amazon Services LLC Associates Program, an affiliate advertising program designed to provide a means for sites to earn advertising fees by advertising and linking to Amazon.com. Amazon, the Amazon logo, AmazonSupply, and the AmazonSupply logo are trademarks of Amazon.com, Inc. or its affiliates. As an Amazon Associate we earn affiliate commissions from qualifying purchases.