
In the dynamic world of personal finance, investing, and business operations, numbers tell a story. But raw figures alone often lack the power to convey true progress, decline, or relative performance. This is where the concept of percentage change becomes an indispensable tool. Understanding how to accurately calculate and interpret percentage increases and decreases isn’t just an academic exercise; it’s a fundamental skill that empowers individuals and businesses to make informed decisions, assess performance, and navigate the complex financial landscape with greater clarity and confidence.
From tracking the growth of your investment portfolio to analyzing shifts in market share, from evaluating the effectiveness of a marketing campaign to managing household budgets more effectively, percentage change provides a standardized, comparative metric. It transforms disparate figures into actionable insights, allowing you to gauge the magnitude and direction of change relative to an initial state. This article will demystify the process, provide a universal formula, illustrate its application across various financial scenarios, and equip you with the expertise to leverage this powerful analytical technique for your own financial success.
The Indispensable Role of Percentage Change in Finance
At its heart, finance is about managing resources over time, and time inevitably brings change. Whether it’s the fluctuating value of an asset, the shifting cost of living, or the ebb and flow of business revenues, understanding the rate of change is often more critical than just knowing the absolute difference. Percentage change provides this crucial context, making it a cornerstone of financial literacy and analysis.
Unpacking the Concept: What is Percentage Change?
Percentage change is a mathematical concept that describes the extent to which a value has changed relative to its original value. It expresses this change as a fraction of the original value, multiplied by 100 to convert it into a percentage. This standardization is key because it allows for direct comparisons between different figures, even if their absolute values are vastly different.
For instance, a $100 increase in a $1,000 investment represents a 10% gain. A $100 increase in a $10,000 investment, however, is only a 1% gain. While the absolute dollar increase is the same, the impact and performance are markedly different. Percentage change helps us immediately grasp this difference, highlighting the relative significance of the change.
Why Every Financial Decision Maker Needs This Skill
The ability to calculate and understand percentage change is vital across virtually all facets of financial management:
- Personal Finance: Are your utility bills increasing or decreasing year-over-year? How much has your savings account grown? What’s the real interest rate increase on your mortgage? Percentage change helps you track personal financial health, budget effectively, and identify trends in your income and expenses.
- Investing: This is where percentage change truly shines. Investment returns are almost universally quoted as percentages (e.g., “the stock gained 5% today”). You’ll use it to calculate portfolio growth, analyze individual asset performance, understand dividend yields, and compare the performance of different investment vehicles or fund managers.
- Business Finance: For entrepreneurs and business owners, percentage change is critical for measuring growth in sales, profit margins, employee headcount, and market share. It helps in trend analysis, forecasting, and evaluating the success of strategic initiatives. A decline in profit margin, for example, signals potential operational issues that need immediate attention.
- Economic Analysis: Understanding inflation rates, GDP growth, interest rate shifts, and unemployment rate changes – all expressed as percentages – is essential for comprehending broader economic health and making macroeconomic forecasts that impact everyone’s financial well-being.
Without this skill, financial data remains a confusing collection of numbers. With it, you unlock the stories these numbers are trying to tell, enabling smarter, more strategic financial planning.
Mastering the Fundamentals: The Universal Formula
The beauty of percentage change lies in its consistent and straightforward formula, applicable whether you’re dealing with an increase or a decrease. Once you grasp this core calculation, you can apply it to any financial scenario.
The Core Calculation: (New Value – Old Value) / Old Value * 100
This single formula is the bedrock of all percentage change calculations. Let’s break down its components:
- New Value (or Current Value): This is the figure you have after the change has occurred.
- Old Value (or Original Value/Base Value): This is the figure you started with before the change.
- Difference (New Value – Old Value): This calculates the absolute amount of change. If the result is positive, it’s an increase; if negative, it’s a decrease.
- Division by Old Value: This step normalizes the change by relating it back to the original size. It answers the question: “How large is the change relative to what we started with?”
- Multiplication by 100: This converts the decimal result into a percentage, making it easier to read and compare.
The sign of the final percentage will indicate whether it’s an increase (positive result) or a decrease (negative result).
Step-by-Step for Percentage Increase
A percentage increase occurs when the new value is greater than the old value. The steps are as follows:
- Identify the Old Value: What was the starting point?
- Identify the New Value: What is the ending point?
- Calculate the Difference: Subtract the Old Value from the New Value (New Value – Old Value). The result should be positive.
- Divide by the Old Value: Divide the difference by the Old Value.
- Multiply by 100: Convert the decimal to a percentage.
Example: Investment Growth
Suppose your investment portfolio was worth $50,000 at the beginning of the year and grew to $55,000 by year-end.
- Old Value: $50,000
- New Value: $55,000
- Difference: $55,000 – $50,000 = $5,000
- Divide: $5,000 / $50,000 = 0.10
- Multiply by 100: 0.10 * 100 = 10%
Your investment portfolio saw a 10% increase.
Step-by-Step for Percentage Decrease
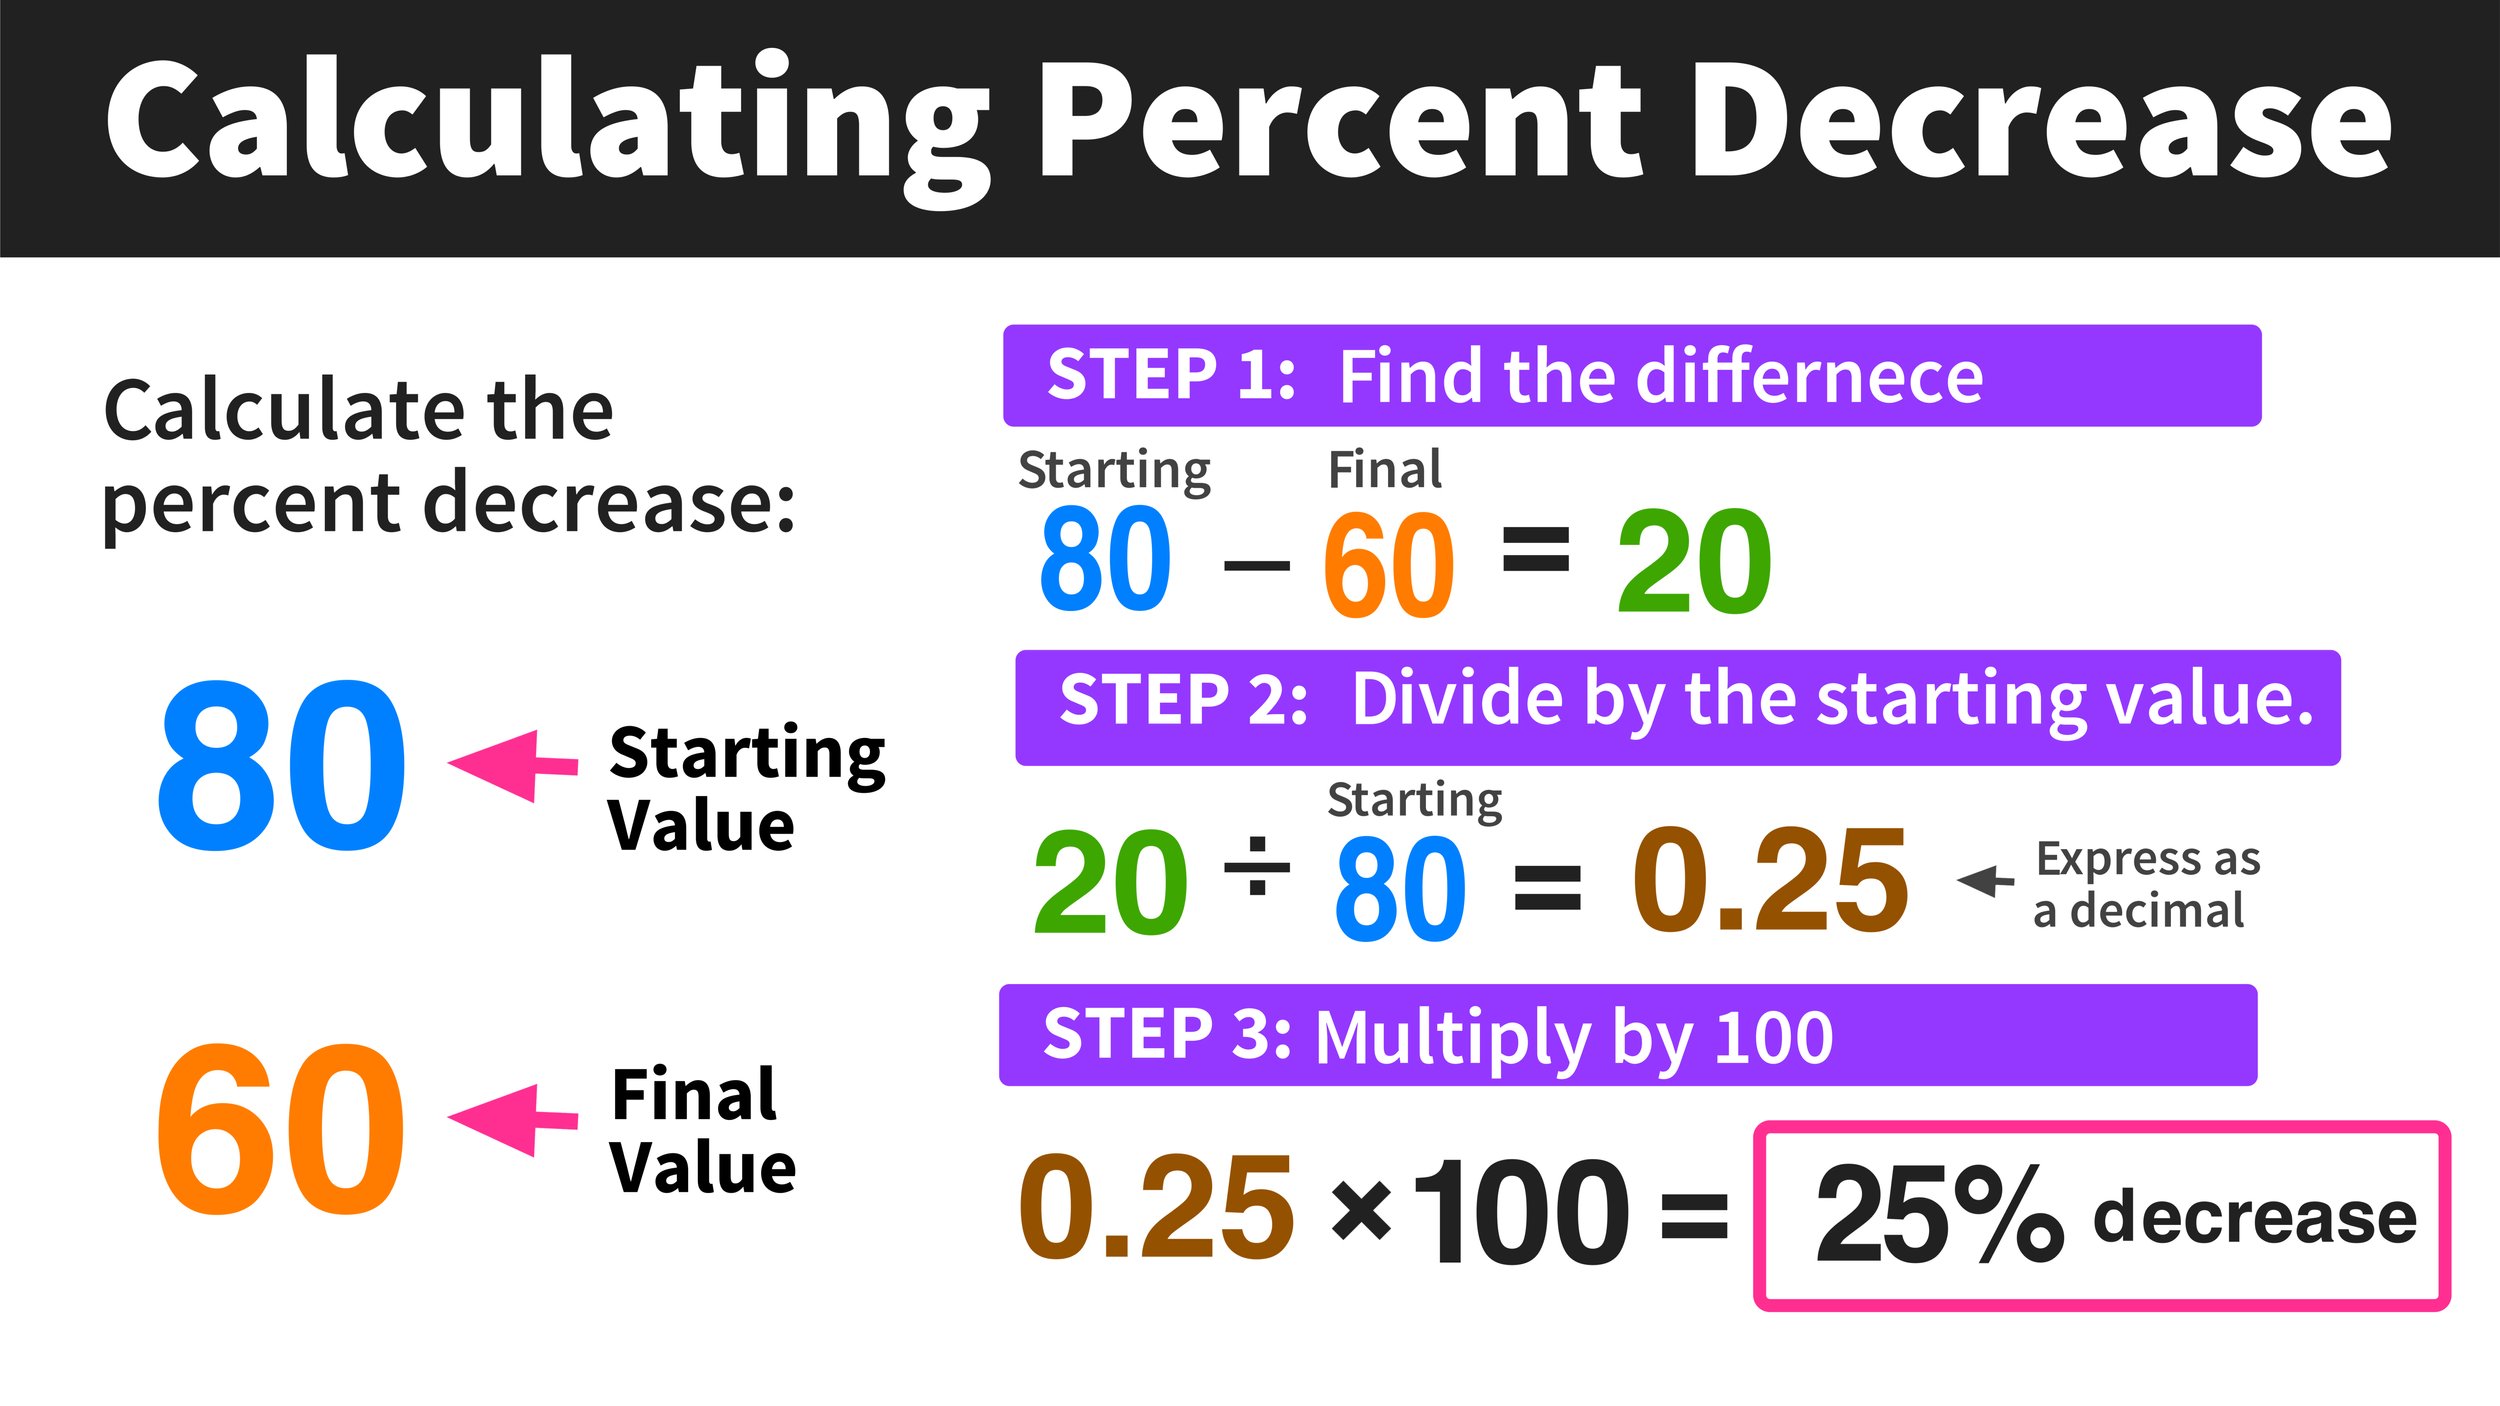
A percentage decrease occurs when the new value is less than the old value. The process is identical, but the initial difference calculation will yield a negative number, reflecting the reduction.
- Identify the Old Value: What was the starting point?
- Identify the New Value: What is the ending point?
- Calculate the Difference: Subtract the Old Value from the New Value (New Value – Old Value). The result should be negative.
- Divide by the Old Value: Divide the (negative) difference by the Old Value.
- Multiply by 100: Convert the decimal to a percentage. The final result will be a negative percentage, indicating a decrease. (Often, when stating a decrease, we simply say “a 10% decrease” rather than “a -10% change”).
Example: Expense Reduction
Last month, your household spent $300 on groceries. This month, due to careful budgeting, you spent $270.
- Old Value: $300
- New Value: $270
- Difference: $270 – $300 = -$30
- Divide: -$30 / $300 = -0.10
- Multiply by 100: -0.10 * 100 = -10%
You achieved a 10% decrease in grocery expenses.
Real-World Applications Across Your Financial Landscape
The power of percentage change lies in its versatility. Once you understand the calculation, you can apply it to a myriad of financial situations, translating raw data into meaningful insights.

Personal Finance: Budgeting, Savings, and Debt Management
For personal financial management, percentage change is invaluable for tracking progress towards goals and identifying areas for improvement.
- Budgeting: Compare your actual spending on a category (e.g., dining out) to your budgeted amount. If you budgeted $200 and spent $250, that’s a (250-200)/200 * 100 = 25% overspend. This quickly signals where adjustments are needed. You can also track month-over-month or year-over-year changes in income and expenses to spot trends.
- Savings: Monitor the growth of your emergency fund or retirement savings. A 7% annual increase in your retirement account balance feels much more tangible than simply seeing a dollar amount change.
- Debt Management: If you’re actively paying down debt, calculate the percentage decrease in your outstanding balance month-over-month. Seeing that your credit card balance has decreased by 15% can be a powerful motivator. Similarly, understanding the percentage increase in interest rates on loans can inform refinancing decisions.
Investing: Analyzing Returns and Portfolio Performance
In the world of investing, nearly every metric of performance relies on percentage change.
- Individual Asset Returns: Whether it’s stocks, bonds, or real estate, returns are almost always expressed as a percentage. “This stock is up 2.5% today” or “The fund has yielded an average of 8% annually over the last five years.” These percentages allow for direct comparison between different investments.
- Portfolio Performance: To assess how your entire investment portfolio is performing, you calculate its overall percentage change in value over specific periods (e.g., quarterly, annually). This allows you to benchmark your performance against market indices or other investment strategies.
- Dividend Yields: Expressed as a percentage, dividend yield (annual dividend per share / share price) helps investors understand the income generated relative to the investment cost.
- Inflation Adjustment: Understanding the percentage increase in inflation is crucial for assessing real (inflation-adjusted) returns on investments.
Business Finance: Tracking Growth, Profitability, and Costs
For businesses, percentage change is a critical tool for operational analysis, strategic planning, and investor reporting.
- Sales Growth: Businesses constantly track the percentage increase in sales revenue quarter-over-quarter or year-over-year. A 15% annual sales growth is a clear indicator of market traction.
- Profit Margins: Gross profit margin, operating profit margin, and net profit margin are all expressed as percentages. Tracking changes in these percentages over time reveals the efficiency and profitability of the business. A decreasing profit margin, even with increasing sales, is a red flag.
- Cost Control: Monitoring percentage changes in production costs, marketing expenses, or overheads helps identify areas where costs are spiraling or where efficiency improvements are taking effect. For example, a 5% decrease in manufacturing costs year-over-year can significantly boost profitability.
- Market Share: By tracking the percentage of the total market that a company’s sales represent, businesses can gauge their competitive position and growth within their industry.
Beyond the Basics: Advanced Considerations and Common Pitfalls
While the core formula is simple, understanding its nuances and potential misinterpretations is crucial for accurate financial analysis. Avoiding common pitfalls can prevent costly errors in judgment.
The Importance of the Base Value: Avoiding Misinterpretations
The “Old Value” or base value is critical. Any misapplication of the base value can lead to drastically incorrect percentages.
-
Always use the original value as the denominator. If you want to know the percentage increase from $100 to $120, the base is $100. If you then want to know the percentage decrease from $120 back to $100, the base becomes $120, not $100.
- Increase: ($120 – $100) / $100 = 20%
- Decrease: ($100 – $120) / $120 = -16.67%
Notice that a 20% increase is not “undone” by a 20% decrease from the new value. This is a common mistake.
-
Be clear about what “Old Value” you’re comparing against. Are you comparing to the previous month, the previous year, or the start of a project? Context is paramount.
Chained Percentage Changes: When Compounding Matters
When multiple percentage changes occur sequentially, you cannot simply add or subtract the percentages. You must apply them one after another to the evolving base value. This is known as compounding.
Example: An investment increases by 10% in year 1 and then by another 5% in year 2.
- Initial Investment: $1,000
- Year 1 increase: $1,000 * 1.10 = $1,100
- Year 2 increase: $1,100 * 1.05 = $1,155
The total increase is not 10% + 5% = 15%. It’s ($1,155 – $1,000) / $1,000 = 15.5%. This slight difference can become substantial over many periods or with larger percentages, especially in long-term investing.
Leveraging Technology for Accuracy and Efficiency
While manual calculation is essential for understanding the concept, financial professionals and individuals often rely on tools for efficiency and to minimize errors.
- Calculators: Most scientific and financial calculators have a percentage function, simplifying the process.
- Spreadsheets (e.g., Microsoft Excel, Google Sheets): These are invaluable for financial analysis. You can set up formulas that automatically calculate percentage changes across large datasets, making it easy to track performance over time for multiple accounts, investments, or business metrics. For example,
=(B2-A2)/A2in Excel would calculate the percentage change between values in cells A2 and B2.
These tools don’t replace understanding the formula; rather, they augment your ability to apply it broadly and accurately.
Interpreting and Acting on Your Financial Data
Calculating percentage change is merely the first step. The true value comes from interpreting these figures and allowing them to guide your financial actions. Numbers without context or a plan are just numbers.
From Numbers to Insights: Making Informed Decisions
Once you have your percentage change figures, ask critical questions:
- Is this percentage good or bad? A 5% increase in investment might be excellent in a bear market but poor in a bull market. A 2% increase in expenses might be negligible for some, but catastrophic for a tight budget. Context matters.
- What caused this change? Dig deeper. Did your sales increase by 10% due to a new product, or simply because of a general market boom? Did your expenses decrease because you cut costs or because of a one-time discount?
- How does this compare to benchmarks? Is your 8% portfolio return better or worse than the S&P 500’s return for the same period? Is your business’s 12% profit margin healthy compared to industry averages?
- What trends are emerging? Consistent small percentage changes in one direction can indicate a significant trend. Is your emergency fund consistently growing at a healthy rate? Are your discretionary expenses slowly creeping up?

Strategic Planning: Using Percentage Change for Goal Setting
Percentage changes are excellent for setting clear, measurable financial goals.
- “I want to increase my monthly savings by 15% this quarter.”
- “Our business aims for a 20% year-over-year revenue growth.”
- “I want to decrease my high-interest debt by 10% every month until it’s paid off.”
These percentage-based goals are specific, trackable, and motivate action. They allow you to quantify success and adjust your strategies when you fall short.
By mastering how to find the percentage increase or decrease, you gain a powerful lens through which to view and understand your financial world. It transforms you from a passive observer of numbers into an active, informed participant capable of making strategic decisions that drive financial growth, mitigate risks, and achieve long-term prosperity. Embrace this fundamental skill, and watch your financial acumen soar.
aViewFromTheCave is a participant in the Amazon Services LLC Associates Program, an affiliate advertising program designed to provide a means for sites to earn advertising fees by advertising and linking to Amazon.com. Amazon, the Amazon logo, AmazonSupply, and the AmazonSupply logo are trademarks of Amazon.com, Inc. or its affiliates. As an Amazon Associate we earn affiliate commissions from qualifying purchases.