
Graphing an equation is no longer a task confined to the margins of a paper notebook or the flickering screen of a legacy handheld calculator. In the modern technological landscape, the ability to visualize mathematical relationships has evolved into a sophisticated discipline involving high-powered software, real-time interactive web applications, and artificial intelligence. Whether you are a software developer modeling a physics engine, a data scientist identifying trends, or a student mastering algebra, understanding the digital tools and methodologies for graphing equations is essential.
The process of graphing involves translating abstract algebraic expressions into a visual format on a coordinate plane. This transformation allows the human brain to process complex data patterns, asymptotic behavior, and intersections that are often obscured in raw numerical form. Today, the “how” of graphing is as much about selecting the right software stack as it is about understanding the underlying mathematics.
The Foundation: From Cartesian Planes to Digital Interfaces
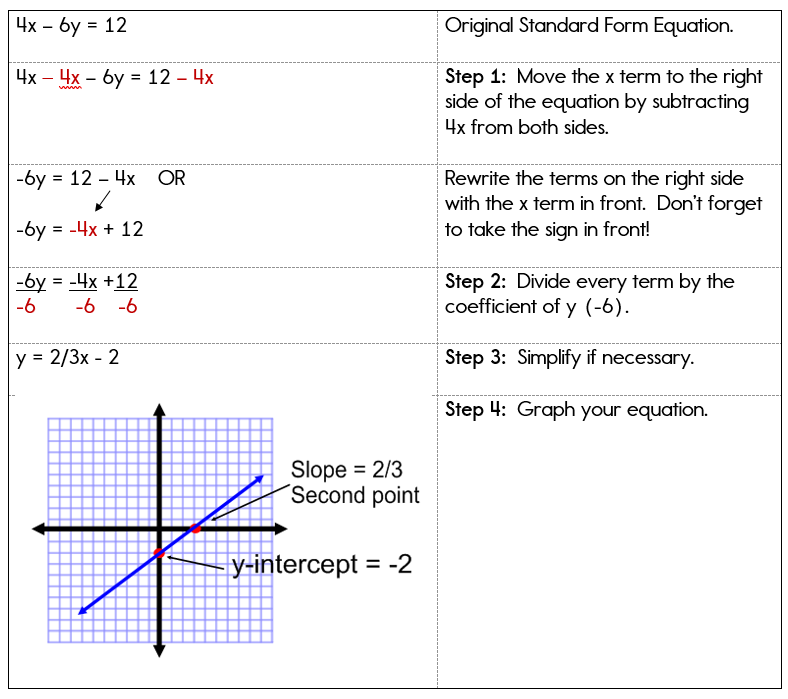
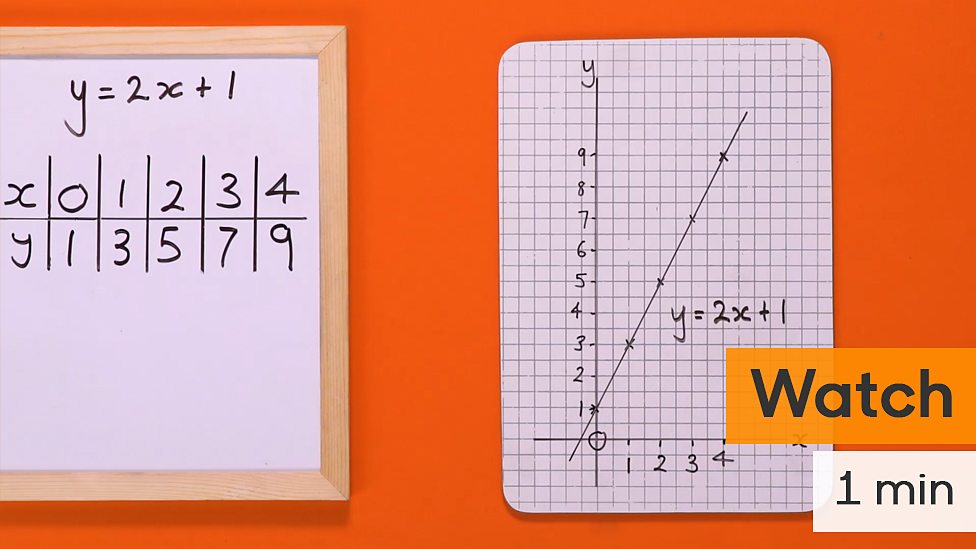
Before diving into high-end software, it is vital to recognize the foundational logic that digital graphing tools automate. At its core, graphing an equation—such as a linear $y = mx + b$ or a quadratic $y = ax^2 + bx + c$—requires a mapping of input values (the domain) to output values (the range).
The Mechanics of Point Plotting and Scaling
Digital tools handle the heavy lifting of calculating thousands of coordinate pairs in milliseconds. When you input an equation into a modern graphing engine, the software executes a loop, sampling values along the x-axis and calculating the corresponding y-values. In a tech context, this is often referred to as “sampling density.” A high-quality graphing tool ensures that the resolution of the plot remains sharp even when zooming into infinitesimal sections of a curve. This is achieved through vector-based rendering, which maintains mathematical precision regardless of the display’s pixel density.
Understanding the Coordinate System in Modern Software
Most digital graphing tools utilize the Cartesian coordinate system, but advanced software now supports polar, parametric, and spherical coordinates. For tech professionals, the ability to toggle between these systems is crucial. For instance, game developers often use polar coordinates for circular motion or field-of-view calculations, and having a tool that can instantly render these equations visually is a massive productivity booster.
Essential Web-Based and Mobile Tools for Graphing
The accessibility of graphing has been revolutionized by cloud-based platforms and mobile applications. These tools have democratized high-level mathematics, moving it away from expensive, proprietary hardware and into the browser.
Desmos and GeoGebra: The Gold Standard for Interactivity
Desmos has emerged as perhaps the most influential web-based graphing calculator in the tech space. Its engine is built on a high-performance JavaScript architecture that allows for fluid, real-time updates. One of its standout features is the “slider” functionality, which allows users to assign variables to constants and watch the graph morph as the values change. This provides an intuitive understanding of how different coefficients affect the shape and position of a function.
GeoGebra, on the other hand, leans more toward dynamic geometry. It integrates graphing with 3D modeling and spreadsheet capabilities. For those working in engineering or physical computing, GeoGebra’s ability to link algebraic equations with geometric shapes makes it an indispensable tool for prototyping mechanical movements or architectural structures.
AI-Powered Solvers and Recognition Software
The integration of Artificial Intelligence (AI) has introduced a new paradigm: “Visual Graphing.” Apps like Photomath and Microsoft Math Solver use computer vision and machine learning (ML) to recognize handwritten equations through a smartphone camera. Once the equation is digitized, the AI not only graphs the function but also provides a step-by-step breakdown of the derivation. This tech is powered by neural networks trained on millions of mathematical symbols, ensuring high accuracy even with varied handwriting styles.
Graphing in the Professional Tech Ecosystem: Python and Beyond

For developers and data professionals, manual input into a web calculator is often insufficient. Graphing equations must be integrated into automated workflows, data pipelines, and software products.
Matplotlib and Seaborn: The Data Science Powerhouses
In the world of Python programming, Matplotlib is the foundational library for graphing. It allows users to generate plots, histograms, power spectra, bar charts, and error charts with just a few lines of code. When graphing an equation in Python, a developer typically uses the NumPy library to create a range of values and then passes that range through a function to produce the plot.
Seaborn builds on top of Matplotlib, providing a high-level interface for drawing attractive and informative statistical graphics. These tools are critical for “Exploratory Data Analysis” (EDA), where graphing equations helps identify the mathematical models that best fit a specific dataset.
Visualizing Complex Equations with WolframAlpha
WolframAlpha stands in a category of its own as a “computational intelligence engine.” Unlike traditional search engines, it computes answers based on a massive internal library of algorithms and data. When you ask it to graph an equation, it doesn’t just draw a line; it provides the derivative, the integral, the Taylor series expansion, and the global minima/maxima. For tech professionals needing deep analytical insights, Wolfram’s Mathematica language offers the most robust environment for symbolic computation and high-fidelity graphing.
Advanced Techniques: 3D Modeling and Multivariate Equations
As we move into more complex tech domains like machine learning and 3D rendering, the standard 2D graph is often insufficient. Graphing multivariate equations—where $z$ is a function of both $x$ and $y$—requires three-dimensional visualization.
Surface Plotting and Heatmaps
In fields like AI, researchers often graph “loss functions” to visualize how an algorithm is learning. These are typically 3D surface plots where the “valleys” represent the points of lowest error. Digital tools like Plotly and MayaVi allow users to create interactive 3D graphs that can be rotated and inspected from any angle. This is essential for understanding “gradient descent,” a core concept in neural network training.
Vector Fields and Flow Visualization
For those working in fluid dynamics or electromagnetism, graphing equations often involves vector fields. Instead of a single line, the graph consists of a grid of arrows, each representing the magnitude and direction of a force at that point. Software like MATLAB is the industry standard for this type of high-level engineering visualization, offering specialized toolboxes for control systems and signal processing.
Best Practices for Precise Digital Graphing
To get the most out of modern graphing technology, one must follow certain technical best practices. Simply plugging in an equation is often not enough to gain a clear insight.
Managing Domain and Range Constraints
One of the most common mistakes in digital graphing is failing to set an appropriate “viewport.” If you are graphing a high-degree polynomial, the interesting behavior (roots, turns, and intercepts) might happen far outside the default -10 to 10 range. Modern software often includes an “auto-zoom” or “fit to data” feature, but a professional user should know how to manually adjust the domain and range to highlight the function’s most critical features, such as vertical asymptotes or points of inflection.
Interpreting Discontinuities and Singularities
Software can sometimes struggle with “undefined” points, such as where a denominator equals zero. High-quality graphing tools will represent these as “holes” or dashed lines (asymptotes). When using these tools for digital security or cryptography—where modular arithmetic and discrete functions are common—understanding how the software handles these breaks in the graph is vital for ensuring the mathematical model aligns with the real-world application.
Leveraging Cloud Collaboration
A significant trend in tech is the collaborative nature of digital graphing. Platforms like Google Colab allow multiple developers to work on the same graphing script simultaneously. By embedding interactive plots directly into a shared notebook, teams can communicate complex mathematical concepts more effectively than through static images. This “Living Document” approach is the future of technical documentation and collaborative research.
In conclusion, the question of “how do you graph an equation” has evolved into a multi-faceted technological process. From the simple sliders of a web app to the complex libraries of a Python environment, the tools at our disposal have transformed mathematics from a static exercise into a dynamic, interactive experience. By mastering these digital tools, we gain the power not just to see the lines on a screen, but to understand the fundamental laws that govern the data-driven world.
aViewFromTheCave is a participant in the Amazon Services LLC Associates Program, an affiliate advertising program designed to provide a means for sites to earn advertising fees by advertising and linking to Amazon.com. Amazon, the Amazon logo, AmazonSupply, and the AmazonSupply logo are trademarks of Amazon.com, Inc. or its affiliates. As an Amazon Associate we earn affiliate commissions from qualifying purchases.