
In the intricate world of finance, understanding growth is paramount. Whether you’re tracking the performance of your investment portfolio, evaluating your business’s revenue trajectory, or simply assessing a change in your personal income, the concept of “percent increase” serves as an indispensable tool. It provides a clear, standardized way to measure the magnitude of change relative to an initial value, offering insights far beyond mere absolute numbers. Without this metric, comparing different growth scenarios or truly grasping financial progress would be significantly more challenging.
This article will delve deep into the mechanics of calculating percent increase, demystifying the formula and illustrating its diverse applications across personal and business finance. We’ll explore why this metric is crucial for informed decision-making, highlight common pitfalls, and guide you through leveraging financial tools to make these calculations seamless. By the end, you’ll be equipped with the knowledge to confidently interpret and apply percent increase in your financial analyses, empowering you to make smarter, more strategic monetary choices.

Understanding the Fundamentals: What is Percent Increase?
At its core, percent increase quantifies the positive change between an initial value and a final value, expressed as a percentage of the initial value. It’s a relative measure, which is why it holds such power in financial analysis. An increase of $1,000 might seem significant, but its true impact depends entirely on whether the starting point was $10,000 or $1,000,000. Percent increase contextualizes this change, making comparisons meaningful.
Defining Percent Increase in a Financial Context
In finance, percent increase is used to gauge growth, appreciation, or improvement. For instance, if your stock investment grew from $100 to $120, that’s a $20 increase. But stating it as a 20% increase ($20 / $100) instantly tells you the rate of return, allowing you to compare it against other investments or market benchmarks. Similarly, a business might report a 15% increase in quarterly revenue, which is far more indicative of its performance than simply stating a raw dollar increase without context. This metric normalizes growth across different scales, making it invaluable for investors, business owners, and personal finance enthusiasts alike.
Why This Metric Matters for Your Money
The importance of percent increase cannot be overstated for several key reasons:
- Performance Evaluation: It allows for objective evaluation of investment returns, business growth, and even personal income progression.
- Benchmarking: You can compare your financial performance against industry averages, market indices, or personal goals. For example, did your portfolio outperform the S&P 500?
- Strategic Planning: Understanding growth rates helps in setting realistic financial goals, forecasting future values, and developing sound investment or business strategies.
- Inflation Adjustment: While not a direct inflation measure, knowing percent increases helps contextualize nominal growth against the eroding power of inflation.
- Budgeting and Forecasting: For businesses, projecting future revenue or cost increases is vital for budgeting. For individuals, understanding how income might grow helps in long-term financial planning.
The Core Formula: A Simple Breakdown
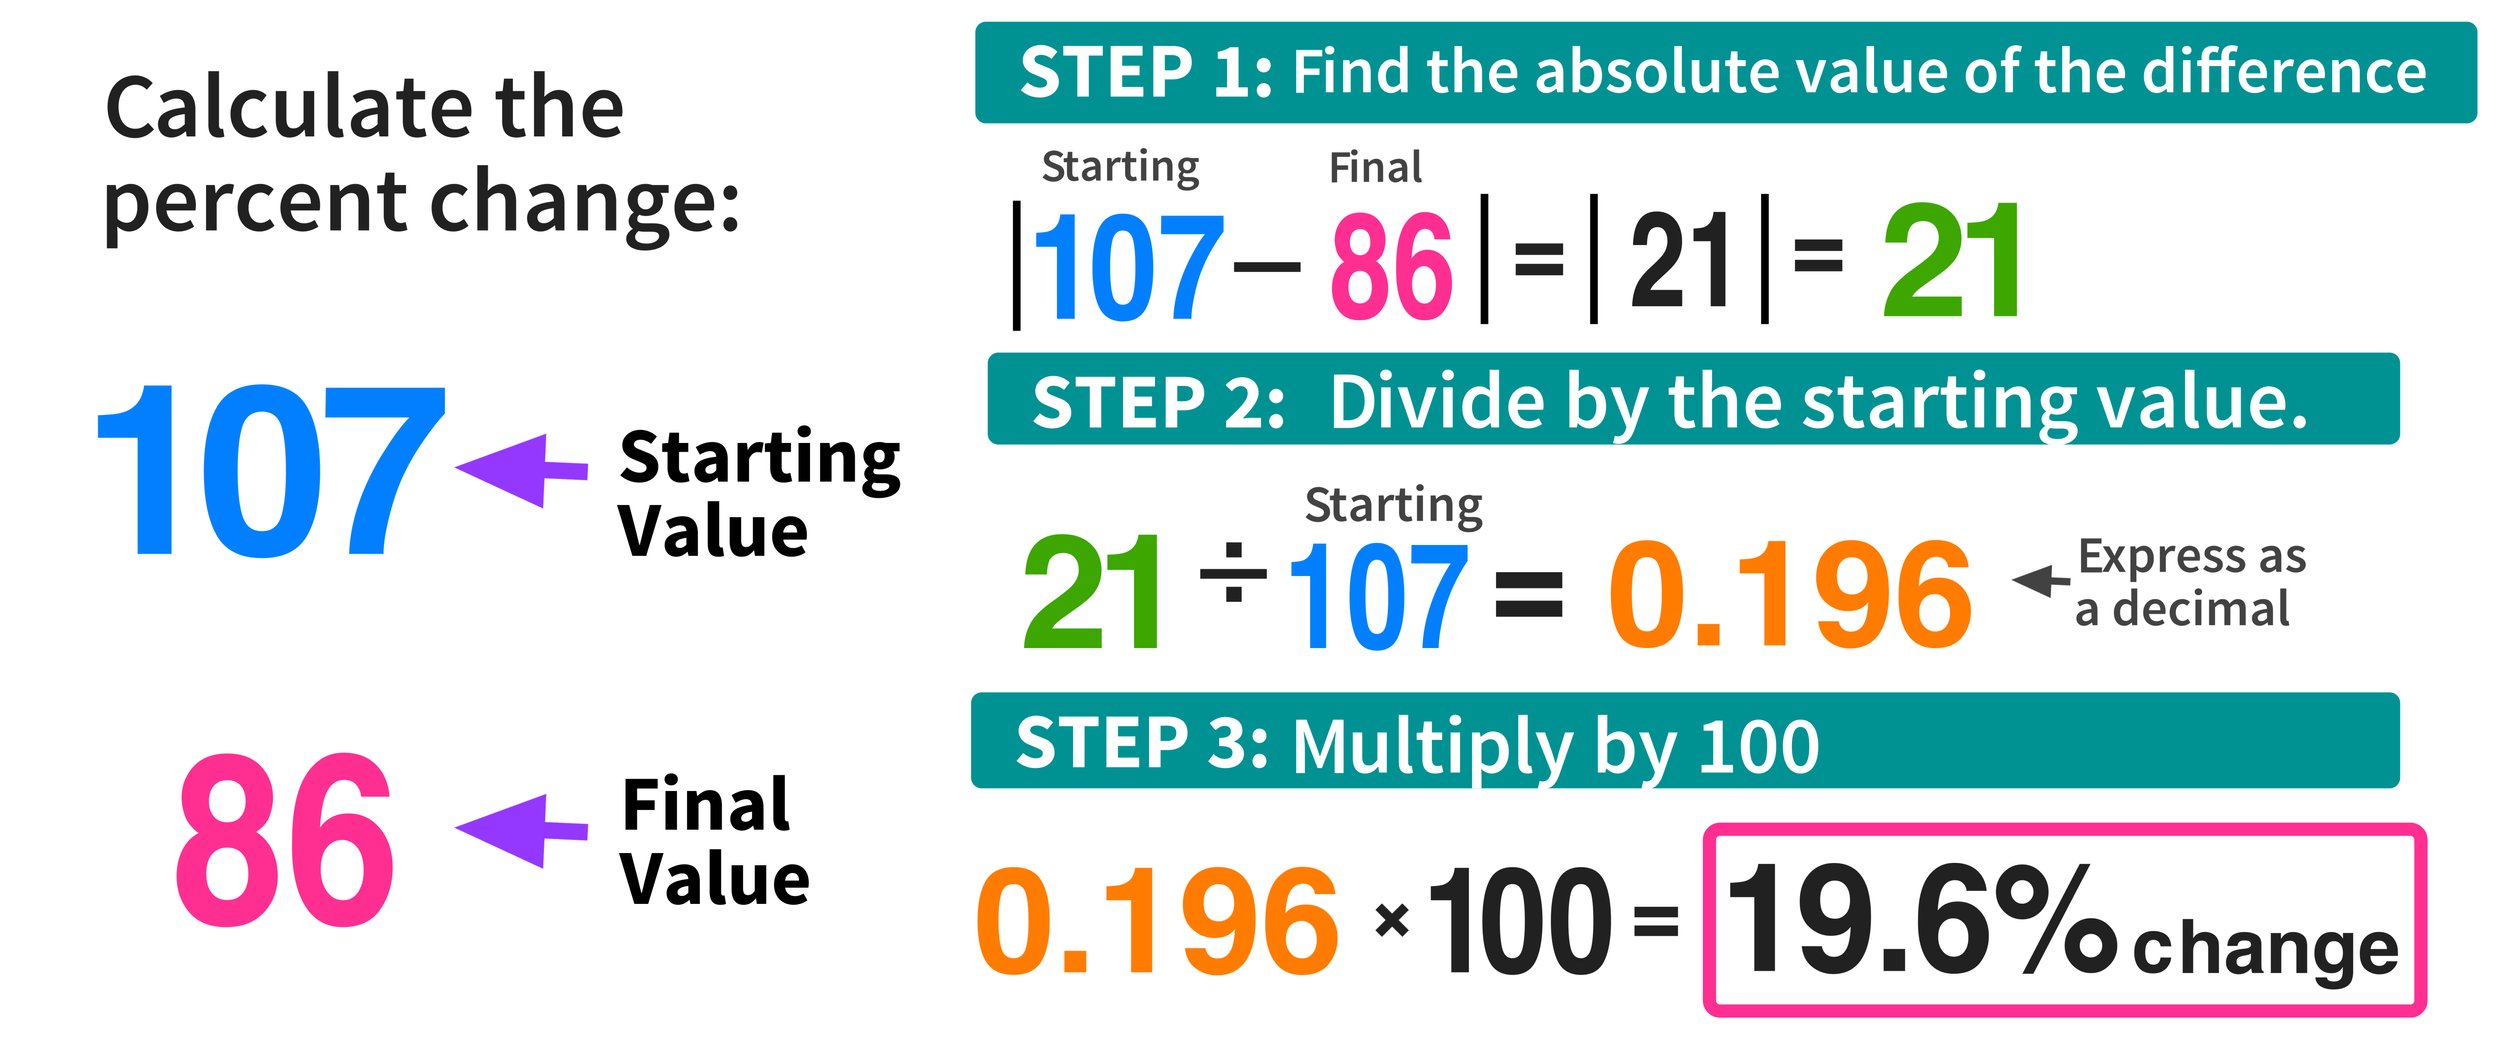
The calculation of percent increase is straightforward and relies on a simple three-step process embedded in a single formula.
The formula is:
$$ text{Percent Increase} = left( frac{text{Final Value} – text{Initial Value}}{text{Initial Value}} right) times 100 $$
Let’s break down the components:
- Initial Value: The starting point or original amount before the increase.
- Final Value: The ending amount after the increase has occurred.
- Difference (Final Value – Initial Value): This calculates the absolute amount of the increase.
- Division by Initial Value: This step normalizes the absolute increase by expressing it as a fraction of the original amount.
- Multiplication by 100: This converts the resulting decimal into a percentage.
Understanding these components is crucial, as they form the backbone of all percent increase calculations, regardless of the financial context.
Step-by-Step Calculation: From Theory to Practice
While the formula itself is concise, breaking down the calculation into sequential steps makes it easier to apply, especially for complex financial scenarios. This methodical approach ensures accuracy and clarity.
Identifying Your Starting and Ending Values
The very first and most critical step is to correctly identify the “Initial Value” (also known as the base value) and the “Final Value.” Misidentifying these can lead to incorrect results.
- Initial Value: This is the point from which you are measuring growth. For an investment, it might be your original principal. For a business, it could be last year’s revenue. For your salary, it’s your previous year’s earnings.
- Final Value: This is the value after the period of growth. It could be the current value of your investment, this year’s revenue, or your current salary.
Ensure both values pertain to the same item or category and are measured over a consistent period.
Calculating the Absolute Change (The Difference)
Once you have your initial and final values, the next step is to find the absolute difference between them. This is simply a subtraction:
$$ text{Absolute Change} = text{Final Value} – text{Initial Value} $$
If the final value is greater than the initial value, this result will be positive, indicating an increase. If the final value is less than the initial value, the result will be negative, indicating a decrease (which would then be calculated as a “percent decrease”). For percent increase, we are only concerned with positive absolute changes.
Converting to a Percentage: The Final Step
With the absolute change determined, the final step is to express this change as a percentage of the initial value.
- Divide the Absolute Change by the Initial Value:
$$ text{Ratio of Change} = frac{text{Absolute Change}}{text{Initial Value}} $$
This will give you a decimal number representing the proportional change. - Multiply by 100:
$$ text{Percent Increase} = text{Ratio of Change} times 100 $$
This converts the decimal ratio into a percentage.
Practical Example: Analyzing Investment Growth
Let’s say you invested $5,000 in a mutual fund on January 1st. By December 31st of the same year, the value of your investment had grown to $6,250. How do you calculate the percent increase?
-
Identify Values:
- Initial Value = $5,000
- Final Value = $6,250
-
Calculate Absolute Change:
- Absolute Change = $6,250 – $5,000 = $1,250
-
Convert to Percentage:
- Ratio of Change = $1,250 / $5,000 = 0.25
- Percent Increase = 0.25 × 100 = 25%
Your investment saw a 25% increase over the year. This figure is far more meaningful for comparing this investment’s performance against others than merely stating a $1,250 gain.
Real-World Applications Across Personal and Business Finance
The utility of percent increase extends across virtually every facet of financial management, from individual wealth building to corporate strategic planning. Its versatility makes it an indispensable tool for financial analysis.

Investment Portfolio Performance and Returns
For investors, percent increase is the bedrock of understanding portfolio performance. It’s used to:
- Calculate Individual Stock/Fund Gains: Track the growth of a single asset over a period.
- Measure Portfolio Returns: Assess the overall growth of your entire investment portfolio, often compared against market benchmarks like the S&P 500 or specific indices.
- Analyze Compound Annual Growth Rate (CAGR): For investments over multiple years, percent increase is a component in calculating CAGR, which provides a smoothed annual growth rate.
- Evaluate Real Returns: By comparing investment returns against the rate of inflation (which is also a percent increase), you can determine if your purchasing power has truly increased.
Tracking Salary Growth and Income Progression
On a personal finance level, percent increase is crucial for:
- Assessing Compensation Growth: Determine the percentage raise you received year-over-year, allowing you to compare it to inflation or industry averages.
- Projecting Future Earnings: Understand your typical income growth rate to make more accurate long-term financial plans, such as retirement planning or saving for a down payment.
- Evaluating Career Progress: A consistent percent increase in salary often indicates career advancement and increased market value.
Business Revenue and Profitability Analysis
For businesses, percent increase is a core metric for operational and strategic analysis:
- Revenue Growth: Track the percentage increase in sales revenue quarter-over-quarter or year-over-year to gauge market penetration and product success.
- Profit Margin Improvement: Analyze the percentage increase in net profit or gross profit margins, indicating efficiency gains or pricing power.
- Customer Acquisition/Retention: Measure the percentage increase in customer base or retention rates, crucial for marketing and sales strategy.
- Operational Efficiency: Evaluate percent increases in production output, reduction in waste, or other efficiency metrics.
Evaluating Cost Increases and Budgeting
Percent increase isn’t just for positive growth; it’s equally vital for understanding negative changes like cost increases:
- Expense Analysis: Identify percentage increases in operational costs, raw material prices, or utility bills, which are critical for budget management.
- Inflationary Impact: Understand how the cost of living or specific goods/services has increased over time, directly impacting personal and business budgets.
- Budget Deviation: Compare actual expenses to budgeted amounts as a percent increase/decrease to identify areas needing adjustment.
Understanding Inflation and Purchasing Power
Inflation, at its heart, is a percent increase in the general price level of goods and services in an economy over a period. Central banks and economists track this percent increase meticulously. For individuals and businesses:
- Real vs. Nominal Returns: Knowing the inflation rate (percent increase in prices) allows you to adjust your nominal investment returns to calculate your “real” returns, revealing whether your purchasing power has actually grown.
- Cost of Living Adjustments: Percent increase informs discussions around salary raises and pension adjustments, ensuring income keeps pace with the rising cost of living.
Common Pitfalls and Nuances to Consider
While the calculation of percent increase is relatively simple, its interpretation and application can be fraught with subtle complexities. Being aware of these nuances is essential for accurate financial analysis.
Dealing with Zero or Negative Starting Values
The standard percent increase formula requires a non-zero initial value in the denominator.
- Zero Initial Value: If your initial value is zero (e.g., you had no income last year, and now you have some), calculating a percent increase is mathematically undefined. In such cases, it’s more appropriate to report the absolute change or state that growth occurred from zero.
- Negative Initial Value: If your initial value is negative (e.g., a business loss that turned into a smaller loss, or a loss that turned into a profit), the interpretation of percent change becomes tricky and can be misleading. A standard percent increase calculation from a negative number might yield a positive percentage even if the situation improved, but it might not be intuitive. In these scenarios, often focusing on the absolute change or using different financial ratios is more effective.
The Impact of Compounding Over Time
For multi-period financial analyses, especially with investments, the concept of compounding becomes critical. A 10% increase year-over-year for five years does not mean a 50% overall increase (10% x 5). Instead, it’s a compounding effect.
- Example: $100 growing at 10% annually.
- Year 1: $100 * 1.10 = $110 (10% increase)
- Year 2: $110 * 1.10 = $121 (another 10% increase from the new base)
- Total increase over two years = ($121 – $100) / $100 = 21%, not 20%.
This is why metrics like Compound Annual Growth Rate (CAGR) are used for multi-period growth to provide an annualized, smoothed rate.
Distinguishing from Absolute Change vs. Percentage Points
It’s crucial not to confuse a “percent increase” with a change in “percentage points.”
- Example: If an interest rate increases from 5% to 7%.
- Percent Increase: (7% – 5%) / 5% = 2% / 5% = 0.40 = 40% increase. The rate itself increased by 40%.
- Percentage Point Increase: 7% – 5% = 2 percentage points.
These are two very different statements with distinct implications. Misusing them can lead to significant misinterpretations, especially in financial reporting and economic discussions.
Context is King: Interpreting the Numbers
A raw percent increase figure, while mathematically correct, is often meaningless without context.
- Market Conditions: A 5% increase in a market where the average is 20% might indicate underperformance. A 5% increase during a severe recession might be exceptional.
- Time Horizon: A 10% increase over one month is very different from a 10% increase over 10 years. Annualizing or comparing over consistent periods is vital.
- Scale: A 100% increase on a $10 investment ($10 profit) is less significant than a 10% increase on a $1,000,000 investment ($100,000 profit). While the percentage might seem less impressive, the absolute financial gain is vastly different.
Always consider the surrounding circumstances, the relevant benchmarks, and the time frame when interpreting percent increase figures.
Leveraging Financial Tools for Seamless Calculations
While manual calculation of percent increase is straightforward for a few data points, financial tools greatly enhance efficiency and accuracy, especially when dealing with large datasets or complex models.
Spreadsheet Software (Excel, Google Sheets)
Spreadsheets are arguably the most ubiquitous and powerful tools for calculating percent increase. Their formula capabilities make the process intuitive:
- Basic Calculation: If your Initial Value is in cell A1 and Final Value in B1, the formula
= (B1-A1)/A1 * 100will give you the percent increase. - Handling Multiple Data Points: You can easily drag this formula across rows or columns to calculate percent increase for dozens or hundreds of data points simultaneously, such as tracking monthly revenue growth or comparing stock performance over various periods.
- Conditional Formatting: Use conditional formatting to highlight positive (green) or negative (red) percent changes, providing quick visual insights.
- Charting: Generate charts (bar, line graphs) from your percent increase data to visualize trends and growth patterns over time, which is invaluable for presentations and reports.
Online Calculators and Financial Apps
For quick, one-off calculations or when you don’t have a spreadsheet handy, numerous online calculators and financial apps are readily available:
- Dedicated Percentage Calculators: Many websites offer simple tools where you input the initial and final values, and they instantly provide the percent increase (or decrease).
- Investment Apps: Many brokerage apps or personal finance trackers automatically calculate the percent increase of your portfolio or individual holdings, often displaying it prominently.
- Business Intelligence Dashboards: Modern BI tools integrated with accounting software often present key performance indicators (KPIs) like revenue growth or profit margin increases as percentages, automatically calculated from underlying data.
These tools are excellent for convenience and offer instant feedback, although they may lack the customizability and analytical depth of spreadsheet software.
Programming for Advanced Financial Modeling
For finance professionals, quantitative analysts, or data scientists involved in advanced financial modeling, programming languages like Python or R offer unparalleled flexibility and power for calculating and analyzing percent increases within larger datasets and complex algorithms.
- Python (Pandas Library): Python, with its powerful Pandas library, can handle vast financial datasets. You can write scripts to calculate percent change across multiple time series, perform rolling growth calculations, or integrate these metrics into predictive models.
- R: Similar to Python, R is heavily used in statistical analysis and finance. It provides robust functions for time-series analysis and calculating rates of change, often used for economic forecasting and risk modeling.
While this approach requires programming knowledge, it allows for automation, complex scenario analysis, and the integration of percent increase calculations into sophisticated financial systems.
Empowering Your Financial Decisions with Percent Increase
Understanding “how do you calculate percent increase” is far more than a mere mathematical exercise; it’s a critical skill that underpins sound financial decision-making. From the individual investor meticulously tracking portfolio gains to the business executive scrutinizing quarterly growth, this metric provides the lens through which progress, performance, and potential are accurately assessed.
By mastering the simple formula, recognizing its diverse applications across personal and business finance, and being mindful of its nuances, you gain a powerful analytical tool. Whether you’re planning your retirement, evaluating a new business venture, or simply ensuring your salary keeps pace with inflation, the ability to calculate and interpret percent increase empowers you to move beyond raw numbers. It allows you to contextualize financial changes, benchmark against targets, and ultimately, make more informed, strategic choices that foster lasting financial health and growth. Embrace this fundamental metric, and transform your approach to managing money.
aViewFromTheCave is a participant in the Amazon Services LLC Associates Program, an affiliate advertising program designed to provide a means for sites to earn advertising fees by advertising and linking to Amazon.com. Amazon, the Amazon logo, AmazonSupply, and the AmazonSupply logo are trademarks of Amazon.com, Inc. or its affiliates. As an Amazon Associate we earn affiliate commissions from qualifying purchases.