
The question “how many stocks are there?” appears deceptively simple, yet it unlocks a profound understanding of the global financial ecosystem. It’s a query that delves into the very fabric of capital markets, revealing a dynamic, intricate, and ever-evolving landscape. For anyone venturing into the world of investing, grasping the sheer scale and complexity of available equities is the first step towards informed decision-making. There isn’t a single, static number, but rather a constantly shifting multitude, influenced by economic cycles, regulatory environments, technological advancements, and the relentless march of human innovation and enterprise. This article will unravel the complexities behind this question, exploring the definitions, marketplaces, categories, and forces that shape the vast universe of stocks, all while maintaining a sharp focus on its implications for the astute investor.
The Elusive Count: Why a Simple Number Doesn’t Exist
To attempt to put a definitive number on “how many stocks are there” is akin to trying to count the stars in the sky – an impossible task given their vastness and the dynamic nature of their existence. The number is not only immense but also constantly in flux, changing by the minute as companies emerge, merge, delist, or go private. Understanding this dynamism is crucial for any investor.
Defining “A Stock”: Beyond the Common Perception
At its core, a stock (or share) represents a fractional ownership in a company. When you buy a stock, you become a part-owner of that business, entitling you to a claim on its assets and earnings. This simple definition, however, broadens significantly when considering the various forms stocks can take. It’s not just about common shares traded on major exchanges; it also encompasses preferred shares, different share classes with varying voting rights, and even shares in privately held companies that aren’t available to the general public. For the purpose of answering “how many stocks are there” from an investor’s perspective, we primarily focus on publicly traded equities, which are accessible through brokerage accounts. Even within this narrower scope, the diversity is staggering.
The Dynamic Nature of Public Listings
The number of publicly traded companies is in a state of perpetual motion. Each year, thousands of new companies go public through Initial Public Offerings (IPOs) or Direct Listings, adding to the total count. Simultaneously, existing companies are acquired, merge with others, or are delisted from exchanges due either to bankruptcy, a decision to go private, or failure to meet listing requirements. This ebb and flow means that any exact count becomes outdated almost as soon as it’s tallied. Financial data providers and exchanges offer snapshots, but these are merely momentary glimpses into a rapidly changing landscape. For instance, the number of companies listed on the NASDAQ or NYSE can fluctuate daily, highlighting the futility of seeking a fixed figure.
Public vs. Private Markets: A Crucial Distinction
A significant portion of the “total” companies in existence are privately held. These businesses do not offer their shares to the public on stock exchanges. Their ownership might be concentrated among founders, employees, venture capitalists, or private equity firms. While these private companies represent a massive economic force and an enormous number of potential “stocks,” they are not accessible to the average retail investor. The question of “how many stocks are there” typically refers to publicly traded stocks – those that individuals can buy and sell on regulated exchanges. The distinction is critical, as it defines the universe of investable assets for most people and significantly reduces the “total” number when compared to all businesses globally.
A Global Tapestry: Key Exchanges and Their Offerings
The global equity market is a decentralized network of numerous stock exchanges, each serving as a vital marketplace for companies to raise capital and for investors to trade ownership shares. Understanding these various exchanges is essential to appreciating the sheer volume and geographical distribution of available stocks.
Major Global Players: NYSE, NASDAQ, LSE, TSE, SSE
The vast majority of the world’s market capitalization and trading volume is concentrated on a handful of major global stock exchanges. In the United States, the New York Stock Exchange (NYSE) and the NASDAQ are titans, listing thousands of companies ranging from venerable industrial giants to cutting-edge technology firms. The NYSE, known for its auction market model, hosts many of the world’s largest companies by market cap, while the NASDAQ, an electronic exchange, is a hub for tech and growth-oriented companies.
Beyond the U.S., other significant exchanges contribute massively to the global count:
- London Stock Exchange (LSE): A historic financial center, listing companies from the UK and around the world.
- Tokyo Stock Exchange (TSE): The largest exchange in Asia, home to many Japanese multinational corporations.
- Shanghai Stock Exchange (SSE) and Shenzhen Stock Exchange (SZSE): Dominant players in mainland China, representing a rapidly growing segment of the global market.
- Euronext: A pan-European exchange operating markets in Amsterdam, Brussels, Dublin, Lisbon, Oslo, and Paris.
- Hong Kong Stock Exchange (HKEX): A gateway to China and a significant listing venue for Asian companies.
Each of these exchanges, along with many others, lists thousands of unique companies, contributing to a combined global count that easily stretches into the tens of thousands, if not more, when considering primary and secondary listings.
Regional Exchanges and Emerging Markets
While the major exchanges capture the lion’s share of attention and volume, a plethora of regional and country-specific exchanges around the world significantly bolster the total number of available stocks. Exchanges in Canada (TSX), Australia (ASX), India (BSE, NSE), Brazil (B3), South Korea (KRX), and various countries across Africa, Latin America, and Southeast Asia play crucial roles in their respective economies. These exchanges often provide opportunities for investors to gain exposure to specific regional growth stories or local champions that may not be listed on the larger, more internationally focused bourses. Investing in emerging markets, while carrying higher risk, can offer diversification and access to rapidly developing economies. The sheer number of companies listed across these diverse markets underscores the expansive nature of the global equity landscape.
The Role of Indices in Measuring Market Breadth
Given the impossibility of counting every single stock, financial indices serve as invaluable tools for gauging the breadth and performance of specific segments of the market. Indices like the S&P 500 (which tracks 500 large U.S. companies), the Dow Jones Industrial Average (30 large U.S. companies), the FTSE 100 (100 largest UK companies), or the Nikkei 225 (225 large Japanese companies) provide a curated snapshot. While these indices represent only a fraction of the total listed stocks, they offer insight into the general health and direction of particular markets. Broad market indices, such as the Russell 3000 (representing approximately 3,000 U.S. companies across all market caps) or global indices like the MSCI All Country World Index (ACWI), give a more comprehensive view of the investable universe, approximating the “total” number of public stocks relevant to a global investor.
Deconstructing the “Stock”: Categories and Characteristics
Beyond the sheer volume and location, stocks are not a monolithic asset class. They come with distinct characteristics and categories that significantly influence their investment profile, risk level, and potential returns. Understanding these classifications is vital for constructing a diversified and strategically aligned portfolio.
Common vs. Preferred Stocks: Understanding Shareholder Rights
The most widely traded type of stock is common stock. Common shareholders have voting rights, allowing them to elect the board of directors and vote on corporate policies. They also have a residual claim on the company’s assets and earnings, meaning they are paid after bondholders and preferred shareholders in the event of liquidation. The value of common stock is directly tied to the company’s performance and market sentiment, offering significant upside potential but also higher risk.
Preferred stock, on the other hand, typically carries no voting rights. However, preferred shareholders usually receive fixed dividend payments before common shareholders and have a higher claim on assets in case of bankruptcy. They often behave more like bonds, offering less volatility and more predictable income, but with less potential for capital appreciation compared to common stock. While a company generally issues fewer preferred shares than common shares, they add another layer to the “count” of distinct equity securities available.
Market Capitalization: Small-Cap, Mid-Cap, Large-Cap
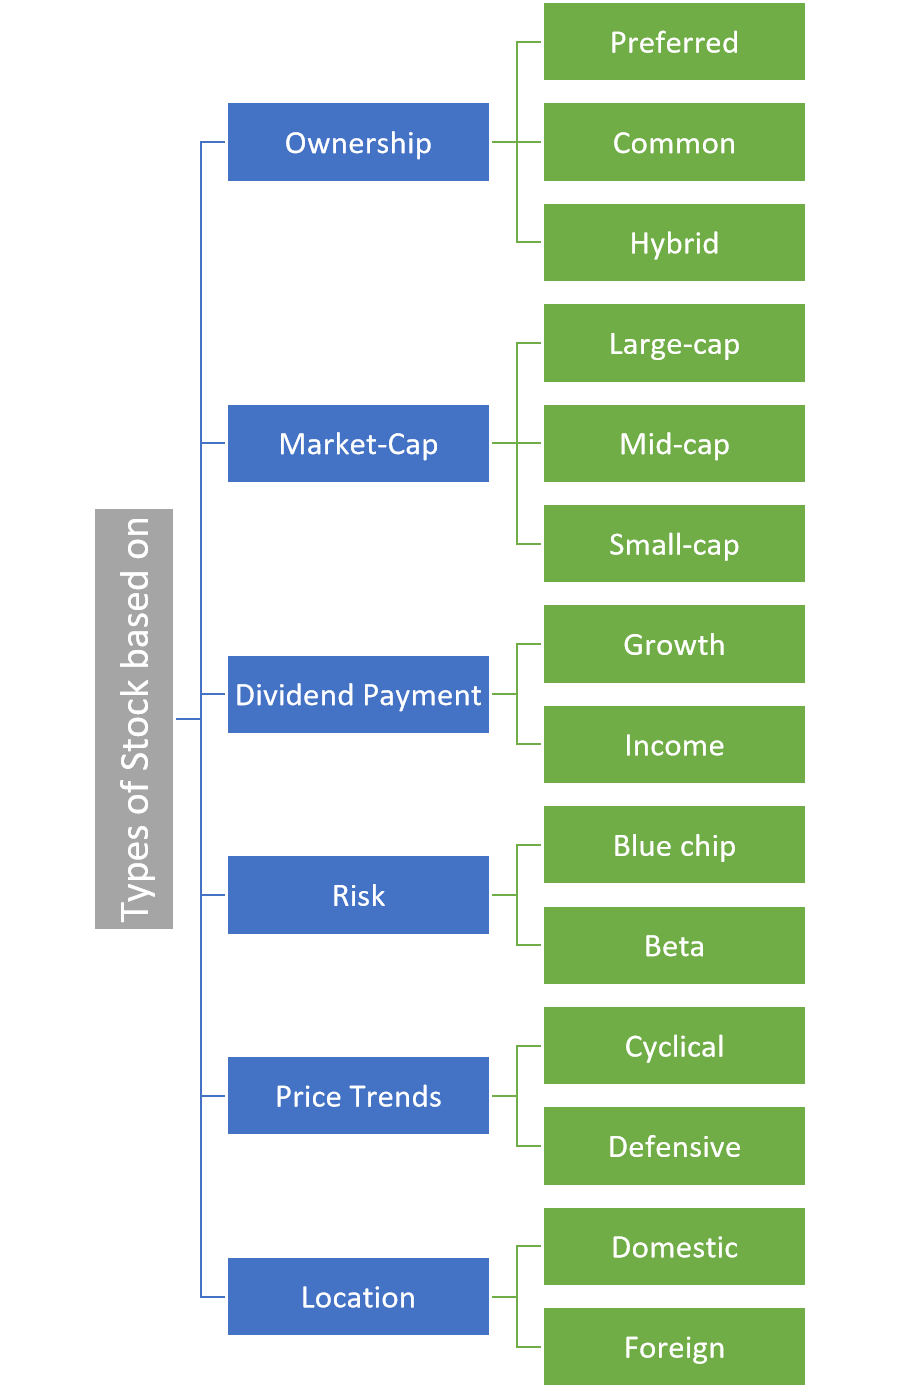
Stocks are often categorized by market capitalization, which is the total value of a company’s outstanding shares (share price multiplied by the number of shares). This metric provides a quick way to gauge a company’s size and maturity.
- Large-cap stocks (typically companies with market caps over $10 billion, though this can vary) are generally well-established, stable companies with a long track record. They are often seen as less volatile and may pay regular dividends. Examples include Apple, Microsoft, and Johnson & Johnson.
- Mid-cap stocks (generally between $2 billion and $10 billion) represent companies that are past their initial growth phase but still have significant potential for expansion. They often offer a balance between growth and stability.
- Small-cap stocks (typically under $2 billion) are newer or smaller companies with high growth potential but also higher risk and volatility. They can offer explosive returns if successful but are more susceptible to market downturns and business failures.
This categorization significantly diversifies the investment landscape, offering different risk-reward profiles that investors can leverage based on their goals and risk tolerance.
Growth vs. Value Stocks: Different Investment Philosophies
Beyond size, stocks are also often classified by their investment style:
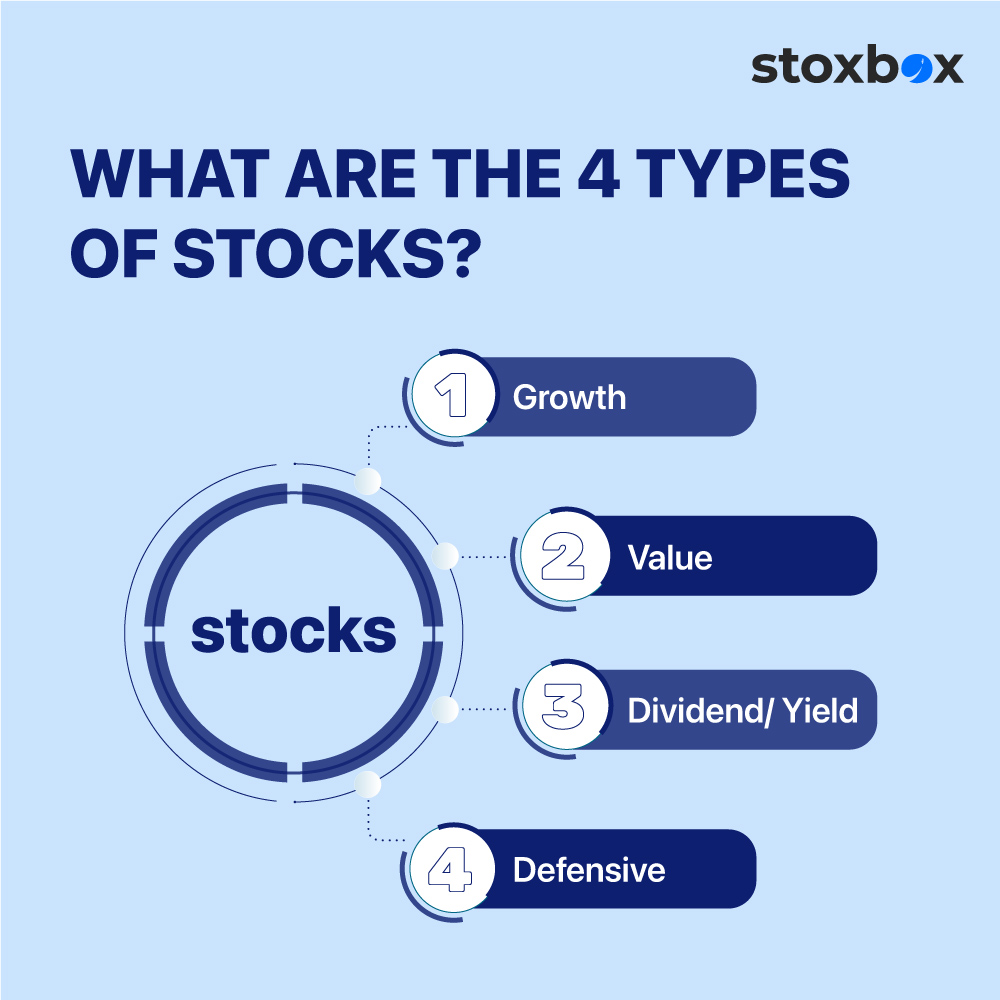
- Growth stocks are shares in companies that are expected to grow earnings and revenue at an above-average rate compared to their industry or the overall market. These companies often reinvest profits back into the business for expansion, rather than paying dividends. Investors are willing to pay a premium for their future potential, making them often more volatile. Examples include many tech companies or innovative startups.
- Value stocks are shares in companies that are considered to be undervalued by the market. They often trade at lower prices relative to their fundamentals (earnings, dividends, assets) and may belong to mature industries. Value investors seek to identify these overlooked gems, believing their market price will eventually reflect their intrinsic worth. They often pay dividends and are typically less volatile than growth stocks.
These two styles represent fundamental approaches to equity investing, each with its proponents and historical periods of outperformance.
Sectoral Diversity: A World of Industries
The economic landscape is segmented into various industries or sectors, and stocks are classified accordingly. From technology and healthcare to financials, consumer staples, energy, industrials, and utilities, each sector has its own dynamics, growth drivers, and sensitivities to economic cycles. For instance, technology stocks might thrive during periods of innovation, while utility stocks are often seen as defensive during downturns. The diversification across sectors is a critical strategy for managing risk, as different sectors perform differently under varying economic conditions. The sheer number of companies across this broad spectrum of industries further illustrates the vast and multi-faceted nature of the equity market.
The Constant Flux: What Drives the Numbers Up and Down?
The number of stocks available for investment is not static; it’s a dynamic figure that continuously changes due to a range of corporate actions and market forces. Understanding these drivers helps to contextualize the “how many stocks are there” question as a moving target, rather than a fixed count.
Initial Public Offerings (IPOs) and Direct Listings
The most common way for new companies to enter the public market and increase the number of available stocks is through an Initial Public Offering (IPO). In an IPO, a private company sells its shares to the public for the first time, raising capital for expansion, debt repayment, or other corporate purposes. IPOs are often highly anticipated events, bringing exciting new opportunities to investors. Similarly, a Direct Listing is an alternative method where a company lists its existing shares on an exchange without raising new capital or involving traditional underwriters, also adding to the public stock count. The volume of IPOs and direct listings can fluctuate significantly based on market sentiment, economic conditions, and investor appetite for risk, directly impacting the overall number of public companies. A robust economy with strong investor confidence typically sees a higher volume of new listings.
Mergers, Acquisitions, and Delistings
Just as new companies join the public markets, existing ones leave through various means.
- Mergers and Acquisitions (M&A): When two companies merge, or one company acquires another, the shares of one of the companies (or sometimes both, if a new entity is formed) typically cease to trade independently. This reduces the total number of distinct publicly traded stocks. M&A activity is a consistent feature of corporate strategy, driven by consolidation, synergy seeking, and market dominance.
- Delistings: Companies can be delisted from an exchange for several reasons. They might go private, where all outstanding shares are bought back by a smaller group of investors, removing them from public trading. Alternatively, a company might fail to meet the exchange’s listing requirements, such as minimum share price, market capitalization, or reporting standards, leading to involuntary delisting. Bankruptcy also results in a delisting, as the shares become worthless. Each delisting, for whatever reason, subtracts from the overall count of available stocks.
Global Economic Shifts and Regulatory Impacts
Broader economic and regulatory environments also play a significant role in shaping the number of public stocks. During periods of economic expansion, there tends to be more capital available and greater optimism, leading to more companies seeking to go public. Conversely, recessions or periods of market uncertainty can deter IPOs and accelerate delistings or acquisitions as companies struggle or consolidate.
Regulatory changes can also impact the landscape. Stricter reporting requirements or increased compliance costs might discourage smaller companies from remaining public or opting to go public in the first place. Conversely, deregulation or incentives for small businesses could encourage more listings. Geopolitical events and cross-border investment treaties can also influence the flow of capital and the decision of companies to list on foreign exchanges, indirectly affecting the global count and accessibility of stocks. The interplay of these forces ensures that the number of stocks available to investors is perpetually dynamic and subject to broader macroeconomic trends.
Implications for the Investor: Opportunity and Complexity
The vast number of stocks, coupled with their diverse characteristics and the dynamic nature of the market, presents both unparalleled opportunities and significant challenges for the individual investor. Navigating this immense universe requires a thoughtful approach, diligent research, and a clear understanding of personal financial goals.
The Paradox of Choice: Finding Your Investment Niche
The sheer volume of available stocks can lead to what is known as the “paradox of choice.” With tens of thousands of publicly traded companies across dozens of exchanges and countless sectors, identifying the “right” investments can feel overwhelming. This abundance means that investors must develop a clear investment strategy. Are you a long-term growth investor, seeking innovative companies with disruptive potential? Are you a value investor, looking for established companies trading below their intrinsic worth? Or perhaps an income-focused investor, prioritizing dividend-paying stocks? Defining your investment philosophy helps narrow down the choices from an unmanageable ocean to a more focused pool, allowing for more targeted research and decision-making. Without a defined niche or strategy, the investor risks becoming paralyzed by the options or, worse, making impulsive decisions based on fleeting market trends.
Diversification in a Sea of Options
The immense number of stocks is, in fact, a blessing when it comes to risk management through diversification. Diversification involves spreading your investments across various assets, industries, and geographies to reduce overall portfolio risk. If you invest in only one or two stocks, your portfolio’s performance is heavily dependent on the fate of those specific companies. However, by investing in a diversified portfolio across different sectors (e.g., technology, healthcare, financials), different market capitalizations (e.g., small-cap, large-cap), and even different countries, you mitigate the impact of any single stock or sector underperforming. The vast number of stocks allows for sophisticated diversification strategies, enabling investors to build robust portfolios that can weather various economic conditions and minimize idiosyncratic risks. Exchange-Traded Funds (ETFs) and mutual funds, which hold baskets of stocks, are popular tools for achieving broad diversification efficiently.
Research and Due Diligence: Navigating the Information Overload
With so many companies listed, each with its own financials, business model, management team, and competitive landscape, the task of conducting thorough research (due diligence) is monumental. Investors are bombarded with information from financial news, company reports, analyst ratings, and social media. The challenge isn’t a lack of information, but rather an overload, and the need to sift through it to identify credible, relevant data.
Effective research involves:
- Understanding Financial Statements: Analyzing income statements, balance sheets, and cash flow statements to assess a company’s financial health.
- Evaluating Business Models: Grasping how a company generates revenue, its competitive advantages, and its future growth prospects.
- Assessing Management: Researching the leadership team’s experience, track record, and alignment with shareholder interests.
- Monitoring Industry Trends: Staying abreast of developments within the company’s sector that could impact its performance.
- Considering Macroeconomic Factors: Understanding how broader economic trends, interest rates, and geopolitical events might affect an investment.
The sheer volume of stocks means that detailed analysis for every potential investment is impractical for most individual investors. This often leads to a focus on well-known companies, sectors of interest, or leveraging professional research and financial advisors. However, the opportunity for diligent investors to uncover undervalued gems among the thousands of less-covered stocks remains a compelling aspect of the market’s vastness.
In conclusion, the question “how many stocks are there?” reveals a truly global and complex financial landscape. While a precise, static number is unattainable, the reality is that tens of thousands of distinct publicly traded stocks exist across various exchanges worldwide, constantly changing due to corporate actions and economic forces. This immense universe offers unparalleled opportunities for wealth creation through diversification and strategic investment, but it also demands a disciplined approach to research and a clear understanding of one’s investment goals to navigate its inherent complexities successfully.
aViewFromTheCave is a participant in the Amazon Services LLC Associates Program, an affiliate advertising program designed to provide a means for sites to earn advertising fees by advertising and linking to Amazon.com. Amazon, the Amazon logo, AmazonSupply, and the AmazonSupply logo are trademarks of Amazon.com, Inc. or its affiliates. As an Amazon Associate we earn affiliate commissions from qualifying purchases.