
For anyone serious about long-term wealth building, understanding the historical performance of the stock market is paramount. A 30-year investment horizon is often cited as the gold standard for patient investors, providing ample time for capital to compound and for market volatility to smooth out. The question, “what is the average stock market return over 30 years,” isn’t just an academic exercise; it’s a foundational inquiry for retirement planning, financial independence, and intergenerational wealth transfer. This article delves into the historical data, explores the nuances of “average,” and provides insights into harnessing the market’s long-term potential.
Understanding Historical Stock Market Performance
To answer the core question, we must first establish a benchmark and understand how these returns are calculated and affected by various economic factors. The stock market, particularly the U.S. market, has demonstrated remarkable resilience and growth over extended periods, making it a powerful engine for wealth creation.
The S&P 500 as a Benchmark
When discussing broad stock market returns in the United States, the S&P 500 Index is almost universally adopted as the primary benchmark. This index comprises 500 of the largest publicly traded companies in the U.S., representing approximately 80% of the total U.S. equity market capitalization. Its widespread acceptance stems from its broad representation across various sectors of the U.S. economy, making it an excellent proxy for the overall health and performance of corporate America.
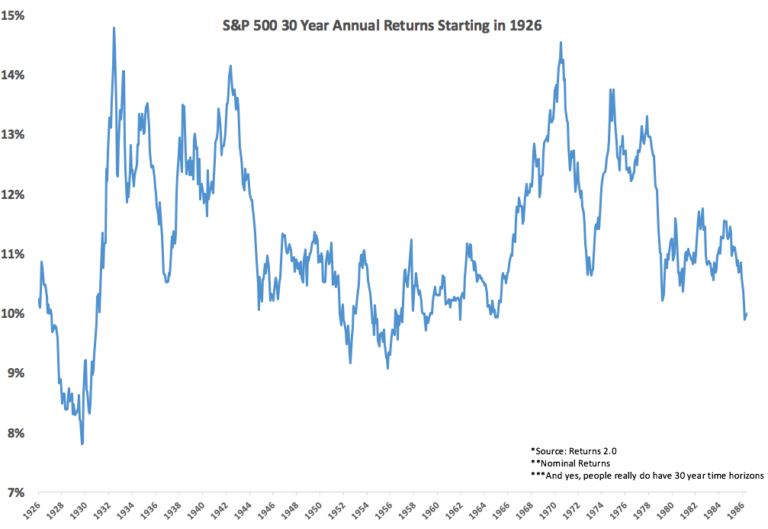
Historically, the nominal average annual return of the S&P 500, including reinvested dividends, has been approximately 10% to 12% per year over very long periods, such as 30 years or more. This figure is frequently cited and reflects the growth in stock prices combined with the income generated from dividends, which are then reinvested to buy more shares. It’s crucial to remember that this is an average; individual 30-year periods can and do vary significantly. For instance, a 30-year period ending in a bull market will show higher returns than one ending during a significant downturn, though the latter is less common given the market’s long-term upward bias.
Dissecting the “Average”: Arithmetic vs. Geometric Returns
The term “average” itself requires careful consideration in the context of investment returns. There are two primary ways to calculate average returns, each providing a different perspective:
- Arithmetic Average Return: This is the simple average of a series of annual returns. If an investment yields +20% one year and -10% the next, the arithmetic average is (20% + (-10%)) / 2 = 5%. While easy to calculate, it doesn’t accurately reflect the compound growth of an investment over time because it doesn’t account for the impact of gains or losses on the actual capital base.
- Geometric Average Return (Compound Annual Growth Rate – CAGR): This is the more appropriate measure for evaluating investment performance over multiple periods, as it shows the actual annual rate at which an investment has grown. Using the previous example, if you start with $100, a +20% return brings you to $120. A subsequent -10% return on $120 brings you to $108. The geometric average return would be calculated as (($108/$100)^(1/2)) – 1 = 3.92%. This figure accurately reflects that your money grew by 3.92% per year, on average, over the two years. For long-term performance like 30 years, the geometric average (or CAGR) is the more insightful metric. The 10-12% figure typically refers to the geometric average.
The Impact of Inflation: Nominal vs. Real Returns
Another critical distinction is between nominal and real returns:
- Nominal Returns: These are the returns you see stated on your account statements – the raw percentage growth of your investment. The 10-12% figure mentioned earlier is a nominal return.
- Real Returns: These returns adjust for inflation, revealing the true purchasing power gained from your investment. If your investment earns 10% in a year, but inflation is 3%, your real return is approximately 7%. Over a 30-year period, cumulative inflation can significantly erode the purchasing power of nominal gains.
Historically, the average annual inflation rate in the U.S. has been around 2-3%. Therefore, when considering a 30-year horizon, investors often look at a real average annual return for the S&P 500 in the range of 7-8%. This “real” figure is often more important for retirement planning, as it directly relates to your ability to maintain or improve your lifestyle in the future.
The Power of Long-Term Investing: Why 30 Years Matters
A 30-year investment horizon transforms the stock market from a seemingly unpredictable casino into a powerful, relatively reliable wealth-building machine. This extended timeframe mitigates many of the short-term risks and amplifies the core mechanisms of market growth.
Compounding: The Investor’s Best Friend
Albert Einstein is often attributed with calling compound interest “the eighth wonder of the world.” For long-term investors, compounding is precisely why a 30-year horizon is so potent. Compounding means earning returns not only on your initial investment but also on the accumulated returns from previous periods. Over shorter periods, the effect is noticeable; over 30 years, it’s transformational.
Consider a simple example: An initial investment of $10,000 earning a geometric average of 8% annually.
- After 10 years: $21,589
- After 20 years: $46,610
- After 30 years: $100,627
The growth in the later years far outstrips that in the early years, demonstrating the exponential nature of compounding. This illustrates why starting early and maintaining a long investment horizon are key tenets of successful financial planning.
Mitigating Volatility Through Time
The stock market is inherently volatile in the short term, characterized by daily, weekly, and even yearly fluctuations that can be unsettling. However, over a 30-year period, this short-term noise tends to average out. Major market downturns that might cause panic over a few months or a year become mere dips in a much longer, generally upward trend when viewed on a 30-year chart.
Research consistently shows that as the investment horizon lengthens, the probability of negative real returns in the S&P 500 significantly decreases. While a single year might see a 20% or 30% decline, it’s exceptionally rare for a 30-year period to result in a loss of purchasing power for a diversified stock investor. This long-term perspective allows investors to ride out the inevitable ups and downs without reacting emotionally to temporary setbacks.
Riding Out Market Cycles and Crashes
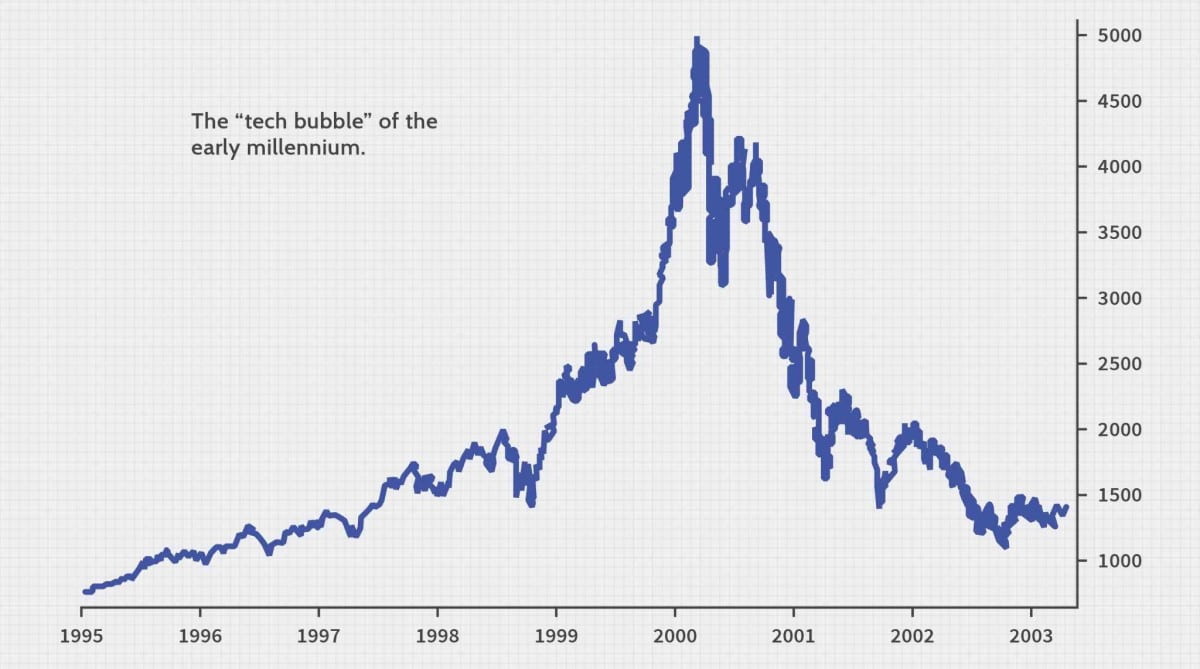
History is replete with examples of market crashes and bear markets – the Great Depression, the Dot-Com Bust, the 2008 Financial Crisis, and the COVID-19 crash. Each event triggered widespread fear and often led some investors to pull their money out of the market, locking in their losses. However, for those who maintained their investments or continued to invest through these downturns, the market eventually recovered and went on to reach new highs. A 30-year timeline encompasses multiple economic cycles, recessions, and bull markets. The average stock market return over this period implicitly accounts for these events, demonstrating the market’s enduring capacity for recovery and growth. It underscores the importance of patience and discipline, allowing time for assets to recover and growth to resume.
Factors Influencing Long-Term Returns
While the historical average provides a solid baseline, understanding the underlying drivers and ongoing influences is crucial for a complete picture.
Economic Growth and Corporate Earnings
At its core, the stock market reflects the aggregate future earnings potential of the companies within it. Sustained economic growth, both domestically and globally, generally translates into higher corporate revenues and profits. As companies grow their earnings, their stock prices tend to appreciate over time. Innovation, productivity gains, and expanding consumer bases are all factors that fuel this fundamental growth, contributing directly to long-term market returns.
Interest Rates and Monetary Policy
Interest rates, set or influenced by central banks like the Federal Reserve, play a significant role in market valuations. Lower interest rates generally make stocks more attractive relative to bonds, as the cost of borrowing for companies decreases and future earnings are discounted at a lower rate, increasing their present value. Conversely, higher interest rates can make bonds more competitive and increase borrowing costs, potentially dampening stock market enthusiasm. Monetary policy, therefore, acts as a powerful lever influencing market direction over both short and long terms.
Geopolitical Events and Innovation
Broader global events, such as wars, pandemics, or significant political shifts, can introduce volatility and alter economic trajectories. Similarly, technological innovation and disruptive advancements can create new industries, propel certain sectors to unprecedented growth, and render others obsolete. While these factors can cause short-term disruptions, over a 30-year period, the market typically adapts and often benefits from the overall progress and innovation they represent. The long-term trend has historically been for markets to overcome and incorporate these shifts.
The Role of Dividends
Dividends are payments made by companies to their shareholders, typically from their profits. For long-term investors, the reinvestment of dividends significantly boosts total returns. While the price appreciation of stocks is a major component of returns, dividends contribute a substantial portion – historically, around 40-50% of the S&P 500’s total return over extended periods. Reinvesting these dividends allows for the purchase of more shares, which then generate their own dividends and capital appreciation, creating a powerful compounding effect often overlooked in simpler calculations of stock price changes alone.
Strategies for Maximizing Your 30-Year Returns
Achieving or even exceeding the average stock market return over 30 years isn’t solely about hoping for the best. It involves adopting sound investment principles and sticking to them.
Diversification Across Asset Classes and Geographies
Putting all your eggs in one basket is a recipe for concentrated risk. Diversification, by investing across various asset classes (stocks, bonds, real estate) and geographies (U.S., international developed, emerging markets), helps to reduce idiosyncratic risk – the risk specific to a single company or market. When one asset class or region underperforms, others may be performing well, smoothing out overall portfolio returns. Over 30 years, a well-diversified portfolio is far more resilient and likely to achieve consistent growth than a highly concentrated one.
Dollar-Cost Averaging
Dollar-cost averaging (DCA) is a strategy where you invest a fixed amount of money at regular intervals, regardless of market fluctuations. This means you buy more shares when prices are low and fewer shares when prices are high. Over a 30-year horizon, DCA helps to smooth out the average purchase price of your investments, reducing the risk of making a large investment just before a market downturn. It takes emotion out of investing and leverages market volatility to your advantage over the long run.
Rebalancing Your Portfolio
Over 30 years, the initial allocation of your portfolio (e.g., 80% stocks, 20% bonds) can drift significantly due to differing rates of return among asset classes. Rebalancing involves periodically adjusting your portfolio back to your target allocations. If stocks have performed exceptionally well, you might sell some stock to buy bonds, taking profits and reducing risk. Conversely, if stocks have fallen, you might buy more, effectively buying low. Rebalancing is a disciplined way to manage risk and maintain your desired asset allocation over decades.
Minimizing Fees and Taxes
Every dollar paid in fees or taxes is a dollar that doesn’t compound for you. Over 30 years, even seemingly small fees (e.g., a 1% annual expense ratio) can significantly erode your total returns. Opting for low-cost index funds or ETFs is a highly effective strategy for minimizing investment management fees. Similarly, employing tax-efficient strategies, such as utilizing tax-advantaged accounts (401(k)s, IRAs) and holding investments for the long term to qualify for lower capital gains tax rates, can preserve more of your returns.
Risks and Important Considerations
While the long-term outlook for stock market investing is generally positive, it’s essential to acknowledge that the “average” is not a guarantee and certain risks persist.
Sequence of Returns Risk
This risk refers to the order in which investment returns occur, particularly critical when you are close to or in retirement. A series of poor returns early in your withdrawal phase can severely deplete your portfolio and make it difficult to recover, even if the average long-term return is good. While less relevant for someone 30 years from retirement, it becomes a crucial consideration as your time horizon shortens.
Behavioral Biases
One of the biggest threats to an investor’s long-term returns is their own behavior. Emotional reactions to market fluctuations – such as panic selling during downturns or chasing hot stocks during bull markets – can lead to suboptimal decisions that result in underperformance relative to simply holding a diversified portfolio. Maintaining discipline, sticking to a plan, and avoiding frequent trading are vital for success over 30 years.
The “Average” is Not a Guarantee
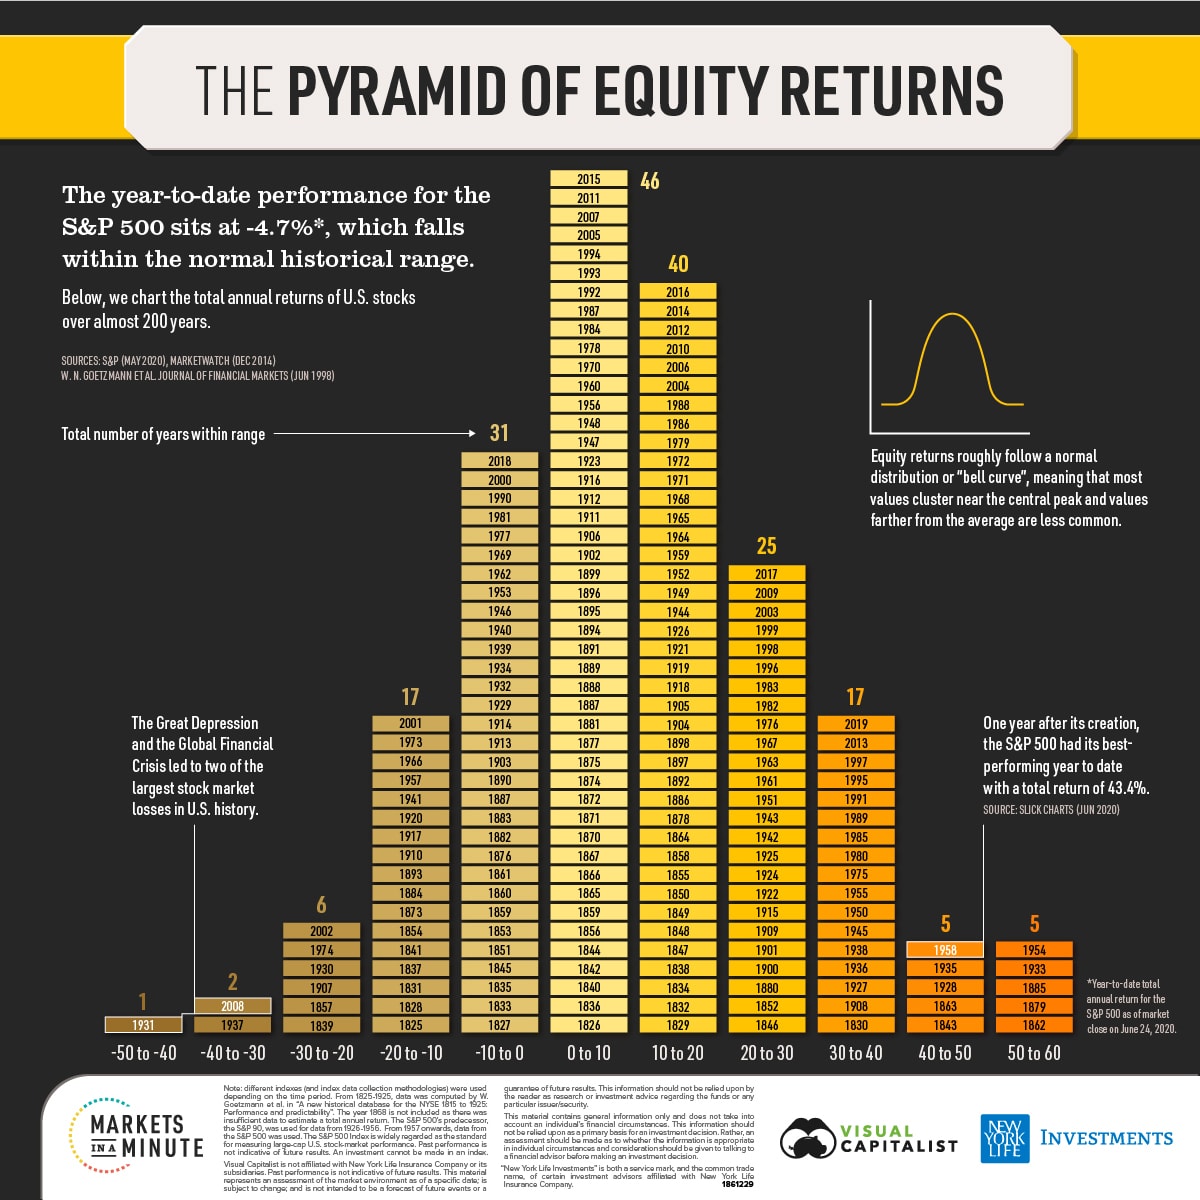
Past performance is not indicative of future results. While historical data provides strong evidence for long-term stock market growth, there’s no guarantee that the next 30 years will mirror the last. Economic conditions, global dynamics, and unforeseen events could alter future average returns. However, the underlying principles of capitalism, innovation, and corporate profit-seeking suggest that equity markets will likely remain a powerful engine for wealth creation over long periods. Investors should approach the average as a guide, not a promise, and build a resilient portfolio designed to withstand various future scenarios.
In conclusion, the average stock market return over 30 years, particularly for a broadly diversified index like the S&P 500, has historically been in the range of 10-12% nominally, or 7-8% in real terms after inflation, assuming reinvested dividends. This impressive performance is a testament to the power of compounding and the market’s ability to overcome short-term volatility. For those with the patience and discipline to maintain a long-term perspective, the stock market remains one of the most effective tools for building substantial wealth.
aViewFromTheCave is a participant in the Amazon Services LLC Associates Program, an affiliate advertising program designed to provide a means for sites to earn advertising fees by advertising and linking to Amazon.com. Amazon, the Amazon logo, AmazonSupply, and the AmazonSupply logo are trademarks of Amazon.com, Inc. or its affiliates. As an Amazon Associate we earn affiliate commissions from qualifying purchases.