
The question “how far will the stock market fall?” is one that looms large in the minds of investors, economists, and everyday citizens whenever signs of economic instability emerge. It’s a question steeped in anxiety, demanding not just a prediction but an understanding of the forces at play, the historical context, and the strategies one can employ to weather the storm. While no one possesses a crystal ball to pinpoint the exact bottom, a comprehensive analysis of market dynamics, economic indicators, and investor behavior can provide a framework for understanding potential trajectories and managing financial decisions during turbulent times. The stock market is a complex adaptive system, influenced by myriad factors from macroeconomic policy to individual investor psychology, making its future movements inherently uncertain, yet historically predictable in its eventual recovery.
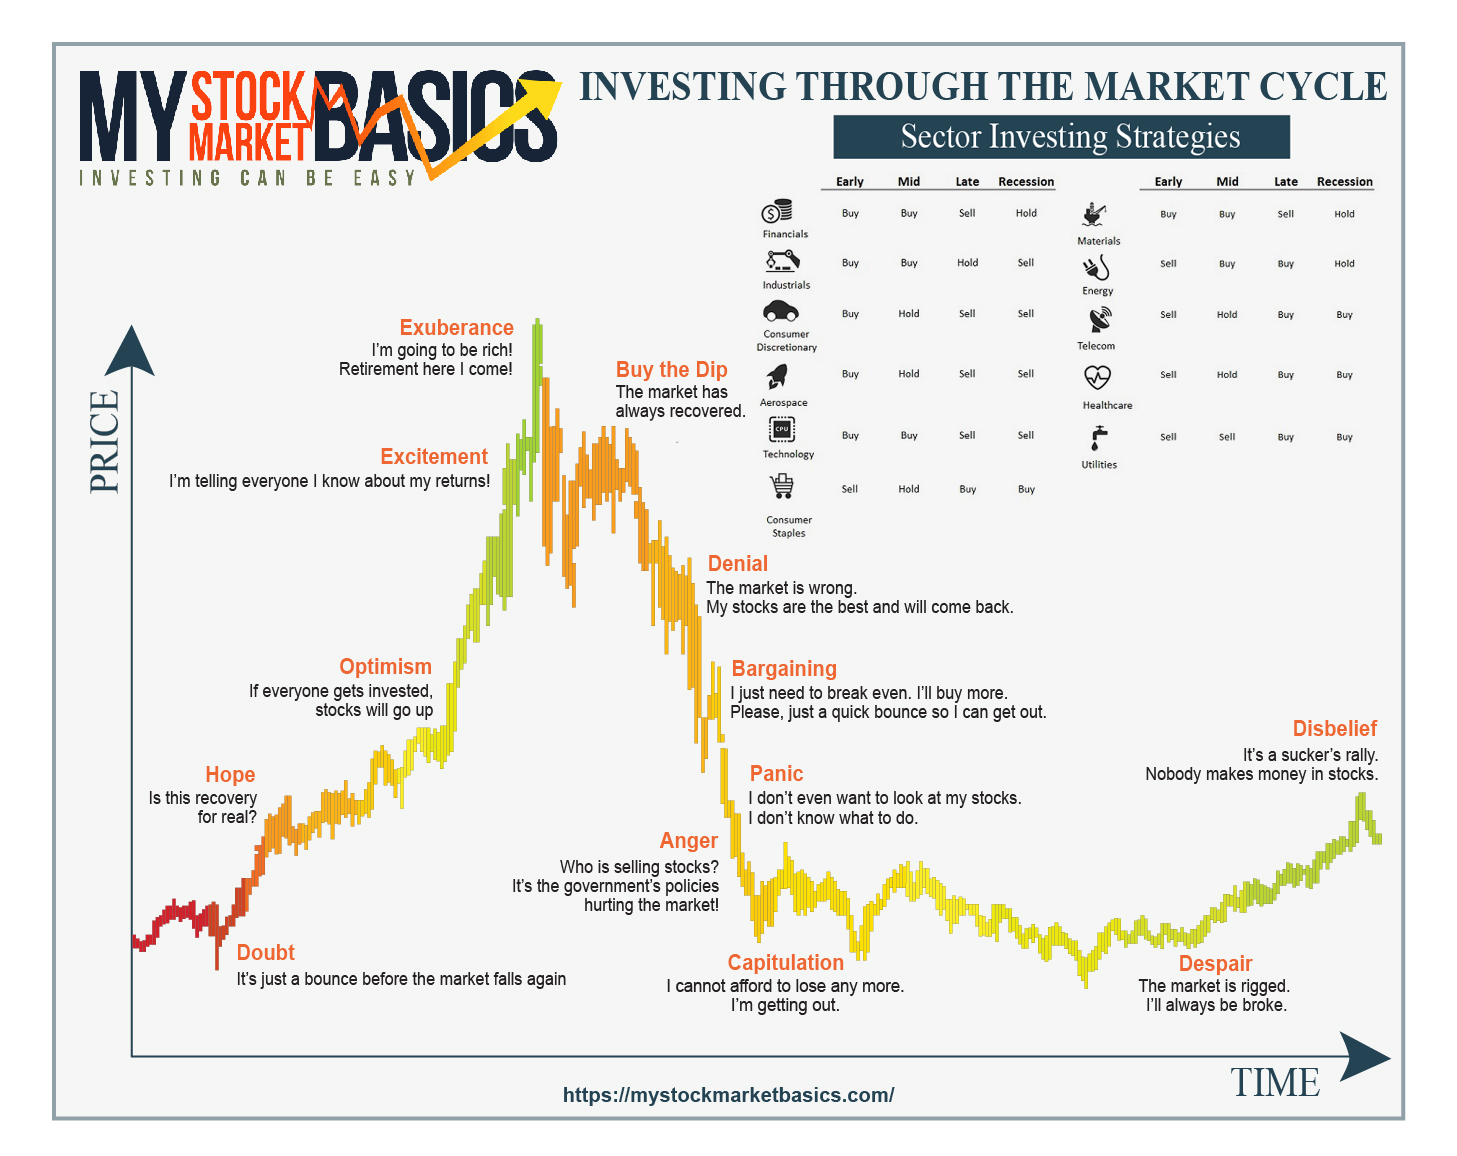
Deconstructing Market Downturns: Corrections vs. Bear Markets
To understand the potential depth of a market decline, it’s crucial to differentiate between various types of downturns. Not all drops are created equal, and their underlying causes often dictate their severity and duration.
Defining Market Corrections
A “market correction” is generally defined as a decline of at least 10% but less than 20% from a recent peak in a major market index, such as the S&P 500. Corrections are a normal, even healthy, part of market cycles. They often occur after periods of rapid growth, serving to “correct” overvalued asset prices and cool off speculative fervor. Historically, corrections are frequent occurrences, happening roughly once every two years on average. They tend to be relatively short-lived, with the market often recovering its losses within a few months. For long-term investors, corrections can be viewed as buying opportunities rather than causes for panic. They can represent a chance to acquire quality assets at a discount, rebalance portfolios, or enter the market at more attractive valuations. The fear of missing out (FOMO) often drives markets higher, and corrections help to reset expectations and bring valuations back in line with fundamentals.
The Anatomy of a Bear Market
A “bear market,” on the other hand, is a more severe and prolonged downturn, characterized by a sustained decline of 20% or more from recent peaks. Bear markets are typically accompanied by widespread pessimism, economic recession or the strong threat of one, and significant drops in corporate earnings. They are less frequent than corrections but can last anywhere from several months to a couple of years, with recovery often taking longer than the initial fall. The average bear market decline has historically been around 30-40%, with some notable exceptions being much deeper. The psychological impact of a bear market is profound, leading to heightened anxiety, forced selling, and a general loss of confidence in the market’s future prospects. Unlike corrections that often present quick bounce-backs, bear markets typically require a fundamental shift in economic conditions or investor sentiment to initiate a sustained recovery. They are often rooted in deeper systemic issues, such as financial crises, asset bubbles bursting, or prolonged economic contractions.
Why Differentiating Matters for Investors
Understanding the difference between a correction and a bear market is vital for investors because it helps in calibrating expectations and making informed decisions. A 10-15% dip might trigger a rebalancing act or a modest buying strategy, whereas a confirmed 20%+ bear market might warrant a more defensive posture, a re-evaluation of risk tolerance, and a commitment to a long-term strategy that anticipates significant volatility. Panicking during a correction and selling off assets can turn temporary paper losses into permanent realized losses, preventing participation in the inevitable rebound. Conversely, ignoring the signs of a deeper bear market could expose one to further significant drawdowns. Differentiating allows investors to react appropriately, avoiding overreactions to minor dips while preparing for the more challenging environment of a prolonged decline.
Key Economic & Geopolitical Drivers of Market Declines
Stock market falls are rarely isolated events; they are typically symptoms of underlying economic or geopolitical stressors. Identifying these drivers is crucial for assessing the potential depth and duration of a downturn.
The Impact of Inflation and Interest Rates
High inflation is a pervasive threat to market stability. It erodes purchasing power, increases the cost of doing business, and often forces central banks to raise interest rates. Higher interest rates, in turn, make borrowing more expensive for companies and consumers, slowing economic growth. They also make bonds and other fixed-income investments more attractive relative to stocks, as their yields rise, drawing capital away from equities. For companies, increased borrowing costs hit profitability, leading to lower earnings expectations and reduced valuations. Furthermore, higher discount rates used in valuation models reduce the present value of future earnings, hitting growth stocks particularly hard. A sustained period of high inflation and aggressive interest rate hikes is a potent recipe for a market downturn.
Corporate Earnings and Economic Growth Concerns
Ultimately, stock prices reflect the present value of future corporate earnings. When economic growth slows or contraction is anticipated (i.e., a recession), corporate profits are expected to decline. Factors such as reduced consumer spending, lower business investment, and supply chain disruptions can all compress profit margins and lead to negative earnings revisions. A significant slowdown in GDP growth, or an outright recession, almost invariably translates into a bear market. Investors are forward-looking, and any credible forecast of declining earnings will prompt them to sell shares, pushing prices lower. The market tends to anticipate these shifts well in advance of official economic data, making earnings guidance and economic forecasts critical indicators.
Geopolitical Instability and Supply Chain Disruptions
Unforeseen geopolitical events—such as wars, trade conflicts, or major political crises—can introduce immense uncertainty and risk into global markets. These events can disrupt supply chains, increase commodity prices (especially energy), reduce international trade, and erode business confidence. For example, a conflict in a major oil-producing region can send energy costs soaring, impacting every sector of the economy. Supply chain disruptions, exacerbated by geopolitical tensions or pandemics, can lead to shortages, higher input costs, and ultimately, inflation and reduced corporate profitability. These external shocks are often difficult to predict and can trigger sharp, sudden market drops, followed by prolonged periods of volatility as their full economic implications unfold.
Investor Sentiment and Behavioral Economics
While fundamentals are paramount, investor sentiment plays a critical role in market movements, especially during downturns. Fear, panic, and a herd mentality can amplify selling pressure far beyond what economic data alone might suggest. Negative news cycles, widespread media coverage of market declines, and the psychological impact of seeing one’s portfolio shrink can lead rational individuals to make irrational decisions, such as selling at the bottom. Behavioral economics highlights how cognitive biases, such as loss aversion and anchoring, can prevent investors from making optimal choices during volatile periods. A sustained period of negative sentiment can create a self-fulfilling prophecy, driving prices lower even if underlying fundamentals don’t fully justify the extent of the sell-off.
Historical Precedents: Lessons from Past Market Falls
History doesn’t repeat itself exactly, but it often rhymes. Examining past market downturns provides valuable context and helps illustrate the various causes and characteristics of significant declines.
Echoes of the Dot-Com Bubble (2000)
The bursting of the dot-com bubble in 2000-2002 saw the NASDAQ Composite index lose nearly 78% of its value, while the S&P 500 fell by almost 50%. This downturn was primarily driven by excessive speculation in technology and internet stocks, many of which had no earnings or viable business models. The market had become detached from fundamentals, propelled by irrational exuberance. When the bubble burst, exacerbated by the Federal Reserve’s interest rate hikes, investors fled overvalued tech stocks, leading to a prolonged bear market. The key lesson here is the danger of speculative bubbles and the eventual return to fundamental valuations.
The Global Financial Crisis (2008)

The Global Financial Crisis (GFC) of 2008-2009 was a systemic crisis rooted in the housing market and complex financial instruments. The S&P 500 plunged by approximately 57% from its peak. This crisis was characterized by widespread credit market freezing, bank failures, and a severe global recession. It highlighted the interconnectedness of the financial system and the risks of excessive leverage and opaque financial products. Government intervention, including bailouts and quantitative easing, was eventually required to stabilize the system. The GFC underscored the importance of robust financial regulation and the profound impact of credit cycles.
The COVID-19 Crash (2020)
In contrast to the longer, drawn-out crises, the COVID-19 crash in March 2020 was incredibly swift, with the S&P 500 dropping about 34% in just over a month. This was a direct response to the unprecedented global economic shutdown imposed to contain the pandemic. The market rebounded equally quickly, however, fueled by massive fiscal stimulus, aggressive monetary policy (zero interest rates, quantitative easing), and rapid vaccine development. This event demonstrated the market’s capacity for both rapid decline and rapid recovery when faced with an exogenous shock that is met with overwhelming policy support.
Common Threads and Unique Catalysts
Across these different crises, common threads emerge: a preceding period of exuberance or unsustainable growth, a catalyst (rate hikes, housing market collapse, pandemic), and a wave of selling often exacerbated by fear. However, each downturn also has its unique catalysts and characteristics, making direct comparisons challenging. What is consistent, though, is the market’s eventual recovery. Every bear market in history has been followed by a bull market, though the timeline for recovery varies significantly. This historical perspective reinforces the importance of patience and a long-term investment horizon.
Navigating the Downturn: Strategies for Investors
Given the inevitability of market downturns, astute investors focus not on predicting the un-predictable bottom, but on implementing strategies that can mitigate risk and even create opportunities during periods of decline.
Embracing a Long-Term Perspective
Perhaps the most crucial strategy during a market fall is to maintain a long-term perspective. For investors with horizons of 5, 10, or 20+ years, short-term volatility is noise. History unequivocally demonstrates that equity markets trend upwards over the long run, consistently recovering from even the most severe downturns and reaching new highs. Panicking and selling during a decline locks in losses and prevents participation in the subsequent recovery. Focusing on financial goals (retirement, home purchase) rather than daily market fluctuations helps to avoid emotional decision-making.
The Power of Diversification and Asset Allocation
Diversification across different asset classes (stocks, bonds, real estate, commodities), geographies, and sectors is fundamental. A well-diversified portfolio aims to reduce overall risk, as different assets tend to perform differently under various market conditions. When stocks are falling, bonds (especially high-quality government bonds) often act as a ballast, providing stability or even positive returns. Asset allocation – determining the appropriate mix of these assets based on one’s age, risk tolerance, and financial goals – is equally vital. A thoughtful asset allocation strategy ensures that an investor isn’t overly exposed to any single market segment that could be disproportionately hit during a downturn.
Dollar-Cost Averaging: Turning Volatility into Opportunity
Dollar-cost averaging (DCA) is a powerful strategy, particularly effective during market declines. It involves investing a fixed amount of money at regular intervals, regardless of market conditions. When prices are high, your fixed investment buys fewer shares; when prices are low (during a downturn), it buys more shares. Over time, this averages out the purchase price and can lead to lower average costs per share than trying to time the market. During a market fall, DCA allows investors to systematically “buy the dip” without the stress of trying to identify the absolute bottom, positioning them for greater returns when the market eventually recovers.
Rebalancing and Risk Management
Regularly rebalancing your portfolio ensures that your asset allocation remains aligned with your long-term goals. If stocks have performed exceptionally well, they might grow to represent a larger percentage of your portfolio than originally intended, increasing your risk exposure. Rebalancing involves selling off some of the outperforming assets and reallocating to underperforming ones (e.g., selling some stocks and buying bonds, or vice-versa). During a downturn, this might mean selling some bonds that have performed well to buy more stocks at depressed prices, effectively selling high and buying low. Risk management also includes understanding your personal risk tolerance and ensuring your portfolio composition does not exceed that comfort level, thereby preventing emotionally driven sales during stressful periods.
The Importance of Cash Reserves
Maintaining adequate cash reserves is crucial for both personal financial security and investment flexibility. A robust emergency fund (3-6 months of living expenses) prevents the need to sell investments at a loss to cover unexpected expenses during a market downturn. Beyond that, having some dry powder in cash can provide the opportunity to deploy capital into the market when valuations become particularly attractive during a significant fall. This strategic cash position allows investors to take advantage of buying opportunities without being forced to liquidate other assets.
The Road to Recovery: Signs and Timelines
While the depth of a market fall is a critical concern, the question of when and how it will recover is equally important. Understanding the potential signs of a bottom and the factors driving recovery can help investors maintain conviction.
Identifying Potential Turning Points
Identifying the precise bottom of a market is notoriously difficult, but several indicators can signal that a recovery might be on the horizon. These include a sustained improvement in economic data (e.g., manufacturing activity, employment figures), a moderation of inflation, and a shift in central bank policy from tightening to easing (or at least pausing rate hikes). Investor sentiment, which tends to be at its most pessimistic near the bottom, also plays a role. A “capitulation” event—a period of intense, widespread selling often marked by extremely high trading volumes—can sometimes signal that the market has flushed out most of the weak hands. Lastly, a general improvement in corporate earnings outlooks or less negative guidance can be a strong leading indicator.
The Role of Central Bank Actions and Government Policies
Central banks and governments play a pivotal role in engineering market recoveries, especially after systemic shocks. Aggressive monetary policy (like interest rate cuts, quantitative easing) and fiscal stimulus (government spending, tax breaks) can inject liquidity into the economy, stimulate demand, and restore confidence. These policy interventions aim to prevent a deeper recession and support asset prices. The speed and scale of such responses often dictate the pace of market recovery. For example, the rapid rebound from the COVID-19 crash was largely due to unprecedented global fiscal and monetary stimulus.
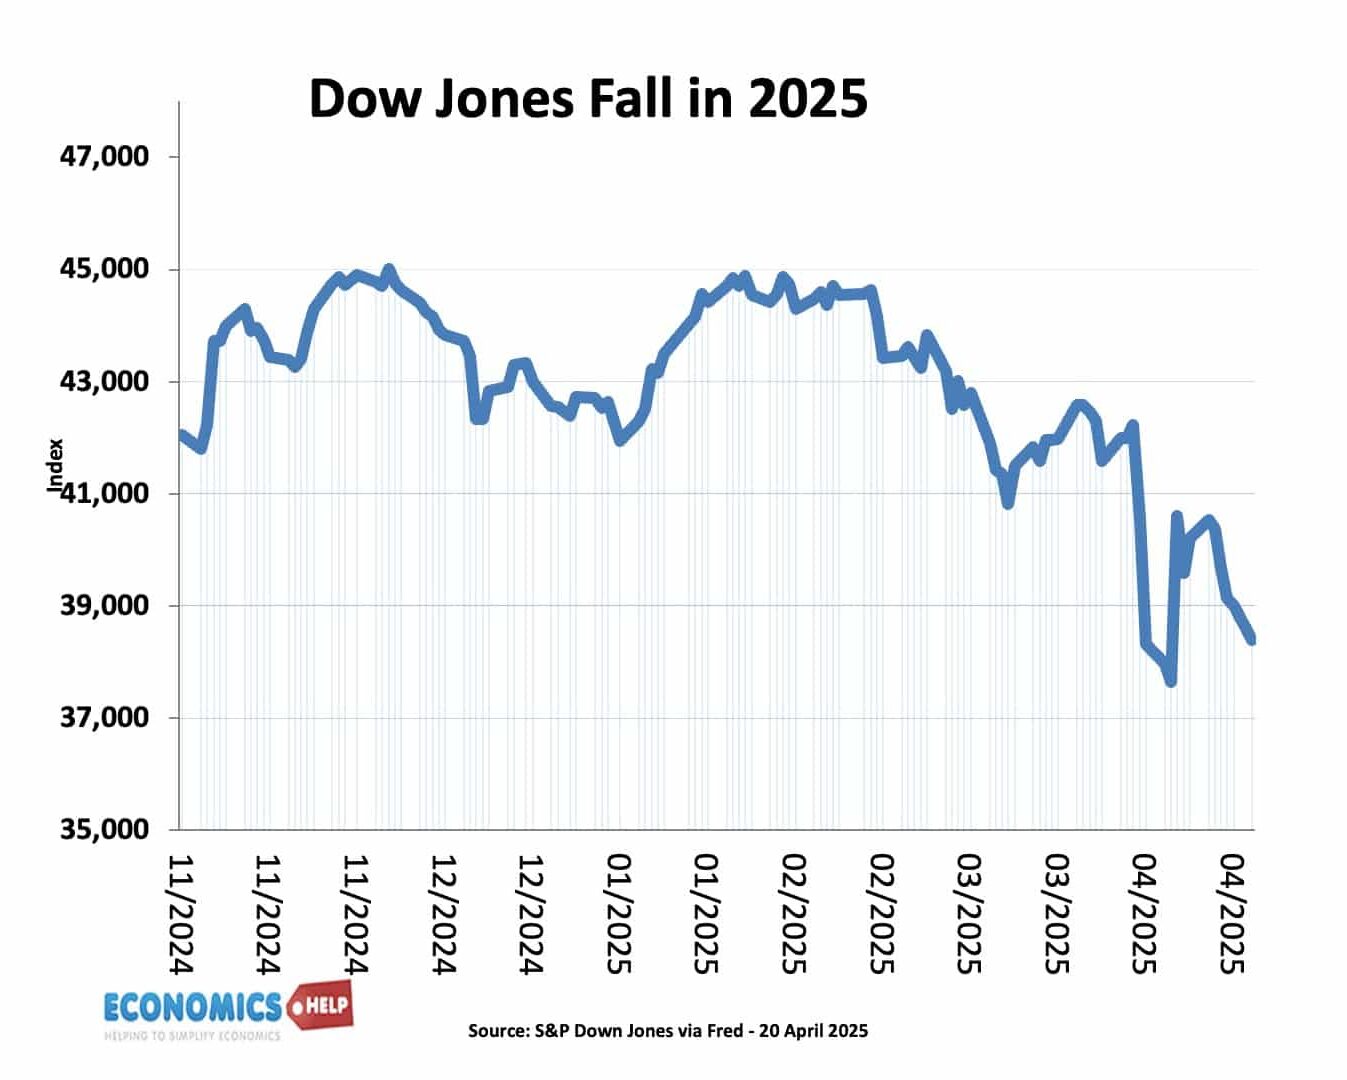
The Inevitable Rebound: A Historical View
Despite the fears and uncertainties accompanying every significant market downturn, history offers a powerful reassurance: the market always recovers. While the duration and magnitude of bear markets vary, every single one has been followed by a bull market that eventually leads to new highs. The average bear market lasts about 9-10 months, while the average bull market lasts significantly longer, often for several years. The key takeaway from this historical pattern is that resilience and patience are rewarded. Investors who remain invested through the downturn and even continue to contribute, position themselves to capture the full benefits of the subsequent recovery. The fear of “how far will it fall?” must always be balanced by the historical certainty of “it will eventually rise again.”
In conclusion, predicting the precise depth of a stock market fall is an exercise in futility. Instead, investors should focus on understanding the underlying drivers of downturns, learning from historical precedents, and implementing sound financial strategies like diversification, dollar-cost averaging, and maintaining a long-term perspective. While the journey through a market decline can be psychologically challenging, armed with knowledge and discipline, investors can not only survive but potentially thrive when the inevitable rebound takes hold.
aViewFromTheCave is a participant in the Amazon Services LLC Associates Program, an affiliate advertising program designed to provide a means for sites to earn advertising fees by advertising and linking to Amazon.com. Amazon, the Amazon logo, AmazonSupply, and the AmazonSupply logo are trademarks of Amazon.com, Inc. or its affiliates. As an Amazon Associate we earn affiliate commissions from qualifying purchases.