
Navigating the financial markets can often feel like charting a course through a dynamic and unpredictable ocean. For investors, traders, and even casual observers, understanding the stock market’s daily pulse is crucial. While headlines provide snippets, a deeper, more nuanced understanding comes from interpreting the visual narrative presented by market graphs. These charts are not just aesthetically pleasing data visualizations; they are powerful tools that encapsulate the collective sentiment, economic forces, and individual company performances that dictate the market’s trajectory.
Today, as financial markets around the globe continue their relentless churn, investors are constantly seeking clarity. Is the prevailing trend upward, suggesting bullish sentiment and economic growth, or are there signs of caution and potential downturns? This article delves into how we can effectively answer the question, “How is the stock market doing today?” by leveraging graphical analysis, understanding key indicators, and placing daily movements within a broader strategic context. We will explore the critical elements that shape market performance, the tools used to visualize it, and how to interpret these insights for informed decision-making in the intricate world of finance.
Decoding Daily Market Performance: Key Indicators and Indices
To understand how the stock market is doing today, it’s essential to look beyond the general sentiment and pinpoint specific metrics and indices that serve as its primary gauges. These indicators offer a snapshot of market health and direction, allowing investors to quickly assess the current landscape.
The Major Market Indices: Barometers of Economic Health
The stock market isn’t a single entity; it’s a vast collection of exchanges and securities. To simplify its tracking, we rely on major indices, each representing a different segment or aspect of the economy. Their daily performance is often the first data point reported in financial news.
S&P 500 (Standard & Poor’s 500)
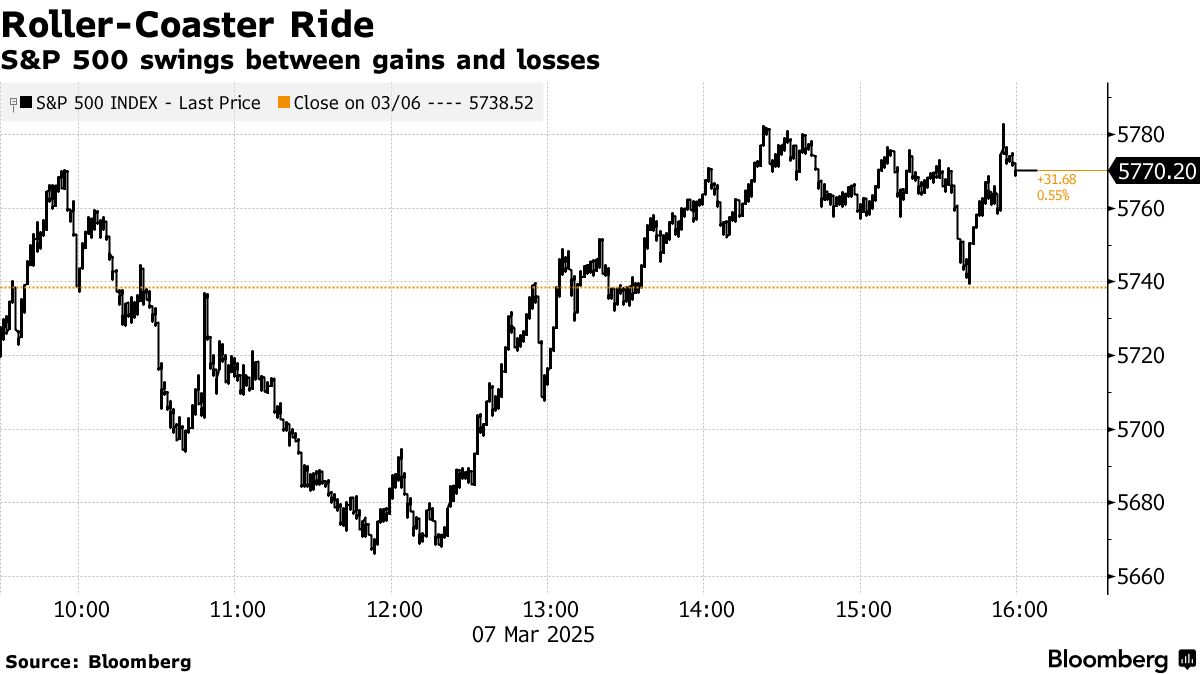
Widely considered the best gauge of large-cap U.S. equities and a proxy for the broader economy, the S&P 500 tracks 500 of the largest U.S. publicly traded companies. Its movement today tells a significant story about the health of American corporations and investor confidence in large established businesses. A rising S&P 500 often signals a robust economy, while a decline can indicate widespread investor concern. Observing its real-time graph provides immediate insight into this critical benchmark’s current standing relative to its previous close.
Dow Jones Industrial Average (DJIA)
Comprising 30 prominent U.S. companies, the Dow is one of the oldest and most recognized market indices. While it represents a smaller basket of stocks than the S&P 500, its constituent companies are often industry leaders, and their collective performance can still sway overall market sentiment. A strong showing by the Dow today suggests confidence in established industrial and consumer sectors, whereas a dip might point to headwinds faced by these titans.
Nasdaq Composite
The Nasdaq Composite is heavily weighted towards technology and growth companies. Its performance is a crucial indicator for the tech sector, which often drives innovation and, at times, market volatility. Today’s Nasdaq graph reveals the appetite for high-growth stocks, which can be particularly sensitive to interest rate expectations and innovation cycles. A strong Nasdaq often reflects investor optimism about future technological advancements and corporate earnings in the tech space.
Other Global Indices
Beyond the U.S., major global indices like the FTSE 100 (UK), DAX (Germany), Nikkei 225 (Japan), and Hang Seng Index (Hong Kong) provide insight into international markets. Monitoring these alongside domestic indices offers a comprehensive global perspective, as markets worldwide are increasingly interconnected. A downturn in one major global market can ripple across others, influencing today’s domestic market performance.
Volume and Volatility: Deeper Insights from the Graph
While price movement is paramount, the volume of shares traded and the market’s volatility provide crucial context to daily graphical representations.
Trading Volume
The volume displayed on a graph (often at the bottom of a candlestick chart) indicates the number of shares or contracts traded during a specific period. High volume accompanying a significant price move (up or down) suggests strong conviction behind that move. Conversely, a large price swing on low volume might be less reliable, potentially indicating fewer participants and easier manipulation. Today’s volume can confirm the strength of current trends.
Market Volatility (VIX)
Often referred to as the “fear index,” the CBOE Volatility Index (VIX) measures the market’s expectation of future volatility based on S&P 500 options. A rising VIX graph indicates increasing investor anxiety and often accompanies sharp market declines. Monitoring the VIX alongside stock market graphs helps gauge the level of uncertainty and risk aversion present in the market today.
Interpreting Graphical Representations of Stock Market Data
Graphs are the language of the market, translating complex data points into understandable visual patterns. Learning to read these charts effectively is a fundamental skill for anyone assessing today’s market performance.
Candlestick Charts: The Most Detailed View
Candlestick charts are the most popular method for displaying stock price movements over time, offering a rich amount of information in a compact visual format. Each “candlestick” typically represents a day’s trading activity.
Components of a Candlestick
- Body: Represents the opening and closing prices. If the close is higher than the open, the body is usually green or white (bullish). If the close is lower than the open, it’s typically red or black (bearish).
- Wicks (Shadows): Thin lines extending from the top and bottom of the body, indicating the highest and lowest prices reached during the period.
- Today’s Candlestick: By analyzing today’s candlestick, one can instantly see the opening price, closing price, and the daily high and low. Its color and length relative to previous candlesticks provide immediate clues about daily momentum and sentiment.
Recognizing Basic Candlestick Patterns
Certain combinations of candlesticks can hint at potential future movements. While no pattern guarantees an outcome, they offer probabilities:
- Doji: A small body (open and close are very close) with long wicks, indicating indecision in the market. Today’s market might be pausing for breath or awaiting new information.
- Engulfing Patterns: A large candlestick body completely “engulfing” the previous day’s smaller body, suggesting a strong shift in sentiment (bullish engulfing or bearish engulfing).
- Hammers/Hanging Men: Candlesticks with a small body at one end of a long lower wick, indicating a potential reversal.
Trend Lines and Support/Resistance Levels
Beyond individual candlesticks, drawing lines on a graph helps identify broader trends and critical price levels.
Identifying Trends
- Uptrend: Characterized by a series of higher highs and higher lows, depicted by an upward-sloping trend line connecting the lows.
- Downtrend: Characterized by a series of lower lows and lower highs, depicted by a downward-sloping trend line connecting the highs.
- Sideways/Consolidation: When the market trades within a relatively narrow range, indicating a period of indecision or accumulation/distribution before a potential breakout. Observing today’s price action against these established trends helps determine if the current movement is a continuation or a potential reversal.
Support and Resistance
- Support: A price level where buying interest is strong enough to prevent the price from falling further. On a graph, it’s often a previous low or a level where the price bounced upwards multiple times.
- Resistance: A price level where selling interest is strong enough to prevent the price from rising higher. It’s often a previous high or a level where the price fell downwards multiple times.
Today’s market performance relative to these levels is critical. A breakout above resistance or a breakdown below support can signal a significant shift in market dynamics.
Factors Influencing Today’s Stock Market Performance
The stock market doesn’t move in a vacuum. A multitude of economic, political, and corporate events constantly shape its trajectory. Understanding these underlying drivers is crucial for a complete graphical analysis.
Macroeconomic Data Releases
Regular economic reports provide fundamental context for market movements.
- Inflation Reports (CPI, PPI): High inflation can lead to interest rate hikes, impacting corporate borrowing costs and consumer spending, potentially making stocks less attractive. Today’s inflation data release can cause immediate market reactions.
- Employment Data (Non-Farm Payrolls, Unemployment Rate): Strong job growth typically signals a healthy economy, which is bullish for stocks. Weak numbers can spark recession fears.
- GDP Growth: The ultimate measure of economic output. Strong GDP growth provides a robust backdrop for corporate earnings.
- Interest Rate Decisions (Federal Reserve, ECB, etc.): Central bank policy announcements have a profound and immediate impact on financial markets. Higher rates generally dampen stock market enthusiasm as they increase the cost of capital and make bonds more attractive.
Corporate Earnings and News
Individual company performance, especially that of major index components, significantly influences the broader market.
- Earnings Reports: Companies report quarterly earnings, revenues, and future outlooks. Positive surprises often lead to stock price increases, while disappointments can trigger sell-offs. The collective impact of several key earnings reports today can move entire sectors or even the broader market.
- Mergers & Acquisitions (M&A): Announcements of M&A activity can create excitement and drive stock prices up for both the acquiring and target companies, and sometimes for entire sectors.
- Product Launches & Innovation: Breakthrough products or significant technological advancements can propel a company’s stock and generate sector-wide enthusiasm.
Geopolitical Events and Global News
Events on the world stage, even those seemingly distant, can send ripples through global financial markets.
- Political Instability: Wars, elections, or major policy shifts in significant economies can introduce uncertainty, leading to market volatility and flight to safety assets.
- Trade Wars & Sanctions: Disruptions to international trade can impact corporate supply chains, revenues, and overall economic growth, often reflected in stock market graphs.
- Natural Disasters & Pandemics: Large-scale events can disrupt economic activity, impact specific industries, and create widespread market uncertainty.
Leveraging Tools and Resources for Real-Time Analysis
In today’s fast-paced financial world, having access to real-time data and analytical tools is indispensable for monitoring the stock market.
Financial News Platforms and Websites
Reliable financial news sources are the first line of defense for staying informed.
- Bloomberg, Reuters, The Wall Street Journal, Financial Times: These platforms offer comprehensive news coverage, expert analysis, and real-time market updates that can explain the “why” behind today’s graph movements.
- Yahoo Finance, Google Finance, Investing.com: These free platforms provide accessible real-time quotes, interactive charts, and news feeds, making them excellent starting points for daily market tracking.
Brokerage Platforms and Charting Software
For active investors and traders, brokerage platforms offer advanced charting capabilities and analytical tools.
- Interactive Charts: Most platforms allow users to customize chart types (candlestick, line, bar), timeframes (intraday, daily, weekly), and add various technical indicators (moving averages, RSI, MACD).
- Technical Indicators: These mathematical calculations, applied to price and volume data, help identify potential entry/exit points, momentum, and overbought/oversold conditions. Learning to apply and interpret these on today’s stock market graph can significantly enhance analysis.
- Alerts and Watchlists: Setting up personalized alerts for specific price levels or news events ensures that critical information is not missed, allowing for timely reactions to market changes.
Beyond Today: Strategic Implications of Daily Market Graphs
While understanding “how the stock market is doing today” is crucial for short-term decision-making, it’s equally important for long-term strategic planning. Daily graphs are pieces of a much larger puzzle.
Short-Term vs. Long-Term Perspectives
- Short-Term Trading: For day traders or swing traders, today’s market graph is paramount. They seek to capitalize on small, rapid price fluctuations, using technical analysis extensively to predict hourly or daily movements.
- Long-Term Investing: For long-term investors, daily fluctuations, while observed, are less critical than the overall trend. They focus on fundamental analysis, economic cycles, and compounding returns over years. However, even long-term investors benefit from understanding daily market sentiment, as significant downturns can present buying opportunities, and extended bull runs might signal a need for rebalancing.
Risk Management and Portfolio Adjustments
Today’s market performance, especially if it signals a significant shift, can prompt investors to review their risk exposure.
- Diversification: Daily market movements can highlight sectors or asset classes performing well or poorly, prompting investors to ensure their portfolios remain diversified to mitigate specific risks.
- Stop-Loss Orders: For risk management, understanding support levels from daily graphs can inform the placement of stop-loss orders to limit potential losses on individual holdings.
- Rebalancing: Significant market swings, visible on daily graphs, can cause a portfolio’s asset allocation to drift. Periodically rebalancing back to target allocations based on market performance helps maintain desired risk levels.
The Psychological Aspect of Market Dynamics
Graphs also reflect the collective psychology of the market. Fear and greed are powerful emotions that can drive irrational exuberance or panic selling, often visible in sharp, unconfirmed movements on a daily graph. Understanding these psychological undercurrents, and resisting the urge to make emotional decisions based purely on today’s dramatic graph, is a hallmark of disciplined investing.

Conclusion
Answering the question “How is the stock market doing today?” requires more than a casual glance at a headline. It demands an understanding of major indices, an ability to interpret detailed graphical representations like candlestick charts, and an awareness of the multitude of factors that influence price movements. From macroeconomic reports to corporate earnings, and from geopolitical events to central bank policies, every element contributes to the dynamic narrative told by today’s stock market graph.
By consistently utilizing reliable financial tools, practicing graphical analysis, and integrating daily insights into a broader, long-term financial strategy, investors can navigate the complexities of the market with greater confidence and make more informed decisions. The stock market’s daily graph is not just a record of past events; it’s a living, breathing commentary on global finance, offering invaluable clues for those willing to listen and learn.
aViewFromTheCave is a participant in the Amazon Services LLC Associates Program, an affiliate advertising program designed to provide a means for sites to earn advertising fees by advertising and linking to Amazon.com. Amazon, the Amazon logo, AmazonSupply, and the AmazonSupply logo are trademarks of Amazon.com, Inc. or its affiliates. As an Amazon Associate we earn affiliate commissions from qualifying purchases.