
The decentralized finance (DeFi) landscape, a vibrant subset of the broader cryptocurrency ecosystem, offers unprecedented opportunities for financial autonomy and innovation. Platforms like Ape.pro stand at the forefront, providing users with tools for swapping, staking, and engaging with various digital assets. However, to effectively navigate these platforms and make informed decisions, a fundamental understanding of the numerical data presented is crucial. This article serves as a comprehensive technical guide on how to interpret and leverage the various metrics displayed within the Ape.pro environment, focusing on the technical aspects of data presentation and analysis rather than financial advisory.

Ape.pro, like many decentralized exchanges (DEXs) and DeFi protocols, presents a rich tapestry of numerical information. From real-time price feeds and trading volumes to liquidity pool depths and yield percentages, each number tells a part of the story about an asset’s market dynamics, a pool’s health, or a transaction’s cost. Mastery of these metrics empowers users to interact with the platform more intelligently, optimize their strategies, and minimize potential risks inherent in a volatile market. We will delve into the core data points, explain their technical significance, and guide you through extracting meaningful insights from Ape.pro’s interface.
Navigating the Ape.pro Interface for Data Discovery
Before diving into the specifics of each number, it’s essential to understand where to find them and how the Ape.pro interface is typically structured to display this information. Most DeFi platforms prioritize user experience by presenting critical data points prominently, often using dashboards, interactive charts, and clear numerical displays. Familiarity with these UI elements is the first step towards effective data interpretation.
Locating Core Price & Volume Metrics
The most immediate and frequently accessed numbers on Ape.pro (or any DEX) relate to an asset’s price and trading volume. These are fundamental indicators of an asset’s current market valuation and the level of activity surrounding it.
Upon accessing a trading pair on Ape.pro, such as APE/WETH, you will typically encounter:
- Current Price: This is the real-time exchange rate between the two assets in the pair. It’s usually displayed prominently at the top of the trading interface. For example, if APE/WETH shows
0.0025 WETH, it means one APE token can be exchanged for 0.0025 Wrapped Ether. This number is dynamic, constantly updating as trades occur across the liquidity pool. - 24-Hour Price Change (%): This percentage indicates how much the price of the asset has moved up or down over the last 24 hours. A
+5.2%change signifies a 5.2% increase, while-3.1%indicates a 3.1% decrease. This metric provides a quick snapshot of short-term price volatility and trend. - 24-Hour High/Low: These figures represent the highest and lowest prices reached by the asset pair within the last 24 hours. They define the price range an asset has traded within, offering context to the current price. If the current price is near the 24-hour high, it suggests recent upward momentum; near the low, recent downward pressure.
- 24-Hour Trading Volume: This number quantifies the total value of assets traded for that specific pair over the past 24 hours. High trading volume generally suggests strong market interest and liquidity, making it easier to execute larger trades without significant price impact. Conversely, low volume might indicate less interest, potentially leading to higher slippage for larger orders. Volume is often expressed in both base and quote currencies (e.g., “1,000,000 APE” and “$2,500,000 USD equivalent”).
Understanding these basic metrics together paints a picture of an asset’s immediate market health and activity, guiding basic trading decisions on the platform.
Understanding Charting Tools and Timeframes
Beyond raw numbers, Ape.pro, like professional trading platforms, integrates charting tools to visualize price movements over time. These charts are not just aesthetically pleasing; they are powerful analytical instruments.
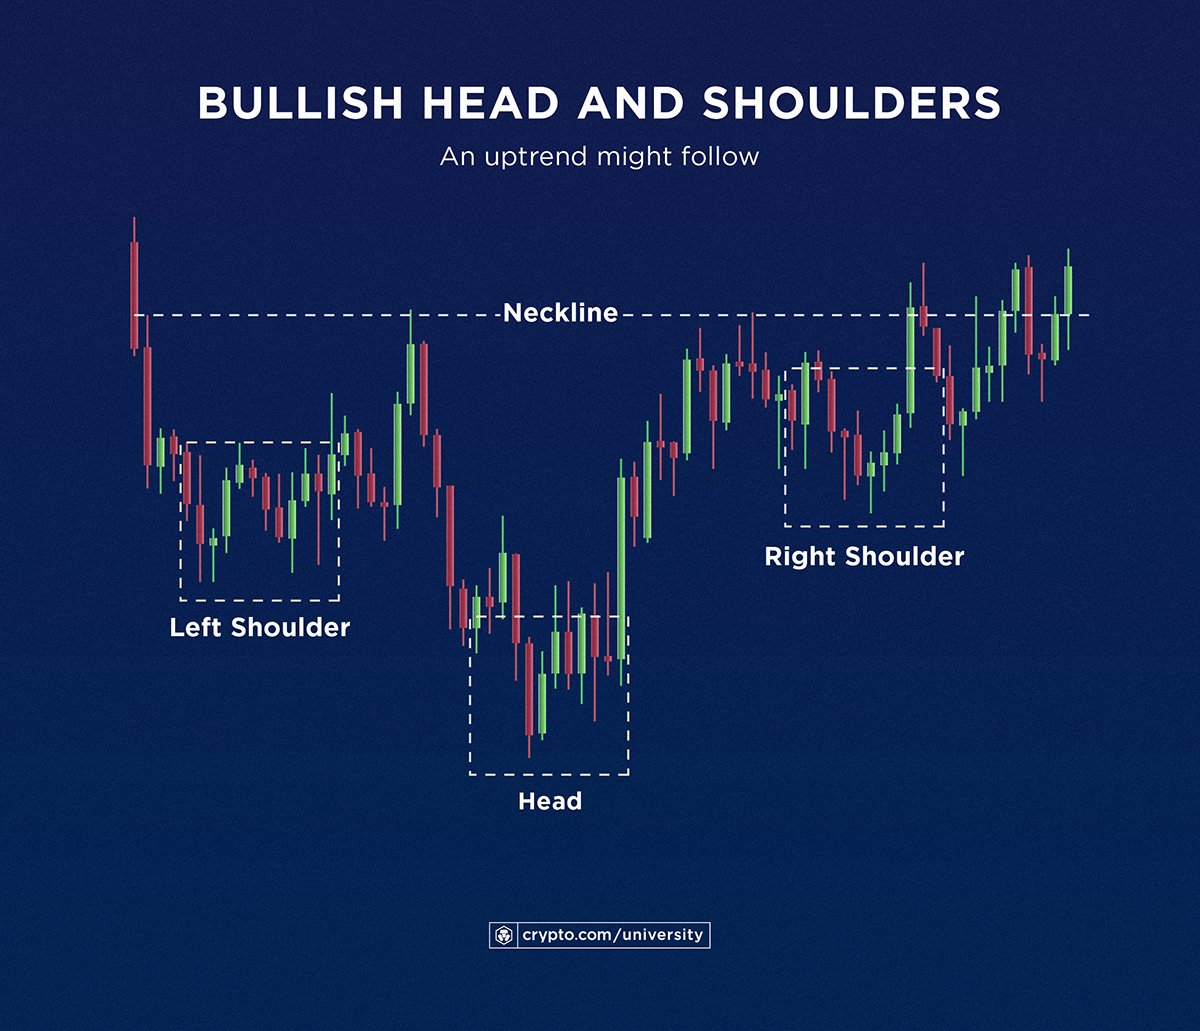
- Candlestick Charts: The most common type, each “candlestick” represents price action over a specific timeframe (e.g., 1 minute, 1 hour, 1 day). A green (or hollow) candle indicates the closing price was higher than the opening price, while a red (or filled) candle indicates the opposite. The “body” of the candle shows the open and close prices, and the “wicks” (or shadows) extend to show the highest and lowest prices within that period. Reading these candles helps identify trends, reversals, and volatility.
- Timeframes: Charting tools allow users to select different timeframes (e.g., 5m, 1h, 4h, 1d, 1w). Switching between these timeframes enables analysis of both short-term fluctuations and long-term trends. A sudden dip on a 5-minute chart might be insignificant in the context of a 1-day chart showing a strong uptrend. Observing multiple timeframes provides a more holistic view.
- Indicators: Advanced charting sections often provide access to technical indicators like Moving Averages (MAs), Relative Strength Index (RSI), or Moving Average Convergence Divergence (MACD). While explaining these is beyond the scope of basic number reading, understanding that their output is numerically derived from price and volume data allows for deeper technical analysis, aiding in predicting potential future price movements. These indicators provide mathematically derived signals about market momentum, overbought/oversold conditions, and trend strength.
Decoding Liquidity and Pool Analytics
Ape.pro, being a DEX, relies on liquidity pools to facilitate trades. Understanding the numbers associated with these pools is vital for both traders and liquidity providers (LPs). These metrics reveal the robustness of the trading environment and the potential returns or risks for LPs.
Interpreting Total Value Locked (TVL) and Liquidity Depth
Liquidity is the lifeblood of any DEX. Without sufficient liquidity, trading becomes inefficient, leading to high slippage and poor execution.
- Total Value Locked (TVL): This metric represents the total value of all assets currently staked within a specific protocol or, more granularly, within a particular liquidity pool on Ape.pro. A higher TVL generally indicates a more robust and trusted protocol, suggesting greater capital commitment from LPs. For traders, a high TVL in a pool means more assets are available for swapping, reducing the impact of large trades. TVL is often displayed in USD equivalent for easy comparison.
- Liquidity Depth: While TVL gives an overall picture, “liquidity depth” often refers to the specific amount of assets available within a particular trading pair’s pool. For instance, the APE/WETH pool might show
10,000,000 APEand25,000 WETHas its current depth. This directly informs how much of an asset you can trade before significantly impacting its price (i.e., incurring high slippage). Deeper pools allow for larger trades with less price distortion.
These numbers are critical for assessing the efficiency and safety of trading on Ape.pro. A pool with low liquidity depth might appear attractive due to high APRs, but large trades could incur substantial losses due to slippage, making the effective return much lower.
Grasping Impermanent Loss and Yield Metrics (APRs/APYs)
For those considering providing liquidity to Ape.pro pools, a different set of numbers comes into play, primarily related to potential earnings and risks.
- APRs (Annual Percentage Rate) / APYs (Annual Percentage Yield): These figures represent the annualized return an LP can expect from providing liquidity to a specific pool.
- APR typically refers to the simple interest rate, not accounting for compounding.
- APY takes into account the effect of compounding interest (reinvesting earnings), thus often appearing higher than APR for the same underlying rate.
These numbers are crucial for LPs, but it’s important to understand they are often variable and subject to change based on trading volume, pool size, and token emissions. They are often displayed as estimates based on historical performance.
- Impermanent Loss (IL) Factor: Impermanent loss is a unique risk associated with providing liquidity to automated market makers (AMMs) like those powering Ape.pro. It’s the difference in value between simply holding assets and providing them as liquidity. While not always displayed as a direct number in a percentage on the main interface, understanding its implications is paramount. IL occurs when the price ratio of the tokens in a liquidity pool changes from when they were deposited. The greater the price divergence between the two tokens, the greater the impermanent loss. While the platform won’t give you a real-time IL number, its potential is reflected in the volatility of the tokens in the pair. LPs must consider the historical volatility of a pair when evaluating its APR/APY, as high volatility increases the risk of significant impermanent loss.
Reading these numbers together allows prospective LPs to weigh potential rewards against inherent risks, making an informed decision about capital allocation within Ape.pro’s liquidity pools.
Transactional Data: Slippage, Gas, and Execution
Executing a trade on Ape.pro involves interacting with a smart contract on the blockchain. This process introduces additional numerical considerations related to the transaction itself, impacting the final outcome of your swap.
Managing Slippage Tolerance for Optimal Swaps
Slippage is a critical concept for anyone executing trades on a DEX. It refers to the difference between the expected price of a trade and the actual price at which the trade is executed.
- Slippage Tolerance (%): Ape.pro will typically allow users to set a “slippage tolerance,” usually a percentage (e.g., 0.5%, 1%, 3%). This number dictates the maximum percentage deviation from the expected price you are willing to accept for your trade to go through.
- If you set a low slippage tolerance (e.g., 0.5%), your trade might fail if the price moves too much during the transaction processing time, especially in volatile markets or low-liquidity pools.
- If you set a high slippage tolerance (e.g., 3%), your trade is more likely to succeed, but you risk getting a significantly worse price than you initially saw.
This number directly impacts transaction success and final received asset quantity. Monitoring real-time price feeds and adjusting slippage tolerance based on market conditions and pool liquidity is a common practice among experienced traders. Understanding this number allows users to technically configure their transaction parameters to balance execution certainty with price certainty.
Understanding Gas Fees and Network Congestion
Every interaction with the blockchain, including swaps on Ape.pro, incurs a transaction fee known as “gas.” This fee is paid to network validators for processing and securing your transaction.
- Gas Price (Gwei): Gas is measured in “Gwei,” a small denomination of Ether (1 Ether = 1,000,000,000 Gwei). Ape.pro will often display an estimated gas fee for your transaction, usually in USD equivalent and sometimes directly in Gwei. The higher the Gwei, the more expensive the transaction.
- Gas Limit: This is the maximum amount of gas you are willing to spend on a transaction. While Ape.pro typically auto-sets an appropriate gas limit, understanding its concept is important. If a transaction runs out of gas before completion, it fails, but you still pay for the consumed gas.
- Estimated Transaction Cost: Before confirming a swap, Ape.pro will provide an estimated total transaction cost, usually broken down into the asset being swapped and the network fee. This number fluctuates based on network congestion. During peak times, when many users are trying to transact, gas prices (Gwei) surge, making transactions more expensive. Tools within Ape.pro or external sites (like Etherscan’s Gas Tracker for Ethereum) can display real-time network congestion and average gas prices, allowing users to choose optimal times for transactions or adjust their acceptable fee.
Proficiently reading these numbers helps users manage transaction costs and ensure their trades are processed efficiently without overpaying. It’s a technical balancing act between speed and cost.
Advanced Data Points and Platform Insights
Beyond the immediate numbers for trading and liquidity, Ape.pro, or complementary analytics tools, can offer deeper insights through advanced data points. These allow for more sophisticated analysis of market structure and participant behavior.
On-Chain Data Analysis and Wallet Tracking
The transparent nature of blockchain technology means all transactions are publicly viewable. While Ape.pro provides its interface, external tools or deeper dives within Ape.pro itself can leverage this transparency.
- Transaction Hash/ID: Every transaction has a unique alphanumeric identifier. Ape.pro will display this after a successful swap. Copying this hash and pasting it into a blockchain explorer (e.g., Etherscan for Ethereum-based tokens) allows you to see the raw, immutable data of your transaction, including the exact gas cost, block number, and participating addresses. This is crucial for verifying transaction details or troubleshooting.
- Wallet Balances & Portfolio View: While not directly on the Ape.pro swap interface, your connected wallet (e.g., MetaMask) or Ape.pro’s portfolio section will display your current holdings. These numbers represent the quantity of each token you own and their estimated USD value. Monitoring these numbers allows you to track your overall asset allocation and the performance of your individual holdings within the DeFi ecosystem.
- Large Whale Transactions: Some analytics platforms track “whale” transactions (very large transfers or swaps by significant holders). While Ape.pro itself might not highlight this, being aware of such activity through external tools can inform technical decisions, as large movements can signal potential market shifts.
Interpreting these on-chain numbers moves beyond the immediate platform interface into the underlying blockchain infrastructure, offering a more complete technical picture.
Leveraging Advanced Filters and Indicators
For power users, Ape.pro might offer advanced features or integrate with analytics dashboards that allow for deeper data segmentation and analysis.
- Filtering and Sorting Options: When viewing lists of liquidity pools or trading pairs, Ape.pro often provides options to sort by TVL, 24-hour volume, APR, or price change. These numerical filters allow users to quickly identify pools that meet specific technical criteria, such as those with the highest liquidity or the most significant recent activity.
- Historical Data Export: Some platforms allow the export of historical price and volume data. This raw numerical data can then be imported into spreadsheets or statistical software for custom analysis, identifying patterns, testing strategies, or backtesting models, all from a purely technical data perspective.
- API Integration: For developers or highly technical users, Ape.pro (or its underlying protocol) might offer an API (Application Programming Interface). This allows programmatic access to real-time and historical data feeds, enabling custom applications, automated trading bots, or complex data visualization dashboards to be built on top of the platform’s data. This represents the ultimate level of technical engagement with Ape.pro’s numerical output.
Conclusion
Mastering how to read numbers on Ape.pro crypto transforms a potentially confusing interface into a powerful technical dashboard. From the immediate price and volume data that define market sentiment to the intricate mechanics of liquidity pools, slippage, and gas fees, each numerical display holds crucial information. By diligently analyzing these data points—understanding their technical derivation, their implications for transaction execution, and their role in the broader blockchain ecosystem—users can navigate Ape.pro with greater confidence and precision. This comprehensive technical understanding is not merely about identifying trends but about deconstructing the underlying mechanisms of decentralized finance, empowering users to interact with this innovative technology on an informed, strategic, and technically proficient level.
aViewFromTheCave is a participant in the Amazon Services LLC Associates Program, an affiliate advertising program designed to provide a means for sites to earn advertising fees by advertising and linking to Amazon.com. Amazon, the Amazon logo, AmazonSupply, and the AmazonSupply logo are trademarks of Amazon.com, Inc. or its affiliates. As an Amazon Associate we earn affiliate commissions from qualifying purchases.