
In the intricate world of finance, numbers tell a story. But raw figures alone often lack the context needed for truly insightful decision-making. This is where percentages step in, transforming isolated data points into meaningful ratios that illuminate trends, highlight performance, and enable comparisons across diverse financial landscapes. Whether you’re a meticulous personal budgeter, a seasoned investor, or a business executive striving for operational excellence, the ability to calculate and interpret “what percentage is one number of another” is not merely an academic exercise—it is an indispensable skill.
Percentages offer a standardized way to express a part in relation to a whole, providing a universal language for comparison and analysis. They allow us to quickly grasp proportions, growth rates, margins, and distributions, cutting through the noise of absolute numbers to reveal the underlying financial health and trajectory of an entity. From understanding your personal savings rate to dissecting a company’s profit margin, mastering this seemingly simple calculation is the key to unlocking a deeper level of financial literacy and strategic acumen.
The Fundamental Formula: A Cornerstone of Financial Analysis
At its core, the concept of “what percentage is one number of another” is elegantly simple, yet profoundly powerful. It answers the question: “How much of the whole does this part represent?” This fundamental mathematical operation forms the basis for countless financial metrics and indicators, providing a universal standard for comparison.
Deciphering the Percentage Equation
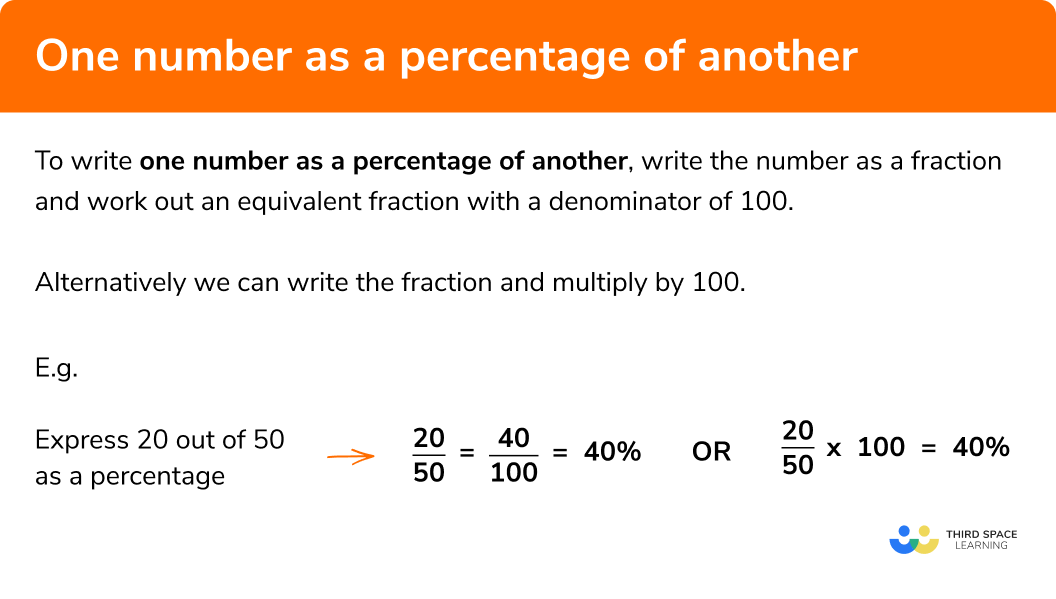
The formula for calculating a percentage is straightforward:
Percentage = (Part / Whole) × 100
Here, the ‘Part’ is the specific number or value you want to express as a percentage, and the ‘Whole’ is the total or base number against which the ‘Part’ is being compared. Multiplying by 100 converts the resulting decimal into a percentage, making it easier to read and understand.
For instance, if you want to know what percentage of your monthly income is spent on housing, your rent payment would be the ‘Part,’ and your total monthly income would be the ‘Whole.’ The resulting percentage offers a clear, immediate understanding of this particular financial commitment relative to your entire earnings. This simple equation, when applied consistently, becomes a powerful tool for dissecting financial statements, evaluating investment performance, and managing personal budgets with precision. It allows stakeholders to transcend the absolute magnitude of numbers and focus on their relative significance, which is often far more telling in a financial context.
Practical Illustrations in Financial Contexts
Let’s explore some initial examples to solidify this concept within a financial framework:
-
Budgeting for Expenses: Imagine your total monthly income is $5,000. If your grocery bill for the month is $750, you calculate: ($750 / $5,000) × 100 = 15%. This tells you that 15% of your income goes towards groceries. This figure is more digestible and comparable than just knowing the $750 absolute amount. It immediately flags whether this expenditure aligns with recommended budgeting guidelines (e.g., the 50/30/20 rule).
-
Understanding Loan Components: Suppose you took out a personal loan for $10,000, and over its lifetime, you will pay $1,500 in interest. To find the percentage of the total repayment that is interest, you consider the total repayment as the “Whole” ($10,000 principal + $1,500 interest = $11,500) and the interest as the “Part.” So, ($1,500 / $11,500) × 100 ≈ 13.04%. This percentage gives you a clear picture of the cost of borrowing relative to the total amount you’ll eventually pay back, helping you compare different loan offers more effectively.
-
Sales Performance: A small business owner wants to know what percentage of their total sales came from a new product line. If total sales were $50,000 and the new product line contributed $15,000, then ($15,000 / $50,000) × 100 = 30%. This insight is invaluable for strategic planning, marketing efforts, and resource allocation within the business. It allows for quick assessment of product line performance against overall business revenue.
These examples underscore how percentages transform raw data into actionable intelligence. They allow for an immediate assessment of proportion, enabling swift comparisons and informed decisions across all facets of financial management.
Key Applications in Personal Finance
For individuals, understanding “what percentage is one number of another” is not just about financial literacy; it’s about financial empowerment. It translates complex financial data into digestible insights that drive smart spending, saving, and investing habits.
Mastering Your Budget and Spending Ratios
Budgeting is arguably the most common and impactful application of percentages in personal finance. Instead of just tracking absolute dollar amounts, which can vary greatly depending on income, percentages provide universal benchmarks for healthy financial habits.
- The 50/30/20 Rule: This popular budgeting guideline suggests allocating 50% of your after-tax income to needs (housing, utilities, groceries), 30% to wants (entertainment, dining out), and 20% to savings and debt repayment. To apply this, you’d calculate: (Cost of Needs / After-Tax Income) × 100. If your housing, utilities, and grocery bills exceed 50%, percentages immediately flag areas for adjustment, enabling you to bring your spending in line with your financial goals.
- Expense Category Analysis: By calculating the percentage of your income spent on specific categories—transportation, dining out, subscriptions—you can pinpoint areas of overspending or identify opportunities to reallocate funds. For instance, if you discover 18% of your income goes to dining out, you might decide to reduce that percentage to free up funds for investment.
Gauging Savings Progress and Debt Health
Percentages are vital for monitoring your progress towards financial goals and assessing the sustainability of your debt.
- Savings Rate: This is a crucial metric, calculated as (Amount Saved / Gross or Net Income) × 100. A high savings rate (e.g., 15-20% or more) accelerates your journey towards financial independence, retirement, or major purchases. Tracking this percentage month-to-month helps you stay motivated and adjust spending if your savings rate dips.
- Debt-to-Income (DTI) Ratio: Lenders frequently use this ratio, calculated as (Total Monthly Debt Payments / Gross Monthly Income) × 100, to assess your ability to manage monthly payments and repay new debts. A DTI ratio below 36% is generally considered healthy, indicating you have sufficient income to cover your obligations. Understanding your DTI is crucial when applying for mortgages or other significant loans, as it directly impacts your eligibility and interest rates.
- Credit Utilization Ratio: For credit cards, this is (Total Credit Used / Total Available Credit) × 100. Keeping this percentage below 30% is often recommended to maintain a good credit score, as higher utilization can signal financial distress to credit bureaus.
Understanding Personal Investment Returns
When it comes to growing wealth, percentages quantify your investment success.
- Return on Investment (ROI): This fundamental metric measures the profitability of an investment. It’s calculated as ((Current Value – Original Cost) / Original Cost) × 100. A 10% ROI on a stock means your investment has grown by ten percent relative to its initial value. This allows for direct comparison of different investment vehicles (stocks, bonds, real estate) regardless of their initial cost.
- Portfolio Allocation: Managing risk and reward often involves diversifying your investments across different asset classes. You might allocate 60% of your portfolio to stocks, 30% to bonds, and 10% to real estate. These percentages help maintain your desired risk profile and ensure proper diversification. Regularly reviewing and rebalancing these percentages is key to long-term investment success.
Essential for Business Finance and Operations
In the corporate world, the ability to calculate and interpret percentages is not just a desirable skill—it’s a critical requirement for assessing performance, making strategic decisions, and communicating financial health to stakeholders. From the smallest startup to multinational corporations, percentage-based metrics are the language of business finance.
Profitability Metrics: Gross, Operating, and Net Margins
Profitability ratios are perhaps the most common and vital percentage applications in business. They reveal how efficiently a company converts revenue into profit.
- Gross Profit Margin: Calculated as ((Revenue – Cost of Goods Sold) / Revenue) × 100, this percentage shows the profit a company makes from each sale after deducting the direct costs of producing goods or services. A higher gross margin indicates efficient production or strong pricing power.
- Operating Profit Margin: This takes it a step further: ((Operating Income / Revenue) × 100). It measures how much profit a company makes from its core operations before interest and taxes, reflecting operational efficiency and management effectiveness.
- Net Profit Margin: The ultimate profitability measure: ((Net Income / Revenue) × 100). This percentage indicates the portion of revenue left after all expenses, including taxes and interest, have been deducted. It’s a key indicator of a company’s overall financial health and ability to generate value for shareholders.
These margins allow businesses to benchmark their performance against competitors, identify areas for cost reduction, and make informed pricing decisions.
Measuring Growth and Market Penetration
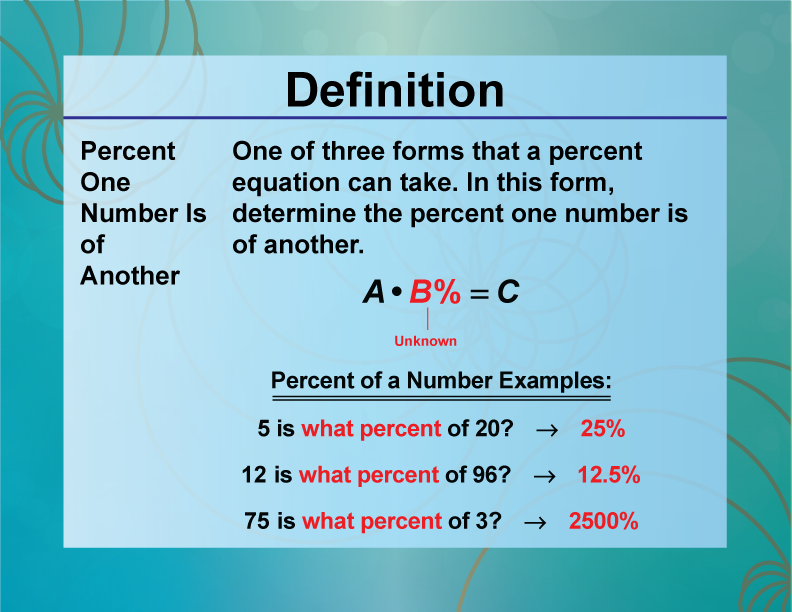
Percentages are indispensable for tracking growth and understanding a company’s position within its industry.
- Revenue Growth Rate: Calculated as ((Current Period Revenue – Prior Period Revenue) / Prior Period Revenue) × 100, this percentage measures how much a company’s sales have increased over a specific period. Positive growth rates are essential for attracting investors and demonstrating market acceptance.
- Market Share: (Company Sales / Total Industry Sales) × 100. This percentage indicates the portion of a total market’s sales generated by a specific company. A growing market share suggests increasing competitive advantage and brand dominance.
- Conversion Rates: (Number of Conversions / Number of Visitors or Leads) × 100. This is crucial for marketing and sales, measuring the effectiveness of campaigns, website performance, or sales processes. For example, if 100 visitors come to an e-commerce site and 5 make a purchase, the conversion rate is 5%.
Optimizing Expense Management and Resource Allocation
Controlling costs and allocating resources effectively are paramount for business sustainability, and percentages provide the necessary framework.
- Expense-to-Revenue Ratio: ((Specific Expense / Revenue) × 100). Businesses track these ratios for various costs, such as marketing expenses, administrative overhead, or research and development. If marketing expenses rise from 5% to 10% of revenue without a corresponding increase in sales, it signals a potential inefficiency.
- Labor Cost Percentage: (Total Labor Costs / Total Revenue) × 100. This helps businesses understand the proportion of their revenue dedicated to employee compensation, a significant cost for many industries.
- Capital Expenditure as a Percentage of Revenue: This can indicate how much a company is investing back into its assets for future growth, balancing short-term profits with long-term expansion.
By meticulously tracking these percentage-based metrics, businesses can identify trends, forecast future performance, make data-driven decisions about pricing, operational efficiency, and strategic investments.
Driving Investment Decisions with Percentage Insights
For investors, percentages are the language of performance, risk, and diversification. They allow for an objective assessment of investment opportunities, enable comparisons across different asset classes, and provide crucial insights into portfolio health. Without percentage analysis, making informed investment decisions would be akin to navigating a maze blindfolded.
Portfolio Allocation and Diversification
A well-constructed investment portfolio is often defined by its percentage allocations. Diversification—spreading investments across various assets—is a cornerstone of risk management, and percentages are the tools to achieve it.
- Asset Allocation: This refers to the percentage of your portfolio invested in different asset classes like stocks, bonds, real estate, and cash. A common strategy might be 70% stocks, 25% bonds, and 5% cash, tailored to an investor’s risk tolerance and time horizon. These percentages are dynamic and require periodic rebalancing to maintain the desired risk profile. If stocks perform exceptionally well, their percentage within the portfolio might grow, necessitating selling some stocks to buy other assets and return to the target allocation.
- Sector or Industry Allocation: Within equity holdings, investors might allocate percentages to different economic sectors (e.g., technology, healthcare, financials) to avoid overexposure to any single industry and capture opportunities across the market.
- Geographic Allocation: Similarly, percentages can define investments across different countries or regions to benefit from global growth and mitigate country-specific risks.
Evaluating Investment Performance: ROI, CAGR, and Yields
Percentages are the universal standard for measuring and comparing investment returns.
- Return on Investment (ROI): As mentioned earlier, ROI provides a direct percentage measure of an investment’s gain or loss relative to its initial cost. It’s a foundational metric for assessing profitability.
- Compound Annual Growth Rate (CAGR): For investments over multiple years, CAGR provides a smoothed, annualized rate of return, accounting for compounding. This percentage allows investors to compare the performance of investments with different lifespans on an apples-to-apples basis. For example, an investment that grew 100% over five years has a CAGR of approximately 14.87%, a more realistic measure of its average yearly growth.
- Dividend Yield: For income-generating investments like stocks or bonds, dividend yield ((Annual Dividends Per Share / Stock Price Per Share) × 100) tells investors what percentage of their investment they receive back annually in dividends. This is crucial for income-focused portfolios.
- Expense Ratios (for Mutual Funds/ETFs): This percentage represents the annual cost of operating a fund, expressed as a percentage of your investment. Lower expense ratios mean more of your money is working for you, directly impacting your net returns.
Risk Assessment through Percentage Analysis
Percentages also play a critical role in understanding and managing investment risk.
- Volatility: Measures like Beta (a stock’s volatility relative to the market) are often expressed as a percentage or ratio derived from percentage changes.
- Drawdowns: The percentage decline from a peak to a trough in an investment’s value. Understanding historical maximum drawdowns helps investors gauge potential downside risk.
- Probability of Loss: While harder to quantify precisely, models often use percentage likelihoods to discuss various market scenarios and their potential impact on a portfolio.
By leveraging these percentage-based insights, investors can make more informed decisions, aligning their investments with their financial objectives and risk tolerance, and ultimately working towards greater wealth accumulation.
Common Pitfalls and Best Practices in Percentage Analysis
While percentages are immensely powerful, their misapplication or misinterpretation can lead to flawed conclusions and detrimental financial decisions. Mastering percentage analysis requires not just calculation, but also a nuanced understanding of context and common pitfalls.
The Importance of Context and Base Numbers
The most frequent error in percentage analysis is overlooking the base number—the ‘Whole’ in our formula. A large percentage change can appear significant, but if the base number is very small, the absolute impact might be negligible. Conversely, a small percentage change on a very large base can represent a substantial absolute value.
- Example: A 50% increase in sales from $100 to $150 is less impactful than a 5% increase from $1 million to $1.05 million. While the former is a higher percentage, the latter represents a far greater absolute gain. Always consider the absolute numbers alongside the percentages to gain a complete picture.
- Misleading Comparisons: Comparing percentages from different base periods or with different methodologies can be misleading. Ensure that the ‘Whole’ is consistently defined when making comparisons over time or between different entities.
Avoiding Misinterpretations: Percentage Points vs. Percentage Change
This is a subtle but critical distinction, particularly in financial news and economic reporting.
- Percentage Change: Refers to the relative change between two numbers, calculated using our standard formula. E.g., if an interest rate goes from 2% to 3%, that’s a (3-2)/2 * 100 = 50% increase in the interest rate.
- Percentage Points (or Basis Points): Refers to the absolute numerical difference between two percentages. If an interest rate goes from 2% to 3%, that’s an increase of 1 percentage point (3% – 2% = 1%). This is not the same as a 1% increase.
Confusing these can lead to drastically different interpretations of data, especially in discussions about interest rates, inflation, or economic growth figures. Always be clear about which measure is being used to avoid miscommunication and erroneous conclusions.
Leveraging Technology for Accurate Calculations
While manual calculations are useful for understanding the concept, real-world financial analysis often involves large datasets where manual computation is impractical and prone to error.
- Spreadsheets (Excel, Google Sheets): These are indispensable tools for financial analysis. They allow users to quickly apply percentage formulas to columns of data, create dynamic reports, and visualize trends. Functions like
PERCENTAGE,GROWTH, and simple division are powerful for financial modeling. - Financial Calculators and Software: Many online calculators and dedicated financial software offer built-in percentage functions for complex scenarios, such as calculating compound annual growth rates, loan payments, or investment returns.
- Business Intelligence (BI) Tools: For corporate finance, BI platforms integrate data from various sources and offer advanced analytical capabilities, including automated percentage calculations and sophisticated visualizations, to provide real-time financial insights.
By understanding the formula, applying critical thinking, being mindful of context, and leveraging appropriate technological tools, individuals and businesses can harness the full power of percentage analysis to make superior financial decisions.

Conclusion
The seemingly simple question, “what percentage is one number of another,” unlocks a universe of financial understanding. From the granular details of a personal budget to the sweeping narratives of corporate profitability and investment performance, percentages provide the essential framework for intelligent financial assessment. They standardize comparisons, reveal hidden trends, quantify risk, and ultimately empower individuals and organizations to make informed, strategic decisions.
Mastering this fundamental calculation moves beyond mere arithmetic; it cultivates a crucial analytical mindset. By consistently applying percentage analysis, you gain the ability to dissect financial data, interpret complex relationships, and communicate financial insights with clarity and confidence. In an increasingly data-driven world, embracing the power of percentages is not just a skill—it’s a prerequisite for financial success and a cornerstone of effective money management.
aViewFromTheCave is a participant in the Amazon Services LLC Associates Program, an affiliate advertising program designed to provide a means for sites to earn advertising fees by advertising and linking to Amazon.com. Amazon, the Amazon logo, AmazonSupply, and the AmazonSupply logo are trademarks of Amazon.com, Inc. or its affiliates. As an Amazon Associate we earn affiliate commissions from qualifying purchases.