What is the Percent Increase Between Two Numbers?
In the dynamic world of finance, from personal budgeting to corporate strategy, understanding growth and change is paramount. Whether you’re tracking the performance of an investment portfolio, analyzing sales figures, or deciphering economic reports, the ability to quantify change is a foundational skill. Among the various metrics used to measure this evolution, the “percent increase” stands out as an indispensable tool. It provides a standardized, easily digestible measure of how much a quantity has grown relative to its initial value, offering far more insight than a simple absolute difference. For anyone navigating the complexities of money, from individual investors to seasoned financial analysts, mastering the calculation and interpretation of percent increase is not merely an academic exercise; it is a critical skill for informed decision-making, strategic planning, and accurately assessing financial health and opportunity. This article delves into the core concept of percent increase, its calculation, and its widespread applications in the realm of money.
Understanding the Fundamentals of Percent Increase
At its heart, percent increase is a simple yet powerful mathematical concept designed to express the magnitude of change between two values as a proportion of the original value. It normalizes growth, allowing for meaningful comparisons even when the absolute numbers involved are vastly different. Without it, comparing a $100 profit increase on a $1,000 investment to a $1,000 profit increase on a $1,000,000 investment would be misleading; the former represents a 10% gain, while the latter is a mere 0.1% gain. Percent increase cuts through this ambiguity, providing a clear, relative picture of growth.
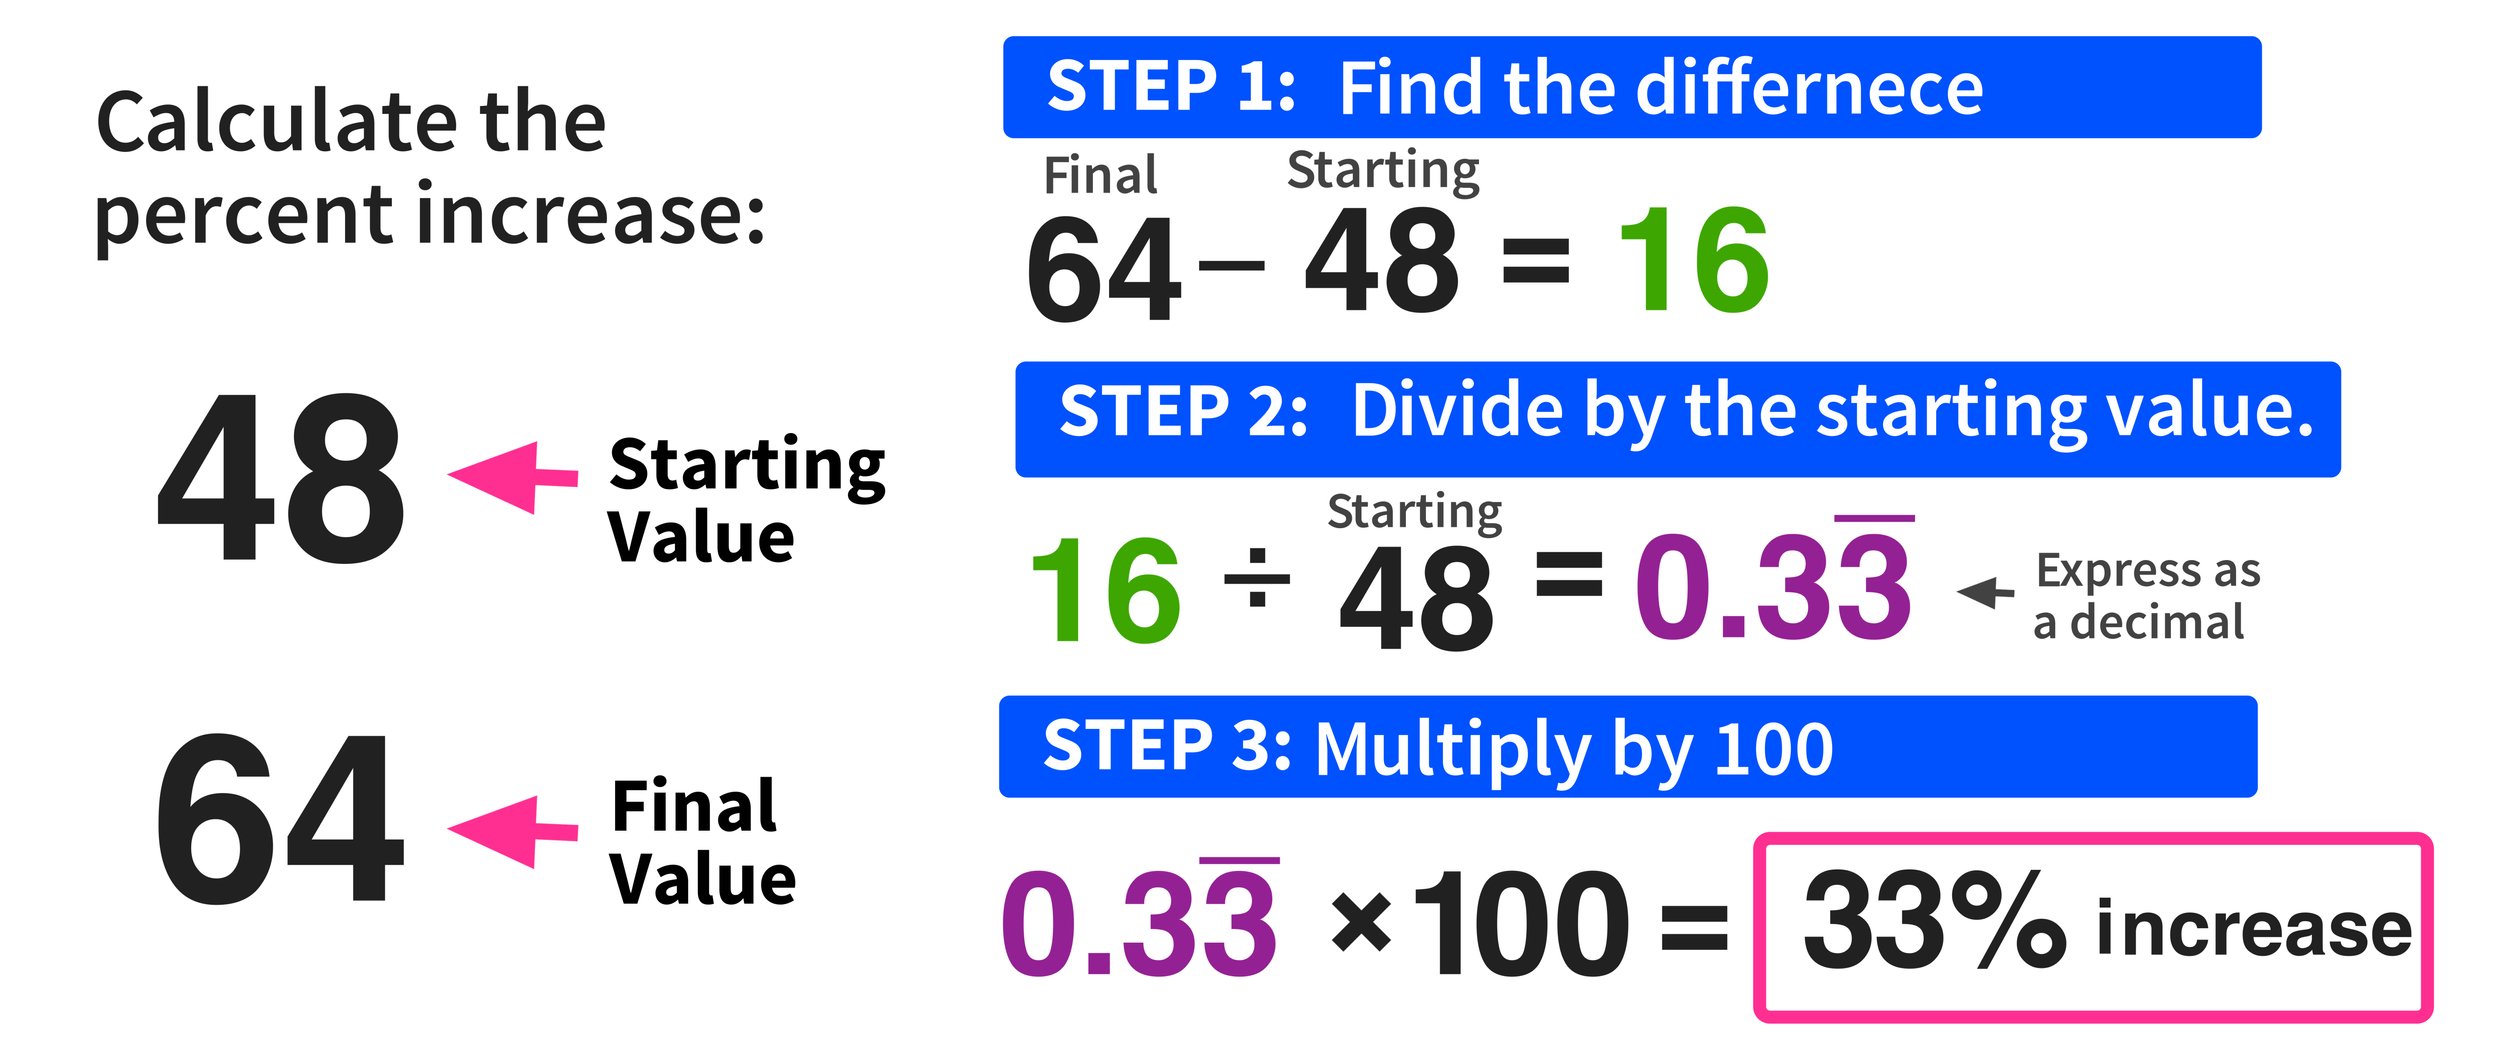
The Basic Formula: Step-by-Step Calculation
Calculating percent increase involves a straightforward two-step process that can be applied across a myriad of financial scenarios.
The formula is as follows:
Percent Increase = ((New Value – Original Value) / Original Value) * 100%
Let’s break down the steps with an example relevant to finance:
-
Find the Difference: Subtract the original value from the new value. This gives you the absolute amount of the increase.
- Example: If your investment portfolio grew from $10,000 (Original Value) to $12,000 (New Value).
- Difference = $12,000 – $10,000 = $2,000
-
Divide by the Original Value: Take the difference you calculated in step one and divide it by the original value. This converts the absolute increase into a decimal representation of the growth relative to the starting point.
- Example: $2,000 / $10,000 = 0.20
-
Multiply by 100: To express this decimal as a percentage, multiply the result by 100.
- Example: 0.20 * 100 = 20%
Thus, the investment portfolio experienced a 20% increase. This method ensures that the percentage increase is always calculated relative to the starting point, providing a consistent and interpretable metric.
Why Percentages Matter More Than Absolute Numbers
While absolute numbers provide raw data, percentages offer context and comparability. In financial analysis, context is king. A $50,000 increase in revenue sounds impressive on its own, but its significance drastically changes if the original revenue was $100,000 (a 50% increase) versus $5,000,000 (a 1% increase). Percentages enable:
- Standardized Comparison: You can compare the growth rate of a small startup to a multinational corporation, or the performance of different asset classes, without being misled by their differing scales.
- Performance Evaluation: Easily assess if a financial goal has been met, if an investment strategy is working, or if a business unit is growing at an acceptable rate.
- Trend Analysis: Identify patterns and project future performance by observing consistent percentage changes over time.
- Simplified Communication: Percentages are a universal language in finance, allowing complex financial changes to be communicated concisely and effectively to stakeholders, investors, or even just for personal understanding.
Applications in Personal Finance and Investing
For individuals, percent increase is a cornerstone of financial literacy, enabling smarter decisions about savings, investments, and spending. It transforms raw numbers into actionable insights.
Tracking Investment Growth and Portfolio Performance
One of the most common and vital applications of percent increase in personal finance is evaluating investment returns. Investors are constantly trying to understand if their money is working hard enough for them.
- Individual Stock/Asset Performance: If you bought a stock at $50 and it’s now $65, that’s a 30% increase. This helps you compare its performance against other stocks or market benchmarks.
- Portfolio Growth: Monitoring the overall growth of your entire investment portfolio is crucial. If your portfolio value increased from $50,000 to $53,500 over a year, you’ve achieved a 7% return. This metric is essential for assessing the effectiveness of your investment strategy and making adjustments.
- Compound Interest: The magic of compound interest relies heavily on percentage increases. Understanding how a small percentage gain on your initial capital, then on your capital plus the previous gains, leads to exponential growth over time is fundamental to long-term wealth building.
Analyzing Salary Increases and Budget Adjustments
Percent increase is not just for investments; it’s directly applicable to your everyday income and expenditure.
- Salary Negotiations: Knowing the percentage increase in your salary helps you understand its real value. A $5,000 raise might sound good, but if your previous salary was $50,000, it’s a 10% raise. If it was $100,000, it’s a 5% raise. This context is vital for assessing compensation fairness and negotiating power.
- Budgeting and Expense Control: When managing personal budgets, you might see an increase in utility bills or grocery costs. Calculating the percent increase helps you identify which categories are growing fastest and where you might need to cut back. For example, if your electricity bill went from $80 to $100, that’s a 25% increase – a significant jump warranting investigation.
- Debt Reduction: Conversely, you might analyze the percentage decrease in your debt to track progress towards financial freedom.
Understanding Inflation and Cost of Living Changes
Inflation is a pervasive financial force that erodes purchasing power over time. Percent increase is the primary tool used to measure it.
- Consumer Price Index (CPI): Governments and economists use percent increase to report changes in the CPI, which measures the average change over time in the prices paid by urban consumers for a market basket of consumer goods and services. A 3% annual increase in CPI means your cost of living has generally risen by 3%.
- Real vs. Nominal Returns: Understanding inflation allows you to differentiate between nominal returns (the actual percentage increase of your investment) and real returns (your investment’s percentage increase after accounting for inflation). A 5% investment gain in a year with 3% inflation means your real purchasing power only increased by approximately 2%. This distinction is critical for evaluating true financial progress.
Leveraging Percent Increase in Business and Financial Analysis
In the corporate world, percent increase is an indispensable metric for strategic planning, performance evaluation, and investor relations. It provides a common language for measuring growth across departments, products, and markets.
Measuring Sales Growth and Revenue Expansion
For any business, revenue growth is a key indicator of health and market acceptance. Percent increase offers a clear way to track this.
- Quarter-over-Quarter (QoQ) or Year-over-Year (YoY) Growth: Businesses routinely report their sales or revenue growth as a percentage. An announcement of “20% year-over-year revenue growth” gives investors and stakeholders a concise understanding of the company’s expansion compared to the previous period.
- Product Line Performance: Companies can use percent increase to compare the growth of different product lines or services, identifying high-performers and areas needing attention. If Product A grew by 15% but Product B by only 2%, it informs resource allocation decisions.
- Market Share Analysis: By tracking the percentage increase in their own sales relative to the overall market sales, businesses can gauge changes in their market share, a critical competitive metric.
Evaluating Profit Margins and Operational Efficiency
Beyond just revenue, businesses need to understand how effectively they are converting that revenue into profit.
- Gross Profit Margin Growth: If a company’s gross profit (revenue minus cost of goods sold) increased by 10% while revenue only grew by 5%, it suggests improved operational efficiency or pricing power.
- Net Income Growth: The ultimate measure of profitability, the percentage increase in net income (the “bottom line”), is a closely watched metric by investors, signaling the company’s ability to generate value for shareholders.
- Expense Control: Conversely, businesses might monitor the percentage increase in various operating expenses (e.g., marketing, administration) to ensure they are not growing disproportionately to revenue, which could erode profitability.
Interpreting Market Share and Economic Indicators
Percent increase is also vital for macro-level financial analysis and understanding broader economic trends.
- GDP Growth: Gross Domestic Product (GDP) growth is almost universally reported as a percentage increase, indicating the health and expansion of an economy. A 2% GDP growth rate signifies a different economic climate than a 0.5% growth rate.
- Interest Rate Changes: Central banks often announce interest rate adjustments as percentage points. Understanding how these small percentage shifts can trigger significant percent increases or decreases in borrowing costs or investment returns is crucial for businesses and individuals.
- Stock Market Indices: The performance of major stock market indices (e.g., S&P 500, Dow Jones) is always communicated through percentage changes, reflecting investor sentiment and overall market health. A “market up 1.5% today” tells a clear story.
Common Pitfalls and Best Practices
While simple in concept, misinterpreting percent increase can lead to flawed conclusions in financial analysis. Awareness of common pitfalls and adherence to best practices are crucial.
The Importance of Context and Baseline
The meaning of a percent increase is heavily dependent on the context and the original value (baseline).
- Small Base, Large Percentage: A 100% increase sounds phenomenal, but if a company’s profit went from $1 to $2, it’s a 100% increase, but the absolute gain is negligible. Conversely, a 1% increase on a $1 billion revenue stream is a significant absolute gain of $10 million. Always consider the absolute numbers alongside the percentages.
- Beware of “Percent of a Percent”: If a tax rate increases from 10% to 11%, that’s not a 1% increase in the tax rate. It’s a 1 percentage point increase. The percent increase in the tax rate itself is ((11-10)/10) * 100 = 10%. Distinguishing between percentage points and percent increase is vital for accuracy, especially when dealing with rates or ratios.
- Time Period Consistency: When comparing growth rates, ensure you are using consistent time periods (e.g., year-over-year vs. quarter-over-quarter). Mixing these can lead to misleading comparisons.
Avoiding Misinterpretation: When Small Percentages are Significant
Sometimes, a seemingly small percentage increase can have massive financial implications.
- Interest Rate Hikes: A 0.25% increase in a mortgage interest rate might seem minor, but over 30 years on a large loan, it can translate to thousands of dollars in extra payments.
- Inflation: A consistent 2-3% annual inflation rate, while appearing small each year, can significantly erode purchasing power over a decade or two.
- Large-Scale Investments: For institutional investors managing billions, even a fractional percentage point difference in investment returns can equate to millions in additional profit or loss.
Therefore, financial professionals must cultivate a nuanced understanding, looking beyond the raw percentage to grasp its true impact within its specific financial environment.
Tools and Techniques for Calculating Percent Increase
While the manual calculation is straightforward, financial professionals and individuals alike benefit from leveraging technology to streamline these calculations, especially when dealing with large datasets or complex models.
Using Spreadsheets for Financial Analysis
Spreadsheet software like Microsoft Excel or Google Sheets are indispensable tools for financial calculations, including percent increase.
- Simple Formulas: You can directly input the formula:
=(New_Value - Old_Value) / Old_Valueand then format the cell as a percentage. - Automated Tracking: For ongoing analysis, you can set up tables where new values are entered, and the percentage increase (and other metrics) automatically update, allowing for real-time tracking of investments, sales, or expenses.
- Scenario Planning: Spreadsheets allow you to quickly model different scenarios (e.g., “what if sales increase by 15% vs. 10%?”) by adjusting values and observing the resulting percentage changes.
Quick Mental Math and Estimation
For quick assessments, especially in dynamic environments like stock trading or budget reviews, being able to mentally estimate percent increases can be highly beneficial.
- Rule of Thumb: For small percentages, a rough estimate can be made. For example, if something goes from 100 to 105, that’s a 5% increase. If it goes from 200 to 210, that’s also a 5% increase (10 is 5% of 200).
- Halving/Doubling: A 50% increase means adding half of the original value. A 100% increase means doubling the original value. These simple relationships can speed up mental calculations.
While not as precise as a calculator or spreadsheet, mental estimation provides a valuable “sense check” and allows for rapid, on-the-fly financial insights.
In conclusion, the concept of “percent increase” is far more than a mathematical formula; it is a fundamental pillar of financial understanding and analysis. From tracking personal savings growth and deciphering inflation to evaluating corporate performance and economic indicators, its consistent application empowers individuals and organizations to make informed, data-driven decisions. By understanding its calculation, appreciating its contextual significance, and leveraging appropriate tools, anyone involved with money can gain a clearer, more insightful perspective on growth, change, and opportunity.
aViewFromTheCave is a participant in the Amazon Services LLC Associates Program, an affiliate advertising program designed to provide a means for sites to earn advertising fees by advertising and linking to Amazon.com. Amazon, the Amazon logo, AmazonSupply, and the AmazonSupply logo are trademarks of Amazon.com, Inc. or its affiliates. As an Amazon Associate we earn affiliate commissions from qualifying purchases.