
In the intricate world of finance, numbers tell a story, and percentages are the crucial narrative device that gives these stories meaning. From personal budgeting and investment analysis to understanding market trends and corporate profitability, the ability to accurately calculate and interpret percentages between two numbers is not just a useful skill—it is a fundamental pillar of financial literacy. This article delves into the mechanics of percentage calculation, framed exclusively through the lens of personal finance, investing, business finance, and the various financial tools that underpin our economic lives. Understanding this mathematical cornerstone empowers individuals and businesses alike to make informed, strategic financial decisions, unlocking deeper insights into performance, growth, and potential.

The Foundational Role of Percentages in Finance
Percentages provide a standardized way to express a part of a whole, or a change relative to an initial value, making disparate financial figures comparable and comprehensible. Without them, deciphering the true impact of an interest rate, the performance of an investment portfolio, or the efficiency of a business operation would be a daunting, if not impossible, task. In finance, raw numbers alone often lack the context needed for meaningful analysis; percentages supply that vital context.
What Exactly is a Percentage?
At its simplest, a percentage represents a fraction out of 100. The term “percent” literally means “per hundred” or “out of one hundred.” For instance, 25% signifies 25 parts out of a total of 100. In financial terms, this could mean 25% of your income goes towards housing, or a stock has gained 25% of its initial value. This universal language allows for easy comparison, whether you’re contrasting the returns of two different investment funds or evaluating the proportion of debt in two companies’ capital structures. It transforms complex numerical relationships into an easily digestible format, crucial for quick assessments and long-term planning.
Why Financial Professionals Rely on Percentages
Financial professionals across all sectors—from wealth managers and loan officers to corporate analysts and small business owners—rely heavily on percentages for a myriad of reasons. They enable:
- Standardized Comparison: You can compare the profit margin of a small startup to that of a multinational corporation, even though their raw revenue figures are vastly different.
- Performance Measurement: Investment returns, sales growth, and expense ratios are almost universally expressed as percentages to gauge efficiency and effectiveness.
- Risk Assessment: Debt-to-equity ratios, loan-to-value ratios, and credit utilization rates are all percentage-based metrics that help assess financial stability and risk.
- Budgeting and Allocation: Personal and corporate budgets are often planned and managed by allocating a percentage of income or revenue to various categories.
- Inflation and Economic Analysis: Economic indicators like inflation rates, GDP growth, and unemployment rates are primarily communicated through percentages to illustrate trends and changes over time.
This reliance underscores the necessity of not just knowing what a percentage is, but mastering how to calculate and interpret it in various financial contexts.
Core Calculations: The Mechanics of Percentage Determination
Understanding the basic formulas for calculating percentages is the bedrock of financial analysis. These core calculations empower you to dissect financial statements, evaluate investment opportunities, and manage personal finances with greater precision.
Calculating a Basic Percentage (Part of a Whole)
The most fundamental percentage calculation involves determining what proportion one number represents of another. This is often used to understand how much of your total income goes to a specific expense, or what portion of your investment portfolio is allocated to a particular asset class.
The formula is:
(Part / Whole) × 100 = Percentage (%)
Example: Budget Allocation
Let’s say your monthly take-home income (the “Whole”) is $4,000. You spend $1,200 (the “Part”) on rent.
- ($1,200 / $4,000) × 100 = 0.30 × 100 = 30%
This means 30% of your income is allocated to rent. This insight is crucial for personal budgeting and ensuring your expenses align with your financial goals.
Example: Portfolio Composition
If your total investment portfolio (the “Whole”) is valued at $50,000, and your holdings in tech stocks (the “Part”) amount to $15,000.
- ($15,000 / $50,000) × 100 = 0.30 × 100 = 30%
So, 30% of your portfolio is invested in tech stocks, providing valuable insight into your asset allocation and diversification strategy.
Understanding Percentage Change: Growth and Decline
Beyond determining a part of a whole, percentages are vital for measuring change over time—specifically, growth (percentage increase) or decline (percentage decrease). This is indispensable for tracking investment returns, sales performance, expense reduction, or the impact of economic trends.
The general formula for percentage change is:
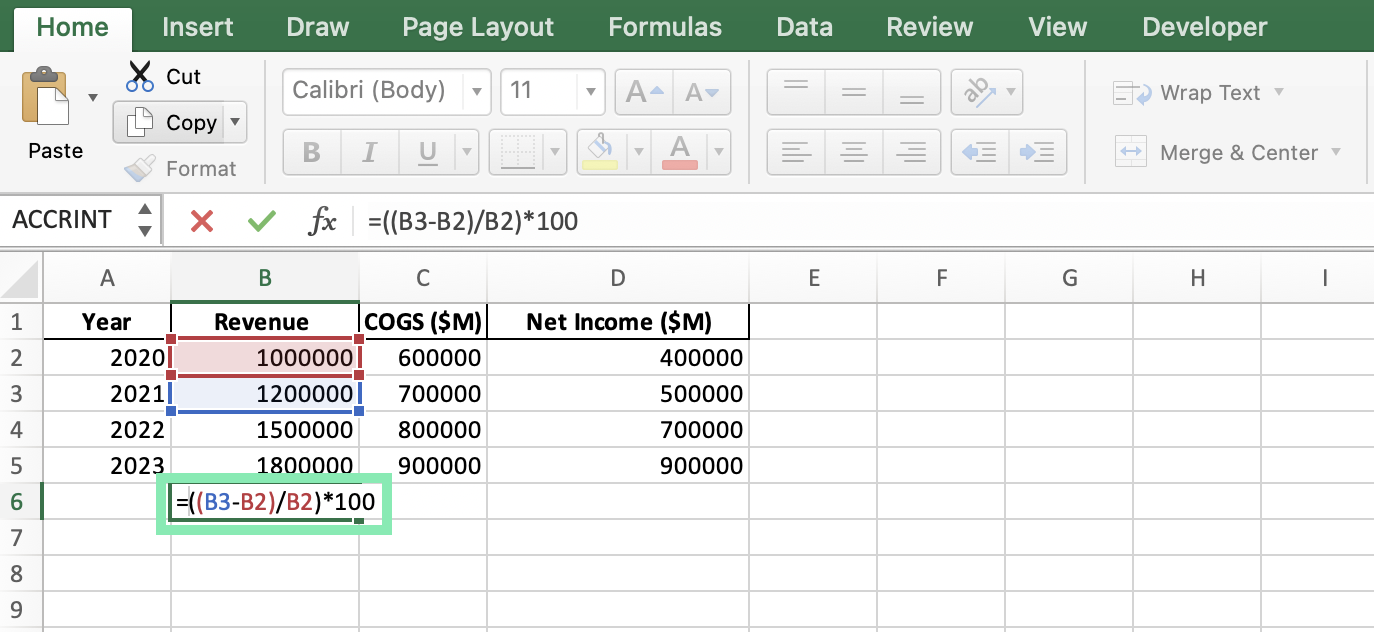
((New Value – Old Value) / Old Value) × 100 = Percentage Change (%)
Percentage Increase: Tracking Gains
When the new value is greater than the old value, you have a percentage increase.
Example: Investment Growth
You invested $10,000 (Old Value) in a stock, and it grew to $12,500 (New Value) over a year.
- (($12,500 – $10,000) / $10,000) × 100 = ($2,500 / $10,000) × 100 = 0.25 × 100 = 25%
Your investment saw a 25% increase, indicating a positive return on investment (ROI).
Percentage Decrease: Monitoring Losses or Discounts
When the new value is less than the old value, you have a percentage decrease.
Example: Asset Depreciation
A piece of business equipment was purchased for $5,000 (Old Value) and is now valued at $4,000 (New Value) after a year of use.
- (($4,000 – $5,000) / $5,000) × 100 = (-$1,000 / $5,000) × 100 = -0.20 × 100 = -20%
The equipment has depreciated by 20%. The negative sign indicates a decrease.
Example: Sales Decline
A small business had monthly sales of $20,000 (Old Value) but saw sales drop to $18,000 (New Value) the following month.
- (($18,000 – $20,000) / $20,000) × 100 = (-$2,000 / $20,000) × 100 = -0.10 × 100 = -10%
Sales decreased by 10%, flagging a potential issue for the business owner to investigate.
Advanced Applications: Leveraging Percentages for Strategic Financial Decisions
Beyond basic calculations, percentages form the backbone of more complex financial models and metrics, enabling strategic planning and deeper financial insights.
Compound Interest and Investment Growth
Compound interest, often hailed as the “eighth wonder of the world,” relies entirely on percentage calculations. It’s interest calculated on the initial principal and also on the accumulated interest from previous periods. Understanding this is vital for retirement planning, savings goals, and evaluating loans.
Example: Retirement Savings
If you invest $10,000 at an annual compound interest rate of 7%, after one year, your investment grows by 7% ($700), reaching $10,700. In the second year, the 7% is calculated on $10,700, not just the original $10,000. This exponential growth, driven by percentage calculations, highlights the power of long-term investing. Similarly, mortgage interest rates, credit card APRs, and loan interest are all percentage-based calculations that significantly impact your financial obligations.
Profit Margins and Business Performance
For businesses, percentages are paramount for assessing operational efficiency and financial health. Profit margins are expressed as percentages and indicate how much profit a company makes for every dollar of revenue.
- Gross Profit Margin: (Gross Profit / Revenue) × 100. This shows the percentage of revenue left after subtracting the cost of goods sold. A higher percentage indicates more efficient production.
- Operating Profit Margin: (Operating Income / Revenue) × 100. This reveals the percentage of revenue remaining after covering operational expenses.
- Net Profit Margin: (Net Income / Revenue) × 100. This is the ultimate measure of profitability, showing the percentage of revenue that converts into net profit after all expenses, including taxes and interest.
Comparing these percentages year-over-year or against industry benchmarks provides critical insights into a company’s financial trajectory and competitive standing.
Discounts, Markups, and Retail Pricing
In retail and sales, percentages are used daily for pricing strategies, promotions, and understanding consumer behavior.
Example: Applying a Discount
A product priced at $200 is offered with a 25% discount.
- Discount amount = 25% of $200 = 0.25 × $200 = $50.
- New price = $200 – $50 = $150.
Understanding this allows consumers to quickly grasp savings and businesses to effectively price promotions.
Example: Calculating a Markup
A retailer buys an item for $50 and wants to apply a 40% markup to the cost.
- Markup amount = 40% of $50 = 0.40 × $50 = $20.
- Selling price = $50 + $20 = $70.
This ensures the business covers costs and achieves its desired profit targets.
Avoiding Common Pitfalls and Ensuring Accuracy
While percentages seem straightforward, misinterpretations or errors in calculation can lead to significant financial mistakes. Awareness of common pitfalls is key to accurate analysis.
The Importance of the ‘Base’ Number
One of the most frequent errors is misidentifying the “whole” or the “old value” (the base number) in a percentage calculation. The base number determines the context and magnitude of the percentage.
Example: Percentage of Total Assets vs. Percentage of Specific Investment
If you have $100,000 in total assets and a $10,000 investment in Company A, which loses $2,000.
- The loss is 20% of the specific investment in Company A (($2,000/$10,000) * 100).
- However, the loss is only 2% of your total assets (($2,000/$100,000) * 100).
Confusing these bases can lead to an overestimation or underestimation of the impact of a financial event on your overall financial health. Always be clear about what your percentage is of.
Percentage Points vs. Percentage Change
This distinction is crucial, particularly when discussing interest rates or market share.
Example: Interest Rate Fluctuations
If an interest rate increases from 4% to 5%:
- The increase is 1 percentage point (5% – 4% = 1%).
- However, the percentage change in the interest rate is ((5% – 4%) / 4%) × 100 = (1% / 4%) × 100 = 25%.
Stating that the rate increased by “25%” sounds much more dramatic than “1 percentage point,” but both are technically correct depending on what you’re measuring. Financial news often leverages this distinction, so understanding it prevents misinterpretation of critical data.
Practical Tools and Resources for Financial Percentage Calculations
In today’s digital age, you don’t always need to perform complex percentage calculations manually. Various tools simplify the process, enhancing both speed and accuracy.
Utilizing Spreadsheets and Financial Calculators
For personal finance and business operations, spreadsheet software like Microsoft Excel or Google Sheets are invaluable. They allow you to set up formulas once and apply them to vast datasets, automating percentage calculations for budgeting, investment tracking, sales analysis, and more. Dedicated financial calculators, whether physical devices or online apps, also offer specialized functions for interest rates, loan amortizations, and investment growth, often incorporating percentage logic. Mastering basic spreadsheet functions like = (A2/B2)*100 or = (B2-A2)/A2*100 is a powerful skill for anyone navigating the financial landscape.

Learning through Real-World Financial Scenarios
The best way to solidify your understanding of percentages in finance is through consistent application. Practice calculating:
- Your monthly expense percentages.
- The year-over-year growth of your investment portfolio.
- The discount percentage on sales items.
- The interest paid on a loan.
Engaging with these real-world financial scenarios will not only reinforce your mathematical skills but also deepen your financial literacy, empowering you to make more astute and confident financial decisions in all aspects of your life.
aViewFromTheCave is a participant in the Amazon Services LLC Associates Program, an affiliate advertising program designed to provide a means for sites to earn advertising fees by advertising and linking to Amazon.com. Amazon, the Amazon logo, AmazonSupply, and the AmazonSupply logo are trademarks of Amazon.com, Inc. or its affiliates. As an Amazon Associate we earn affiliate commissions from qualifying purchases.