
In the intricate world of finance, percentages serve as a universal language, quantifying everything from investment returns to loan interest, and from budget allocations to economic growth. Understanding “how to obtain a percentage” is not merely a mathematical exercise; it is a fundamental skill that empowers individuals and businesses to make informed decisions, analyze trends, and navigate the complex landscape of personal and business finance. This article delves into the core principles of calculating percentages, explores their myriad applications across financial domains, and equips you with the knowledge to leverage this essential tool for greater financial fluency and strategic planning.

Understanding the Foundation: What is a Percentage?
At its heart, a percentage represents a proportion or a fraction of a whole, expressed as a number out of 100. The term “percent” itself is derived from the Latin phrase “per centum,” meaning “by the hundred.” This standardized way of expressing parts of a whole allows for easy comparison and understanding, regardless of the original total amount.
The Basic Formula for Percentage Calculation
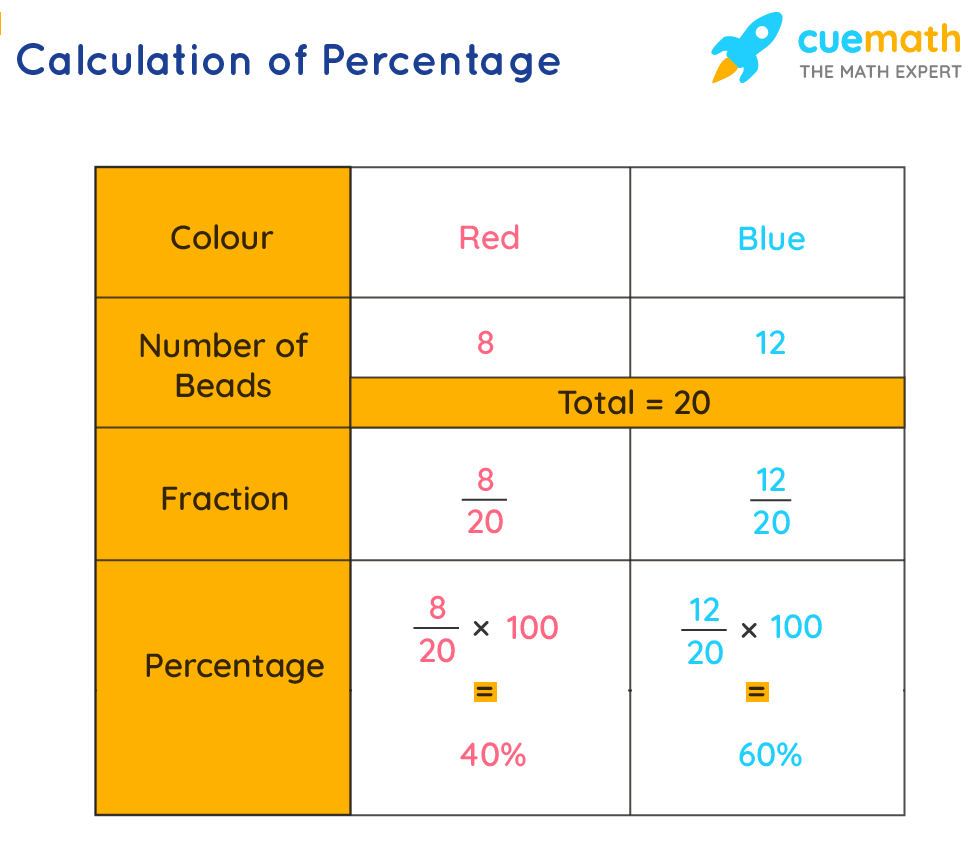
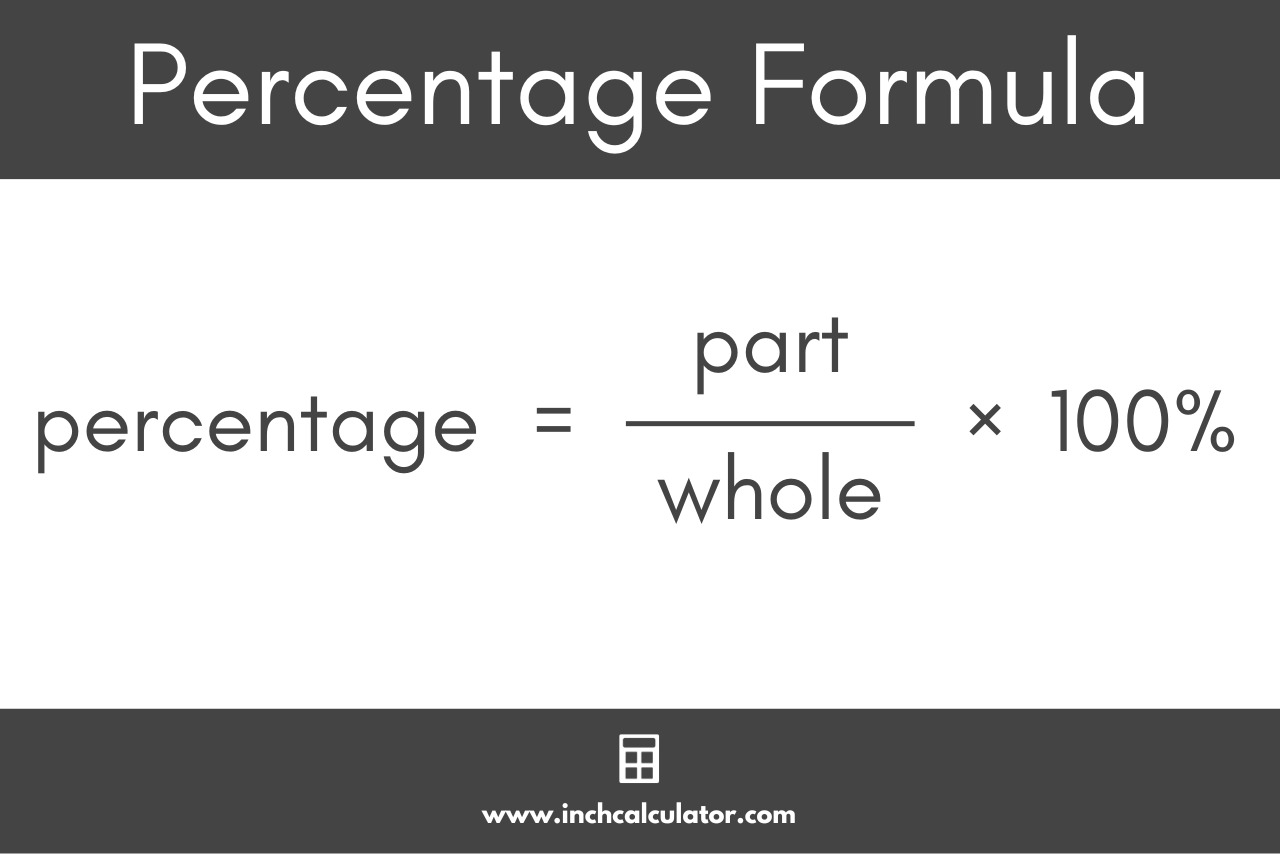
The most fundamental way to obtain a percentage involves three key components: the “part,” the “whole,” and the desired “percentage.” The formula is straightforward:
Percentage = (Part / Whole) × 100
Let’s break down each element:
- Part: This is the specific amount or quantity you are interested in expressing as a fraction of the whole.
- Whole: This represents the total amount, the base from which the part is being taken.
- 100: Multiplying by 100 converts the resulting decimal or fraction into a percentage, making it easier to read and compare.
For instance, if you spent $300 on groceries from a total monthly budget of $2,000, you would calculate: ($300 / $2,000) × 100 = 0.15 × 100 = 15%. This tells you that 15% of your budget went towards groceries. This simple calculation underpins nearly all percentage applications in finance.
Calculating Percentage Change
Beyond simply finding what percentage one number is of another, financial analysis frequently requires calculating the change between two values. This is crucial for tracking growth, decline, and performance over time.
The formula for percentage change is:
Percentage Change = ((New Value – Old Value) / Old Value) × 100
A positive result indicates a percentage increase, while a negative result signifies a percentage decrease. For example, if a stock’s price increased from $50 (Old Value) to $60 (New Value): (($60 – $50) / $50) × 100 = ($10 / $50) × 100 = 0.20 × 100 = 20%. The stock experienced a 20% increase. This calculation is indispensable for evaluating investment performance, economic indicators like inflation, or sales growth.
Core Financial Applications of Percentages
The utility of percentages permeates every facet of financial management, from personal budgeting to corporate financial analysis. Mastering their application is key to deciphering financial statements, evaluating opportunities, and managing risks.
Budgeting and Personal Finance Allocation
For individuals, percentages are invaluable for creating and adhering to a budget. Common budgeting rules, like the “50/30/20 rule,” are percentage-based directives: 50% of income for needs, 30% for wants, and 20% for savings and debt repayment.
- Tracking Expenses: By calculating what percentage each expense category (housing, food, transportation, entertainment) represents of your total income or total expenses, you gain a clear picture of your spending habits. This allows for identifying areas where spending can be reduced or optimized.
- Saving Goals: Setting a target percentage of your income to save each month makes saving a tangible and achievable goal. Whether it’s 10%, 15%, or 20%, knowing this percentage helps you monitor progress towards long-term financial objectives like retirement or a down payment.
- Debt Management: Understanding the percentage of your income dedicated to debt payments (debt-to-income ratio) is critical. Lenders often use this metric to assess creditworthiness, and for individuals, it highlights the burden of existing debt and the capacity for taking on more.
Investment Performance and Returns
In the world of investing, percentages are the primary metric for evaluating performance and comparing different assets or strategies.
- Return on Investment (ROI): This fundamental metric measures the profitability of an investment relative to its cost. ROI = ((Current Value of Investment – Cost of Investment) / Cost of Investment) × 100. A positive ROI indicates a profit, while a negative ROI signifies a loss.
- Annualized Returns: To compare investments over different timeframes, returns are often annualized, converting returns into an equivalent yearly percentage. This helps in assessing long-term growth potential and comparing investments with varying holding periods.
- Portfolio Allocation: Investors use percentages to define their asset allocation strategy, determining what proportion of their portfolio should be in stocks, bonds, real estate, or other assets. This percentage-based allocation is crucial for managing risk and aligning with financial goals.
Loan Interest and Borrowing Costs
Interest rates, expressed as percentages, are the cost of borrowing money or the return on lending it. Understanding them is vital for both borrowers and savers.
- Simple Interest: Calculated only on the principal amount, simple interest is straightforward: Principal × Rate × Time. The resulting interest amount can then be expressed as a percentage of the principal.
- Compound Interest: Often called the “eighth wonder of the world,” compound interest is calculated on the initial principal and also on the accumulated interest from previous periods. Understanding the percentage rate and compounding frequency is critical for appreciating the exponential growth of savings or the escalating cost of debt.
- APR (Annual Percentage Rate) and APY (Annual Percentage Yield): These standardized percentages allow consumers to compare borrowing costs (APR on loans, credit cards) and savings returns (APY on bank accounts) across different financial products. APR reflects the total cost of borrowing, including interest and other fees, while APY shows the effective annual rate of return, considering compounding.
Business Finance and Profitability
Businesses rely heavily on percentages to analyze their financial health, evaluate operational efficiency, and make strategic decisions.
- Profit Margins: Gross Profit Margin ((Revenue – Cost of Goods Sold) / Revenue × 100) and Net Profit Margin (Net Income / Revenue × 100) are crucial indicators of a company’s profitability and efficiency in converting sales into actual profit.
- Markups and Discounts: Retailers use markups (percentage added to cost to determine selling price) and discounts (percentage reduction from original price) as core pricing strategies.
- Sales Growth: Measuring the percentage increase or decrease in sales revenue over a period provides insight into market performance and the effectiveness of sales strategies.
- Market Share: Calculating a company’s sales as a percentage of the total market sales reveals its competitive position.
Advanced Scenarios and Strategic Uses
Beyond the fundamental calculations, percentages play a nuanced role in more complex financial analysis and strategic planning.
Financial Ratios and Benchmarking
Financial ratios are powerful analytical tools that express the relationship between different financial figures as percentages or simple multiples. These ratios offer critical insights into a company’s liquidity, solvency, profitability, and operational efficiency.
- Liquidity Ratios: For example, the Current Ratio (Current Assets / Current Liabilities) might not be a percentage directly, but comparing it to industry benchmarks, often expressed as desired ranges, involves percentage-based thinking.
- Profitability Ratios: Net Profit Margin, Return on Equity, and Return on Assets are all percentage-based ratios that allow for comparing a company’s performance against its own historical data or against competitors in the same industry (benchmarking).
- Solvency Ratios: Debt-to-Equity Ratio or Debt-to-Asset Ratio, while not always percentages themselves, reveal the proportion of financing that comes from debt, with targets often set as percentages of total capital.
Inflation and Purchasing Power
Inflation, the rate at which the general level of prices for goods and services is rising, and subsequently, purchasing power is falling, is always expressed as a percentage. Understanding inflation percentages is vital for:
- Real Returns: Adjusting nominal investment returns by the inflation rate reveals the “real” return, reflecting the actual increase in purchasing power.
- Budget Planning: Accounting for anticipated inflation helps in projecting future expenses and ensuring that savings grow sufficiently to maintain living standards.
- Wage Negotiations: Employees often seek wage increases that at least match the inflation rate to preserve their real income.
Risk Assessment and Probability
While not always a direct percentage calculation of a value, percentages are critical in expressing probabilities and assessing financial risk.
- Probability of Default: Lenders use statistical models to estimate the percentage probability that a borrower will default on a loan.
- Value at Risk (VaR): In investment management, VaR is a measure of the potential loss in value of a portfolio over a defined period for a given probability (e.g., 95% confidence that losses will not exceed X amount).
- Diversification: The percentage allocation across different asset classes and individual securities is a core strategy for managing portfolio risk.
Leveraging Tools for Accuracy and Efficiency
While the basic percentage calculations are simple, human error can occur, especially with complex datasets or repetitive tasks. Fortunately, numerous tools can assist in accurately and efficiently obtaining percentages.
Calculators and Online Tools
For quick, one-off calculations, a basic scientific or financial calculator is sufficient. Many online percentage calculators are also available, often tailored for specific financial scenarios like loan amortization, tip calculation, or discount application. These tools are excellent for verifying manual calculations or for immediate needs.
Spreadsheets (Excel, Google Sheets)
For more robust analysis, managing large datasets, and performing recurring calculations, spreadsheet software like Microsoft Excel or Google Sheets is indispensable.
- Formulas: Spreadsheets allow you to input the basic percentage formulas directly (
=(Part/Whole)*100or=(New_Value-Old_Value)/Old_Value*100). - Formatting: You can easily format cells to display numbers as percentages, automatically multiplying by 100 and adding the ‘%’ symbol.
- Automation: For financial models and dashboards, percentages can be dynamically updated as underlying data changes, providing real-time insights.
Financial Software and Apps
Modern financial software, budgeting apps, and investment platforms often automate percentage calculations, presenting key financial metrics (like spending percentages, portfolio returns, or debt-to-income ratios) in an easy-to-understand format. These tools reduce the need for manual calculations, allowing users to focus on analysis and decision-making.
Conclusion
Understanding how to obtain a percentage is far more than a mathematical triviality; it is a critical skill for navigating the modern financial landscape. From managing personal budgets and assessing investment performance to analyzing business profitability and understanding economic trends like inflation, percentages provide a clear, comparable, and universally understood metric. By mastering the basic formulas and understanding their diverse applications, individuals and businesses can unlock deeper insights, make more informed decisions, and ultimately achieve greater financial success and stability. Embrace percentages not just as numbers, but as powerful tools for clarity and control in your financial journey.
aViewFromTheCave is a participant in the Amazon Services LLC Associates Program, an affiliate advertising program designed to provide a means for sites to earn advertising fees by advertising and linking to Amazon.com. Amazon, the Amazon logo, AmazonSupply, and the AmazonSupply logo are trademarks of Amazon.com, Inc. or its affiliates. As an Amazon Associate we earn affiliate commissions from qualifying purchases.