As the calendar turns toward the final stretch of the year, investors and traders alike shift their focus from mid-year growth targets to the precision of year-end execution. Understanding exactly how many trading days are left in 2024 is not merely an exercise in calendar counting; it is a fundamental component of strategic liquidity management, tax planning, and portfolio rebalancing. In the high-stakes environment of the financial markets, time is the one commodity that cannot be reclaimed, making the final fiscal quarter a period of intense activity and calculated decision-making.
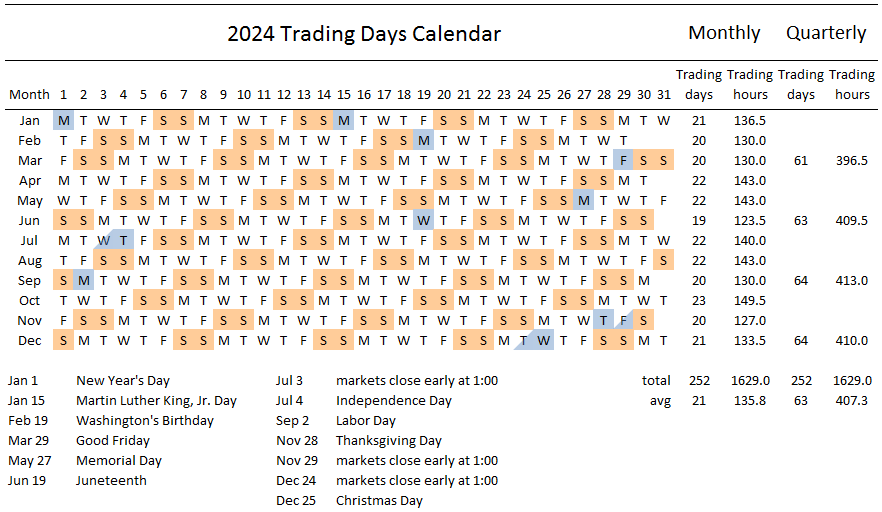
For 2024, the standard number of trading days in the United States is 252. However, for those looking at the remaining horizon from the perspective of the fourth quarter, the window for action narrows significantly when accounting for federal holidays and early market closures. Navigating these remaining days requires an understanding of market mechanics, the impact of settlement cycles, and the psychological shifts that typically characterize the “golden quarter.”
The Final Countdown: Breaking Down the 2024 Trading Schedule
The stock market does not operate in a vacuum; its schedule is dictated by the New York Stock Exchange (NYSE) and NASDAQ holiday calendars. To accurately count the remaining trading days, one must subtract weekends and specific observed holidays that fall within the remaining months of the year.
Key Holidays and Market Closures
As we progress through the latter half of 2024, several key dates will see the markets shuttered. Labor Day (September 2), Thanksgiving Day (November 28), and Christmas Day (December 25) are the primary full-day closures remaining. Furthermore, the day after Thanksgiving (Black Friday) and Christmas Eve often feature early closures at 1:00 PM EST. These shortened sessions are notorious for thin liquidity and “gap” risks, where low trading volume can lead to exaggerated price movements.
For institutional traders, the actual “working” days are often fewer than the official trading days. The final two weeks of December, in particular, often see a significant drop-off in institutional participation as fund managers close their books and take leave. This makes the days leading up to mid-December the most critical for executing large-scale shifts in equity or fixed-income positions.
The Impact of T+1 Settlement on Year-End Liquidity
A critical development for 2024 is the transition to the T+1 settlement cycle, which was implemented in late May. Previously, the T+2 (trade date plus two business days) rule meant that investors had to complete their sales by December 28th or 29th to ensure the capital gains or losses were recognized within the current tax year.
With the shift to T+1, the window has widened slightly, allowing for a more immediate realization of trades. However, this faster pace demands higher operational efficiency. Investors must be aware that while they have an extra day of “real” time to execute year-end trades, the clearinghouse mechanisms are now moving faster, leaving less room for error in wire transfers or trade corrections. Counting the trading days must now be paired with an understanding of this accelerated settlement environment to avoid missing crucial tax deadlines.
Tactical Portfolio Adjustments for the Final Quarter
With the specific number of trading days identified, the focus shifts to how those days should be utilized. The fourth quarter is traditionally the busiest time for personal finance management, as it represents the last opportunity to influence the annual tax bill and prepare for the coming year’s volatility.
Tax-Loss Harvesting: Turning Losses into Opportunities
One of the most effective uses of the remaining trading days in 2024 is tax-loss harvesting. This strategy involves selling securities that are currently trading at a loss to offset capital gains taxes incurred elsewhere in the portfolio. In a year that has seen significant sector rotation—moving from high-flying tech stocks to more defensive value plays—many investors may find themselves with “underwater” positions despite a generally positive market index.
The key to successful tax-loss harvesting is the 30-day “Wash Sale Rule” enforced by the IRS. To claim the loss, an investor cannot buy the same or a “substantially identical” security within 30 days before or after the sale. Therefore, if an investor intends to harvest a loss in December but wants to maintain exposure to that specific sector, they must plan their trades early enough in the remaining trading days to either sit out the 30 days or swap into a similar but not identical Exchange Traded Fund (ETF).
Portfolio Rebalancing and Risk Mitigation
As the year draws to a close, portfolios often drift away from their original target allocations. A strong performance in equities might mean that a portfolio intended to be 60/40 (stocks to bonds) has shifted to 70/30. The remaining trading days of 2024 serve as the window to sell winners and buy laggards to return to the desired risk profile.
This rebalancing is especially important in 2024, given the concentration of gains in specific sectors like Artificial Intelligence and semiconductors. If the remaining trading days are not used to diversify, an investor may enter 2025 with excessive exposure to a single thematic trend, leaving them vulnerable to a sector-specific correction.
Market Volatility and the 2024 Election Cycle
The final trading days of 2024 are unique due to the intersection of the fiscal year-end and the United States Presidential Election in November. Historically, election years introduce a specific brand of volatility that peaks in the weeks surrounding the vote.
Historical Performance During Election Years
Data from the last several decades suggests that the stock market often experiences a period of uncertainty leading up to Election Day, followed by a relief rally once the outcome is determined—regardless of which party wins. Traders will be watching the remaining days in October and early November with a defensive lens.
The strategy during these specific trading days often involves increasing cash positions or utilizing options to hedge against “tail risk.” Once the election results are clear, the remaining trading days in November and December are typically characterized by the market “pricing in” the anticipated policies of the winning administration, whether they involve corporate tax changes, trade tariffs, or infrastructure spending.
Federal Reserve Policy and Interest Rate Expectations
Parallel to the political cycle is the Federal Reserve’s monetary policy. The final FOMC meetings of 2024 will be among the most watched in recent history. As inflation shows signs of cooling, the market is hypersensitive to the timing and magnitude of potential rate cuts.
Each remaining trading day that coincides with a Fed announcement or the release of Consumer Price Index (CPI) data will likely see heightened volume and volatility. Investors must map their year-end trades around these “macro” days. Attempting to execute a major portfolio overhaul on the day of a Fed rate decision is often ill-advised, as spreads widen and price discovery becomes chaotic.
Capitalizing on Seasonal Market Trends
The final days of the year are also home to some of the most famous—and debated—seasonal anomalies in finance. Understanding these can help traders optimize their entry and exit points during the closing weeks of 2024.
The Santa Claus Rally: Myth or Reality?
The “Santa Claus Rally” refers to the tendency for the stock market to increase during the last five trading days of December and the first two trading days of January. While not a guarantee, historical data shows that the S&P 500 has risen during this period approximately 75% of the time since 1950.
For the short-term trader, the remaining days in late December represent a high-probability window for bullish momentum. However, for the long-term investor, this rally can actually make year-end buying more expensive. Strategic investors often look to complete their “buying” for the following year in the quieter days of early December to avoid the premium prices sometimes seen during the holiday surge.
Institutional Window Dressing and Its Effects
In the final trading days of the year, institutional fund managers engage in a practice known as “window dressing.” This involves selling stocks that have performed poorly and buying high-performing “glamour” stocks to make their year-end holdings reports look more attractive to clients.
This behavior creates a predictable, albeit artificial, demand for the year’s top performers and selling pressure on the year’s laggards. By being aware of how many trading days are left, savvy investors can anticipate these flows. They may choose to sell their winning positions into the institutional buying frenzy in late December or wait until the first few trading days of January—when “mean reversion” often occurs—to pick up undervalued stocks that were sold off during the window-dressing period.

Conclusion: Maximizing the Final Quarter
The remaining trading days of 2024 represent a finite resource. Whether you are a retail investor looking to optimize your retirement accounts or a professional trader navigating the complexities of an election year, the key to success lies in preparation.
Start by auditing your portfolio against the 2024 calendar. Identify the “hard” deadlines for tax-loss harvesting, retirement contributions, and T+1 settlement requirements. Account for the “soft” periods of low liquidity during the holidays and the high-volatility windows surrounding the election and Fed meetings. By treating the remaining trading days as a strategic timeline rather than just a countdown, you can ensure that you enter 2025 with a portfolio that is balanced, tax-efficient, and positioned for the next market cycle.
aViewFromTheCave is a participant in the Amazon Services LLC Associates Program, an affiliate advertising program designed to provide a means for sites to earn advertising fees by advertising and linking to Amazon.com. Amazon, the Amazon logo, AmazonSupply, and the AmazonSupply logo are trademarks of Amazon.com, Inc. or its affiliates. As an Amazon Associate we earn affiliate commissions from qualifying purchases.