
The Dow Jones Industrial Average (DJIA), often referred to simply as “the Dow,” stands as one of the most recognizable and frequently quoted stock market indices in the world. For over a century, its daily fluctuations have served as a quick barometer for the health of the U.S. stock market and, by extension, the broader economy. When financial news reports mention the market’s performance, it’s often the Dow’s movement that takes center stage. But what exactly is the DJIA, how is it calculated, and what does its performance “today” truly signify for investors and the public alike?

Understanding the Dow is more than just knowing a number; it’s about grasping its historical context, its unique methodology, and its role as a leading, albeit imperfect, indicator of market sentiment and corporate profitability. In an increasingly complex global financial landscape, the DJIA remains a crucial data point for everyone from seasoned portfolio managers to casual observers. This article delves into the core aspects of the Dow, providing a comprehensive overview that allows for a more informed interpretation of its daily pulse and its implications for financial decision-making.
Decoding the Dow Jones Industrial Average
The Dow Jones Industrial Average isn’t merely a random collection of stocks; it’s a carefully curated index designed to represent the performance of a significant segment of the U.S. industrial sector, though its definition of “industrial” has evolved dramatically over time. Its origins are deeply rooted in the history of American capitalism, and understanding this legacy is key to appreciating its enduring relevance.
A Legacy of Market Representation
Conceived by Charles Dow, editor of The Wall Street Journal and co-founder of Dow Jones & Company, the index first appeared on May 26, 1896. Initially, it comprised just 12 companies, predominantly industrial enterprises like General Electric, U.S. Rubber, and National Lead, reflecting the dominant economic engines of the late 19th century. The original intent was to provide a simple, easily digestible measure of the market’s overall direction. Over the decades, the DJIA expanded to 30 companies in 1928, a number it has maintained ever since. This expansion was a critical step in making the index more representative as the U.S. economy grew and diversified. Its long history means it has weathered numerous economic cycles, market crashes, and booms, offering a continuous narrative of American enterprise.
The “Industrials” in a Modern Economy
Despite its name, the DJIA today is far from solely industrial. The “Industrial” in its name is largely a historical artifact. While it once represented heavy manufacturing and transportation, the index now includes a diverse array of companies spanning sectors like technology (Apple, Microsoft), finance (JPMorgan Chase, Goldman Sachs), healthcare (Johnson & Johnson, UnitedHealth Group), retail (Walmart, Home Depot), and consumer goods (Procter & Gamble, Coca-Cola). This evolution reflects the fundamental shifts in the U.S. economy, where innovation, services, and consumer spending often drive growth more than traditional heavy industry. The selection of these 30 companies is not arbitrary; it aims to include “blue-chip” firms—large, well-established, and financially sound companies that are leaders in their respective industries and are widely held by institutional and individual investors.
How the DJIA Differs from Other Indices
It’s crucial to distinguish the DJIA from other major market indices, particularly the S&P 500 and the Nasdaq Composite. The most significant difference lies in its composition and weighting methodology. While the S&P 500 tracks 500 large-cap U.S. companies and is market-capitalization weighted (meaning companies with larger market values have a greater impact on the index), the DJIA is price-weighted. This means that stocks with higher per-share prices have a greater influence on the index’s value, regardless of their total market capitalization. This unique calculation method, which we will explore further, can sometimes lead to different interpretations of market performance compared to cap-weighted indices. Furthermore, with only 30 components, the DJIA offers a more concentrated view compared to the S&P 500’s broader representation, making it more susceptible to the idiosyncratic movements of its individual members.
The Components and Calculation of the DJIA
To truly understand what “the Dow is doing today,” one must grasp the specific mechanics of its construction and calculation. Unlike simply summing up stock prices, the DJIA employs a unique methodology that has evolved over time to maintain its relevance.
The Exclusive Club of 30 Blue Chips
The DJIA is composed of 30 publicly traded U.S. companies selected by the editors of The Wall Street Journal. These aren’t just any companies; they are typically large, highly reputable, and financially stable “blue-chip” firms that represent a broad swath of the American economy. The selection criteria are not fixed but generally aim for companies with excellent reputations, demonstrated growth, and significant investor interest. The committee does not follow a strict set of quantitative rules for adding or removing companies; rather, changes are made as needed to ensure the index remains a relevant indicator of the U.S. stock market and economy. For instance, when a component company merges, goes private, or experiences a significant decline in its industry leadership, it might be replaced by another leading firm. These changes, though infrequent, can have a noticeable impact on the index given its limited number of components.
Understanding the Price-Weighted Methodology
One of the most distinctive features of the DJIA is its price-weighted average. This means that the impact a stock’s price change has on the overall index is directly proportional to its per-share price. For example, if a stock trading at $300 rises by 1%, it will have a much greater impact on the Dow’s overall value than a stock trading at $30 that rises by 1%, or even by 10%. This contrasts sharply with market-capitalization-weighted indices (like the S&P 500), where companies with larger total market values (share price multiplied by shares outstanding) exert a greater influence. The consequence of price-weighting is that a high-priced stock with a relatively smaller market cap might move the index more than a lower-priced stock with a much larger market cap. This can sometimes lead to an index movement that doesn’t perfectly align with the overall wealth change of investors across all 30 companies.
The Role of the Dow Divisor
To maintain historical continuity and prevent the index’s value from being distorted by stock splits, spinoffs, or other structural changes that alter a company’s share price without affecting its underlying value, the Dow Jones Industrial Average uses a “Dow Divisor.” This divisor is a constantly adjusted number that accounts for these corporate actions. Without it, a stock split (e.g., one share at $100 becomes two shares at $50 each) would artificially reduce the index’s value, even though the underlying value of the company hasn’t changed. When a stock split or a change in component companies occurs, the divisor is adjusted so that the index’s value remains the same immediately before and after the event. The divisor is typically a small number, often less than 0.1, meaning a one-dollar change in any of the Dow’s component stocks results in a more than ten-point change in the DJIA. This mechanism ensures that the index reflects genuine market movements rather than mere accounting adjustments.
Interpreting the DJIA’s Daily Movements and Current Relevance
The daily performance of the DJIA is a headline staple, but understanding what those numbers truly mean requires looking beyond the superficial “up” or “down” tally. It involves considering the forces at play and recognizing the index’s inherent strengths and limitations as a barometer.
What Today’s Numbers Really Mean

When you hear that the DJIA is “up 200 points today,” it signifies that the collective average of its 30 component stocks, adjusted by the Dow Divisor, has increased by that amount. Conversely, “down 150 points” indicates a similar decrease. However, it’s crucial to understand that a point change in the Dow today is not the same as a point change decades ago. As the index value itself has grown significantly (from single digits to over 30,000), a 100-point move represents a much smaller percentage change now than it did when the index was at 10,000. Therefore, interpreting the Dow’s daily movement requires looking at both the absolute point change and, more importantly, the percentage change. A 0.5% gain or loss, for example, gives a more accurate representation of the market’s magnitude of movement than a raw point figure. Furthermore, these daily movements reflect investor sentiment—their collective optimism or pessimism—driven by a myriad of factors.
Factors Influencing Daily Swings
Numerous elements can cause the DJIA to move up or down on any given day. Corporate earnings reports are a major catalyst; strong or weak performance from a major Dow component can significantly impact the index. Economic data, such as inflation reports, unemployment figures, GDP growth, and consumer confidence, provide insights into the health of the broader economy and influence investor expectations for future corporate profits. Geopolitical events, central bank policy decisions (like interest rate changes from the Federal Reserve), and global market trends also play a significant role. Even seemingly minor news, such as an analyst upgrade or downgrade for a Dow stock, can cause ripples. The interconnectedness of global markets means that events in one part of the world can easily affect investor behavior in the U.S., driving the Dow’s daily trajectory.
The DJIA as an Economic Barometer: Strengths and Weaknesses
The DJIA’s greatest strength as an economic barometer lies in its long history and its focus on established, leading companies. These “blue chips” are often bellwethers for their respective industries and the economy at large. Their collective performance can offer a quick snapshot of corporate health and investor sentiment. However, the DJIA also has significant weaknesses. Its limited number of components (30) means it doesn’t represent the full breadth of the U.S. stock market, particularly small-cap companies or emerging industries. Its price-weighted methodology can also give undue influence to high-priced stocks, potentially skewing its representation compared to a market-capitalization-weighted index that better reflects the total value of public companies. Consequently, while the DJIA is a useful and widely cited indicator, it should not be viewed in isolation but rather as one piece of a larger puzzle when assessing market and economic conditions.
Investing and the DJIA: Beyond the Headlines
For investors, the DJIA serves as more than just a daily news item; it’s a benchmark, a source of investment ideas, and a point of reference for broader market trends. However, directly “investing in the Dow” involves specific strategies and considerations.
How Investors Track the Dow
While you cannot directly buy “the Dow,” investors can gain exposure to its performance through various financial instruments. The most common method is investing in exchange-traded funds (ETFs) or mutual funds that track the DJIA. The most prominent example is the SPDR Dow Jones Industrial Average ETF Trust, ticker symbol DIA, often referred to as “Diamonds.” This ETF holds shares of the 30 companies in the same proportions as their influence on the Dow, effectively replicating its price-weighted performance. Investors can buy and sell shares of DIA just like individual stocks. Additionally, derivatives like futures and options contracts on the DJIA allow sophisticated investors to speculate on or hedge against the index’s movements. Individual investors might also use the DJIA as a benchmark to compare the performance of their own diversified portfolios.
The Dow’s Place in a Diversified Portfolio
For many investors, the DJIA components represent a collection of solid, dividend-paying companies that can form a core part of a long-term investment strategy. However, relying solely on the Dow, or a Dow-tracking ETF, might not provide sufficient diversification. While the 30 companies are diverse across sectors, they still represent only a small fraction of the investable universe. A truly diversified portfolio typically includes exposure to a broader range of asset classes (stocks, bonds, real estate), market capitalizations (large-cap, mid-cap, small-cap), geographic regions (domestic, international), and investment styles (growth, value). While a Dow-focused investment can provide exposure to large, stable U.S. companies, it should ideally be part of a wider strategy that minimizes concentration risk and aligns with an individual’s financial goals and risk tolerance.
Long-Term Trends vs. Short-Term Volatility
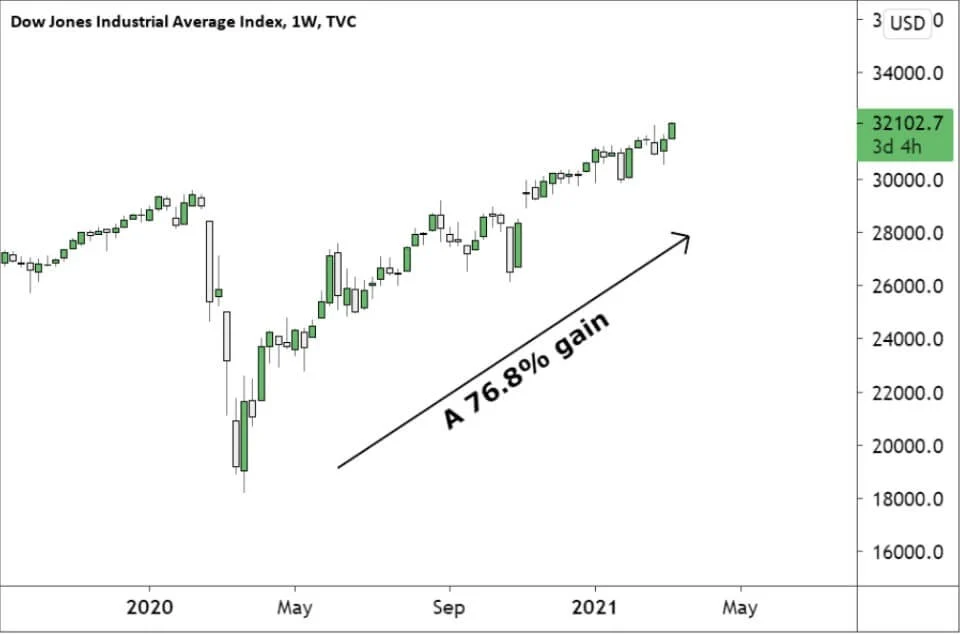
The DJIA’s daily movements are often driven by short-term news, speculation, and sentiment, leading to volatility. However, over the long term, the Dow has historically trended upwards, reflecting the underlying growth and innovation of the U.S. economy and its leading corporations. Investors are generally advised to focus on these long-term trends rather than getting caught up in the day-to-day noise. Periods of volatility, while sometimes unsettling, are a normal part of market cycles. For long-term investors, corrections or dips in the Dow can even present opportunities to invest in quality companies at more attractive valuations. Understanding the difference between short-term market fluctuations and long-term economic fundamentals is key to successful investing with the Dow as a reference point.
A Broader Lens: Complementary Market Indicators
While the DJIA holds significant historical and symbolic value, a comprehensive understanding of “what is happening in the market today” necessitates looking beyond this single index. Other major indices and macroeconomic factors provide a more complete picture.
The S&P 500: A Wider Gaze
The S&P 500 is often considered a more accurate and comprehensive gauge of the overall U.S. stock market than the DJIA. Comprising 500 large-cap U.S. companies across various sectors, it represents about 80% of the total U.S. stock market capitalization. Crucially, the S&P 500 is market-capitalization-weighted, meaning that companies with larger market values (like Apple or Microsoft) have a greater influence on the index’s movements. This weighting methodology ensures that the S&P 500 more accurately reflects changes in the aggregate wealth of shareholders in major U.S. companies. Its broader coverage and market-cap weighting make it a preferred benchmark for many institutional investors and economists when assessing the health of the U.S. equity market.
Nasdaq Composite: The Tech-Driven Frontier
The Nasdaq Composite Index is another vital market indicator, particularly for tracking the performance of technology and growth-oriented companies. It includes nearly all stocks listed on the Nasdaq Stock Market, encompassing a vast array of companies ranging from established tech giants to smaller, innovative startups. Historically, the Nasdaq Composite has been heavily weighted towards technology companies, though it also includes companies from other sectors. Its movements are often indicative of investor sentiment towards growth stocks and the innovation economy. When the tech sector is booming, the Nasdaq Composite typically outperforms the Dow and S&P 500, and vice versa. Its volatility can also be higher due to the often speculative nature of some of its constituent companies.
Global Indices and Macroeconomic Factors
Beyond U.S. specific indices, global market indicators like the FTSE 100 (UK), DAX (Germany), Nikkei 225 (Japan), and the Hang Seng Index (Hong Kong) provide crucial context. In an interconnected global economy, the performance of these international markets can influence U.S. markets. Macroeconomic factors, not directly reflected in stock indices, are also paramount. These include interest rates set by central banks, currency exchange rates, commodity prices (like oil and gold), and global trade agreements or disputes. These factors can influence corporate earnings, consumer spending, and investor confidence, thereby impacting all stock market indices, including the DJIA. A truly insightful understanding of “what is DJIA today” requires an awareness of these broader, interconnected financial and economic forces.
The DJIA, with its storied past and selective membership, continues to hold a significant place in the financial world. While it offers a quick and easily digestible snapshot of the market, interpreting its daily movements effectively means understanding its unique calculation, appreciating its strengths as a bellwether, and acknowledging its limitations as a comprehensive market gauge. For investors, the Dow is a valuable reference point, but it should be viewed in conjunction with other indices and a wider array of financial and economic data to make informed decisions and build truly diversified portfolios that align with long-term financial goals.
aViewFromTheCave is a participant in the Amazon Services LLC Associates Program, an affiliate advertising program designed to provide a means for sites to earn advertising fees by advertising and linking to Amazon.com. Amazon, the Amazon logo, AmazonSupply, and the AmazonSupply logo are trademarks of Amazon.com, Inc. or its affiliates. As an Amazon Associate we earn affiliate commissions from qualifying purchases.