
For countless investors, economists, and casual observers alike, the daily value of the Dow Jones Industrial Average (DJIA) is more than just a number; it’s a vital pulse of the financial world. Each morning, as markets awaken, and throughout the trading day, the question “how much is the Dow Jones today?” resonates across news desks, trading floors, and individual portfolios. Understanding this iconic index goes beyond merely checking a ticker; it involves grasping its history, its composition, the myriad forces that shape its daily fluctuations, and its broader significance within the tapestry of global finance.

This article delves into the intricacies of the Dow Jones, providing a comprehensive guide to interpreting its daily movements, identifying the underlying drivers, and placing its current value within a strategic investment context. We will explore how investors can track its performance, what factors to consider when analyzing its shifts, and why, for all its prominence, the Dow is just one piece of a much larger economic puzzle.
Understanding the Dow Jones Industrial Average (DJIA)
Before we dissect its daily movements, it’s crucial to establish a firm understanding of what the Dow Jones Industrial Average truly represents. Often simply called “the Dow,” it stands as one of the oldest and most frequently quoted market indexes in the world, embodying a significant portion of U.S. industrial and economic might.
A Legacy of Market Representation
The DJIA was conceived by Charles Dow, co-founder of Dow Jones & Company, and first published on May 26, 1896. Initially comprising 12 primarily industrial stocks, it was designed as a simple arithmetic average to gauge the health of the U.S. economy. Over the decades, its composition evolved, reflecting shifts in economic dominance from heavy industry to technology and consumer-oriented sectors. Despite its “industrial” moniker, today’s Dow is a diverse collection of leading companies from various sectors, serving as a robust barometer for the broader market. Its enduring legacy lies in its capacity to offer a snapshot of market sentiment and economic trends, making its daily performance a headline event.
The Price-Weighted Index and Its Components
Unlike market-capitalization-weighted indexes such as the S&P 500, the Dow is a price-weighted index. This means that stocks with higher share prices have a greater influence on the index’s value than those with lower share prices, regardless of their total market capitalization. While this methodology has drawn criticism for not fully reflecting the proportional size of companies, it remains a simple and historically significant way to track market movement.
The DJIA comprises 30 “blue-chip” companies – large, well-established, and financially sound corporations listed on the New York Stock Exchange (NYSE) and NASDAQ. These companies are selected not just for their size but also for their reputation, sustained growth, and broad investor interest. Examples often include giants like Apple, Microsoft, Johnson & Johnson, Walmart, and Coca-Cola, though the exact composition can change over time as companies are added or removed to maintain relevance and representation of the U.S. economy. Understanding these component companies and their individual performance is key to deciphering the Dow’s overall movement on any given day.
Tracking the Dow’s Pulse: Real-Time Insights
In today’s fast-paced financial world, staying updated on the Dow’s current value is easier than ever. A plethora of tools and platforms provide real-time data, allowing investors to monitor its movements minute by minute.
Where to Find Today’s Numbers
Accessing the Dow’s current value is straightforward. Leading financial news websites (e.g., Bloomberg, Reuters, Wall Street Journal, Yahoo Finance), dedicated stock market apps, and online brokerage platforms offer live quotes and interactive charts. These resources typically display the DJIA’s current point value, its change in points from the previous day’s close, and the percentage change. Many also provide historical data, allowing users to view intraday, daily, weekly, monthly, and yearly performance. Furthermore, major news channels and financial publications frequently report on the Dow’s performance throughout the trading day, often highlighting significant milestones or dramatic shifts. When you ask “how much is the Dow Jones today,” these are the immediate sources that provide the answer.
Deciphering the Daily Movements
The Dow’s daily performance is typically reported as a gain or loss in points. For example, if the Dow opens at 38,000 and closes at 38,150, it gained 150 points. This is often accompanied by a percentage change, which provides a more standardized measure of volatility, especially when comparing different market indexes or historical periods. A 1% movement on a Dow at 38,000 points (380 points) is a different magnitude than a 1% movement when it was at 10,000 points (100 points).
Beyond the raw numbers, observing intraday trends can offer insights. Significant fluctuations during the day might be tied to specific economic reports, corporate announcements, or sudden shifts in market sentiment. While the opening and closing values are generally what make headlines, understanding the journey between those points can reveal underlying market dynamics and investor reactions to unfolding events.
Key Drivers Behind the Dow’s Daily Performance
The Dow’s value is a dynamic reflection of countless underlying factors, reacting to a complex interplay of economic indicators, corporate news, and global events. Understanding these drivers is essential for anyone trying to interpret “how much is the Dow Jones today” with meaningful insight.
Macroeconomic Influences
Broad economic forces exert significant influence over the Dow. Key macroeconomic indicators that frequently move the markets include:

- Inflation Reports: Data from the Consumer Price Index (CPI) or Producer Price Index (PPI) can signal rising or falling inflation, impacting interest rate expectations and corporate profitability.
- Employment Data: Figures like the Non-Farm Payrolls, unemployment rate, and jobless claims provide insights into the labor market’s health, which is a critical driver of consumer spending and economic growth.
- Interest Rate Decisions: The Federal Reserve’s monetary policy announcements, particularly regarding the federal funds rate, directly impact borrowing costs for businesses and consumers, influencing investment decisions and market sentiment. Higher rates can slow economic growth and be bearish for stocks, while lower rates can stimulate the economy.
- Gross Domestic Product (GDP): Reports on GDP growth offer a comprehensive measure of economic activity. Strong GDP numbers generally indicate a healthy economy, which can be bullish for the stock market.
- Consumer Confidence and Retail Sales: These indicators reflect consumer willingness to spend, a vital component of economic growth, and can significantly sway market sentiment.
Corporate Actions and Market Sentiment
While macroeconomic data provides the big picture, microeconomic factors related to the 30 Dow components also play a crucial role:
- Earnings Reports: Quarterly earnings announcements from individual Dow companies, including revenue, profit, and future guidance, can cause significant volatility not only for the company’s stock but also for the entire index. Positive surprises can boost the Dow, while disappointments can drag it down.
- Mergers and Acquisitions (M&A): Major M&A activity involving Dow components can create ripples across the market, signaling industry consolidation or strategic shifts.
- Product Launches and Innovation: Significant technological breakthroughs or successful product launches by these industry leaders can inspire investor confidence and drive stock prices up.
- Geopolitical Events: Global political instability, trade disputes, or international conflicts can introduce uncertainty, leading to risk aversion and market sell-offs. Conversely, resolutions to such tensions can spark rallies.
- Market Sentiment and Investor Psychology: Beyond tangible data, the collective mood of investors – fear or greed – can amplify or dampen market movements. News headlines, analyst upgrades/downgrades, and social media trends can all contribute to shifts in sentiment, creating self-fulfilling prophecies of rallies or corrections.
The Broader Context: Why Today’s Number Matters (and Doesn’t)
While the daily performance of the Dow Jones captures significant attention, it’s crucial for investors to place “how much is the Dow Jones today” into a broader, more strategic context. Overemphasis on short-term fluctuations can lead to impulsive decisions, whereas a longer-term perspective allows for more measured and informed choices.
Short-Term Volatility vs. Long-Term Trends
Daily swings in the Dow are a natural characteristic of a dynamic market. These short-term volatilities are often driven by immediate news, economic data releases, or momentary shifts in sentiment. For day traders, these fluctuations are the very essence of their strategy. However, for most long-term investors, day-to-day changes, even significant ones, are typically noise rather than signal.
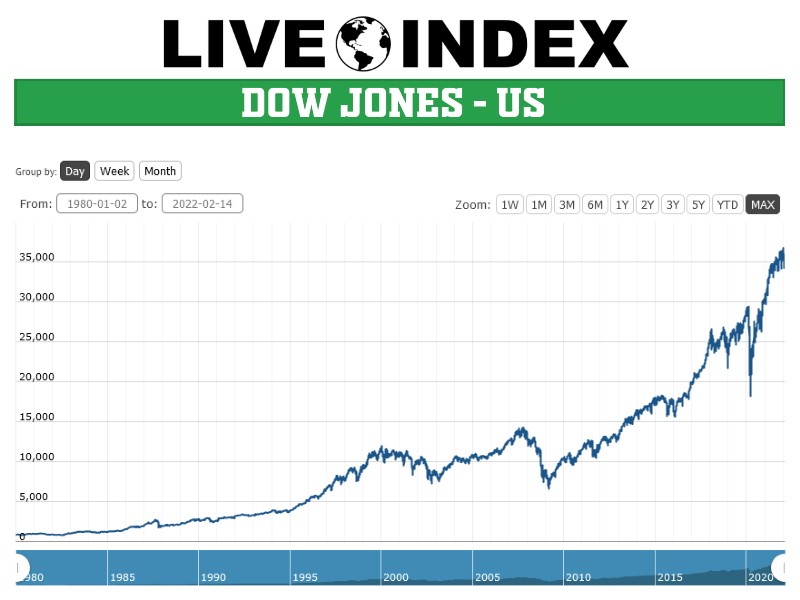
The true value of tracking the Dow for long-term investors lies in identifying enduring trends and understanding the market’s trajectory over months, years, and even decades. Historically, despite numerous crashes and corrections, the Dow has shown a consistent upward trend, reflecting the overall growth and resilience of the U.S. economy. Focusing solely on today’s gain or loss can obscure this fundamental reality and lead to missing out on the compounding power of long-term investing. A 2% dip today might be unsettling, but in the context of a 10% average annual return over 20 years, it’s a minor blip.
The Dow as a Barometer, Not a Crystal Ball
The Dow Jones Industrial Average is undoubtedly an important barometer of the U.S. stock market and broader economic health. It provides a quick and accessible snapshot of how 30 major companies are performing, which in turn reflects on various sectors of the economy. However, it is not a perfect predictor of future market movements or an exhaustive representation of the entire economy.
Its limitations include:
- Limited Scope: With only 30 companies, it doesn’t encompass the vast majority of publicly traded companies in the U.S. or fully represent sectors like small-cap stocks or emerging industries.
- Price-Weighting Bias: Its price-weighted nature means a higher-priced stock from a smaller company can influence the index more than a lower-priced stock from a larger company (by market cap).
- Exclusion of Key Sectors: While diverse, it may not perfectly capture the nuances of every economic sector.
Therefore, while checking “how much is the Dow Jones today” provides valuable information, a comprehensive market view requires also considering other indexes like the S&P 500 (which tracks 500 large-cap companies and is market-capitalization-weighted) and the Nasdaq Composite (heavily weighted towards technology and growth stocks). Together, these indexes offer a more holistic understanding of market performance and potential future trends.
Strategic Investing: Beyond the Daily Ticker
For most individuals, the constant monitoring of the Dow Jones’s daily fluctuations can be counterproductive, fostering anxiety and potentially leading to suboptimal investment decisions. A strategic approach emphasizes long-term goals, diversification, and disciplined decision-making over reactive responses to daily news.
Diversification and a Long-Term Outlook
The cornerstone of sound investment strategy is diversification. Relying solely on the performance of the 30 companies in the Dow Jones, or even just U.S. large-cap stocks, exposes an investor to undue risk. A well-diversified portfolio should include a mix of asset classes (stocks, bonds, real estate, commodities), different geographical regions, and various market capitalizations (large-cap, mid-cap, small-cap stocks). This strategy helps to mitigate risk, as underperformance in one area can be offset by gains in another.
Coupled with diversification is a long-term outlook. Instead of asking “how much is the Dow Jones today” with apprehension, investors should focus on their investment horizon, typically measured in years or decades. Historically, markets have trended upwards over the long term, making dollar-cost averaging (investing a fixed amount regularly, regardless of market highs or lows) a powerful strategy. This approach reduces the impact of volatility and leverages market recoveries. Understanding that market downturns are part of the cycle allows investors to remain calm and disciplined, resisting the urge to sell low during periods of panic.
Leveraging Financial Tools and Expertise
While understanding market fundamentals is important, navigating the complexities of investing doesn’t have to be a solo journey. Modern financial tools, such as robo-advisors and online trading platforms with robust analytical capabilities, empower investors with data, research, and automated investment strategies tailored to their risk tolerance and goals. These tools can help build diversified portfolios, rebalance them periodically, and provide insights that go beyond a simple Dow Jones ticker.
Furthermore, seeking guidance from a qualified financial advisor can provide invaluable perspective. An advisor can help define financial goals, assess risk tolerance, create a personalized investment plan, and provide emotional discipline during volatile market periods. They can interpret market data, including the Dow’s performance, within the context of an individual’s unique financial situation, helping to distinguish between fleeting market noise and significant long-term trends. Their expertise can ensure that “how much is the Dow Jones today” translates into actionable, strategic decisions rather than just a moment of passing curiosity.
In conclusion, while the daily movement of the Dow Jones Industrial Average remains a captivating indicator for the financial world, its true utility lies in its intelligent interpretation. For discerning investors, it serves not as a solitary oracle, but as a significant piece of a larger puzzle, informing a well-diversified, long-term, and strategically guided investment journey.
aViewFromTheCave is a participant in the Amazon Services LLC Associates Program, an affiliate advertising program designed to provide a means for sites to earn advertising fees by advertising and linking to Amazon.com. Amazon, the Amazon logo, AmazonSupply, and the AmazonSupply logo are trademarks of Amazon.com, Inc. or its affiliates. As an Amazon Associate we earn affiliate commissions from qualifying purchases.