For investors, both seasoned and novice, understanding the potential returns of major market benchmarks is fundamental to crafting a robust financial strategy. Among these benchmarks, the S&P 500 stands as a titan, often cited as the truest barometer of the U.S. stock market’s health. When someone asks “what is the average return for the S&P 500,” they’re not just seeking a number; they’re looking for insight into wealth creation, risk assessment, and the very mechanics of long-term investing. This inquiry, while seemingly simple, opens a gateway to understanding market dynamics, economic cycles, and the power of compounding.
The S&P 500’s historical performance offers a compelling narrative of resilience and growth, a testament to the innovative spirit and economic dynamism embedded within its constituent companies. However, “average” is a word that requires careful unpacking. It masks periods of exhilarating growth, painful corrections, and prolonged plateaus. A nuanced understanding of this average, therefore, involves not just knowing the number, but comprehending the context, the forces at play, and how to leverage this knowledge for personal financial success. This article will delve into the historical data, dissect the factors influencing these returns, explore the inherent risks, and ultimately, provide practical insights for investors navigating their financial journeys.
Understanding the S&P 500 and Its Historical Performance
To appreciate the average return, we must first establish a clear understanding of what the S&P 500 represents and how its performance is calculated.
What is the S&P 500?
The S&P 500, short for the Standard & Poor’s 500, is a stock market index that represents the performance of 500 of the largest publicly traded companies in the United States. These companies are selected by a committee at S&P Dow Jones Indices based on criteria like market size, liquidity, and sector representation, ensuring the index broadly reflects the U.S. economy. Because it’s market-capitalization-weighted, companies with larger market values have a greater impact on the index’s performance. Investing in the S&P 500 is often seen as investing in American industry itself, offering broad diversification across various sectors without needing to pick individual stocks. This makes it a popular choice for index funds and ETFs, which aim to replicate its performance.
Deciphering the “Average” Return: A Look at Historical Data
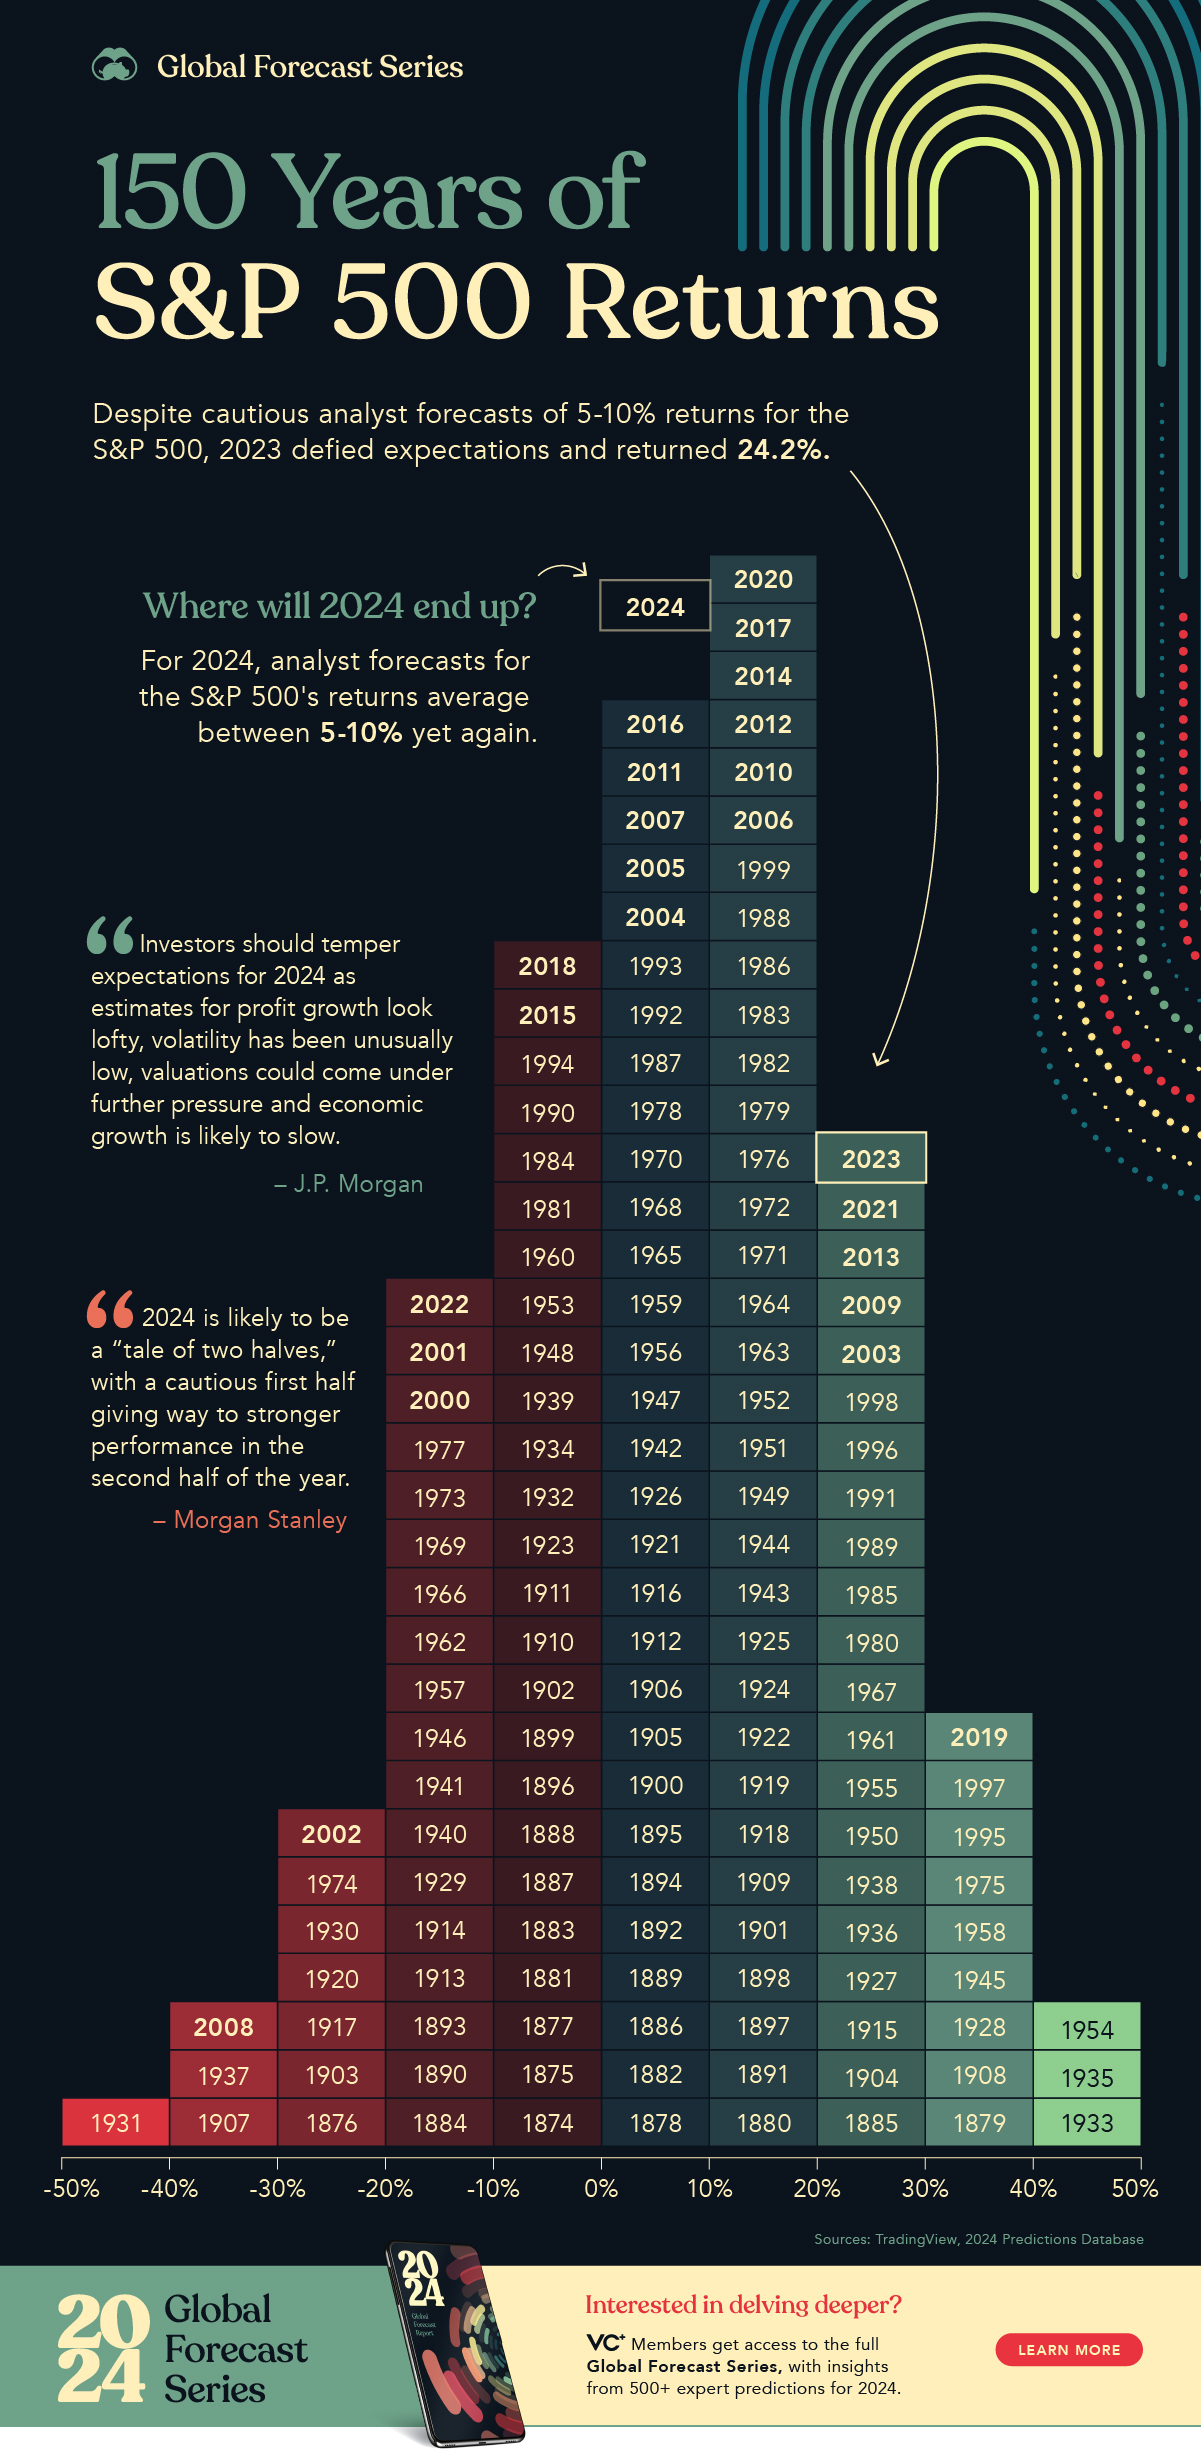
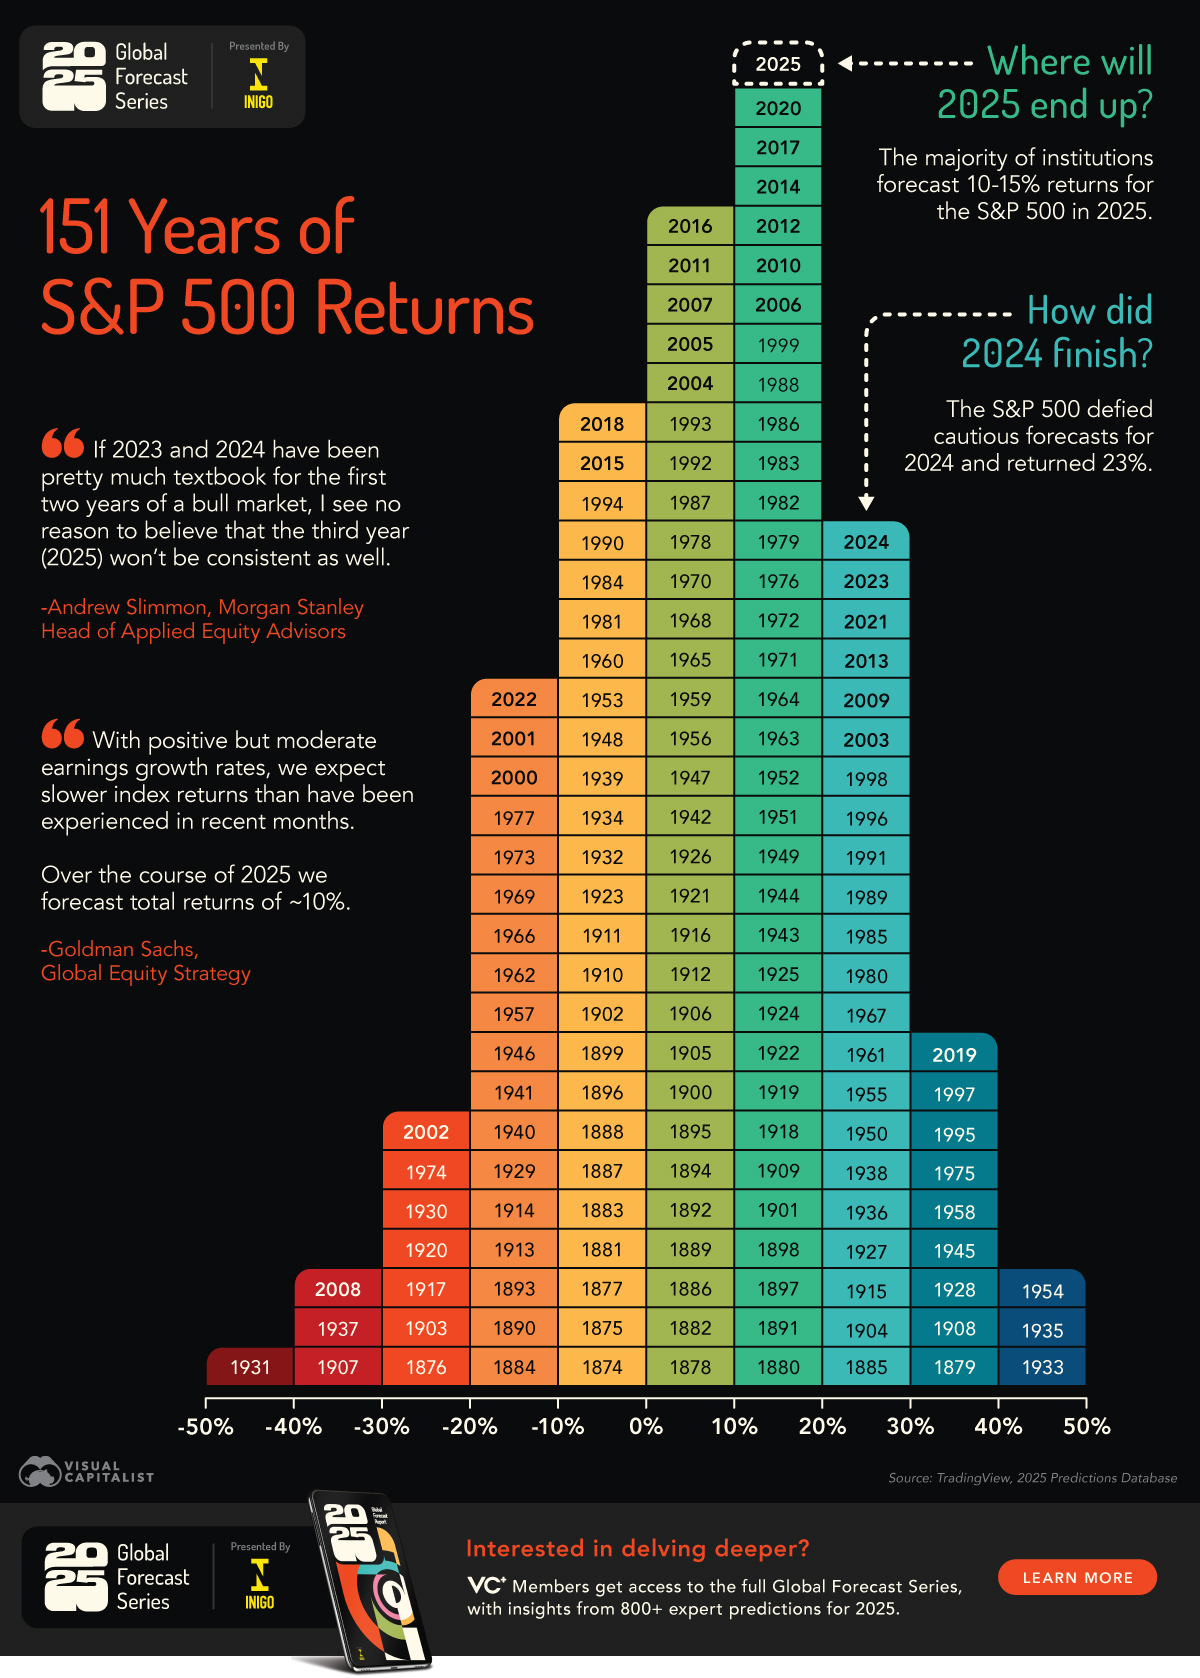
When people refer to the “average return” of the S&P 500, they are typically referring to its average annual return over a long period. Historically, from its inception in 1928 through to recent years (e.g., end of 2023), the S&P 500 has delivered an average annual return of approximately 10% to 12% before adjusting for inflation. This figure includes both capital appreciation (stock price growth) and reinvested dividends. Without dividends, the average annual capital appreciation component tends to be slightly lower, perhaps in the 8-10% range.
It’s crucial to understand that this “average” is an arithmetic mean calculated over many decades. It smooths out the peaks and valleys, giving a single, often enticing, number. For instance, while the average might be 10%, individual years can see returns ranging from significant gains (e.g., +30% or more) to substantial losses (e.g., -30% or more), as evidenced during the dot-com bubble burst, the 2008 financial crisis, or the COVID-19 pandemic-induced downturn. This long-term average has made the S&P 500 a cornerstone of many retirement planning strategies, demonstrating the power of consistent, long-term exposure to the market.
The Importance of Time Horizon
The “average” return becomes most meaningful over extended periods. Short-term performance can be highly erratic and unpredictable. Over a single year, or even a few years, returns can deviate significantly from the historical average. This is why financial advisors consistently preach the importance of a long-term investment horizon. Over 10, 20, or even 30 years, the short-term volatility tends to smooth out, and the power of compounding allows the average return to manifest itself more reliably. An investor who panicked and sold during a downturn would miss the subsequent recovery and the long-term growth that contributes to the high historical average. Patience and a steadfast commitment to a long-term strategy are arguably as important as understanding the average return itself.
Factors Influencing S&P 500 Returns
The S&P 500’s performance is not arbitrary; it is the culmination of myriad economic, political, and social forces that impact corporate profitability and investor sentiment.
Economic Growth and Corporate Earnings
At its core, the stock market reflects the health and growth prospects of the underlying companies. Sustained economic growth, characterized by rising GDP, low unemployment, and increased consumer spending, typically translates into higher corporate revenues and profits. Since the S&P 500 comprises leading U.S. companies, their collective earnings are a primary driver of the index’s performance. Strong earnings growth often leads to higher stock prices, as investors anticipate future dividends and capital appreciation. Conversely, economic slowdowns or recessions tend to depress earnings, leading to market corrections or prolonged bear markets. Inflation can also play a complex role, as moderate inflation can sometimes boost corporate revenues, but high, unchecked inflation can erode purchasing power and necessitate restrictive monetary policies that harm growth.
Interest Rates and Monetary Policy
The Federal Reserve’s monetary policy, particularly its stance on interest rates, significantly influences market returns. Lower interest rates generally make borrowing cheaper for companies, encouraging investment and expansion, which can boost stock prices. They also make bonds and savings accounts less attractive, pushing investors towards riskier assets like stocks in search of higher returns. Conversely, higher interest rates increase borrowing costs, can slow economic activity, and make fixed-income investments more appealing, drawing capital away from the stock market. The Fed’s forward guidance and actual policy actions are closely watched by investors for clues about the future direction of the market. Quantitative easing and tightening also fall under monetary policy, directly impacting liquidity and asset prices.
Geopolitical Events and Market Sentiment
Global events, from political elections and trade disputes to international conflicts and natural disasters, can trigger significant shifts in investor sentiment and market behavior. Uncertainty often leads to volatility, as investors become risk-averse, sometimes pulling capital out of equities. Conversely, positive geopolitical developments or the resolution of conflicts can instill confidence and fuel market rallies. Market sentiment, driven by fear and greed, can sometimes override fundamental economic data in the short term, leading to irrational exuberance or unwarranted pessimism. While these events are often unpredictable, their impact on corporate supply chains, consumer confidence, and government policy can have a ripple effect on S&P 500 returns.
Inflation and Purchasing Power
Inflation, the rate at which the general level of prices for goods and services is rising, plays a critical role in the real return an investor experiences. While a 10% nominal return sounds good, if inflation is 5%, the real purchasing power gain is only 5%. High inflation erodes the value of future earnings and dividends, and can force central banks to raise interest rates, further impacting stock valuations. Certain sectors or companies may perform better during inflationary periods (e.g., those with pricing power), while others may struggle. Investors must always consider inflation when evaluating the attractiveness of the S&P 500’s average nominal return. Protecting against inflation is a key objective for many long-term investors.
Beyond the Average: Volatility and Risk
While the average return paints an attractive picture, it’s crucial to acknowledge the inherent volatility and risks associated with stock market investing.
The Nature of Market Fluctuations
The stock market doesn’t move in a straight line. It’s characterized by periods of rapid ascent, sharp declines (corrections or bear markets), and sideways movement. These fluctuations are normal and are an intrinsic part of investing in equities. Corrections (a drop of 10-20% from a recent peak) occur relatively frequently, while bear markets (a drop of 20% or more) are less common but more severe. Understanding that these movements are part of the process helps investors maintain a long-term perspective and avoid making impulsive decisions driven by fear. The average return is achieved by weathering these storms and remaining invested through both good times and bad.
Standard Deviation and Risk Assessment
For a more robust understanding of risk than simply looking at the average, financial professionals often use metrics like standard deviation. Standard deviation measures how much the S&P 500’s returns have deviated from its average over a given period. A higher standard deviation indicates greater volatility and, consequently, higher risk. For example, an investment with an average annual return of 10% and a standard deviation of 15% means that, in roughly two-thirds of years, the actual return will fall between -5% (10%-15%) and 25% (10%+15%). This gives investors a clearer picture of the range of possible outcomes and helps them assess whether the potential returns justify the associated level of variability and risk.
Diversification as a Risk Mitigation Strategy
While the S&P 500 itself offers broad diversification across 500 companies and numerous sectors, investors can further mitigate risk by diversifying beyond just this single index. This could involve allocating capital to other asset classes such as bonds, real estate, commodities, or international stocks. The principle of diversification is not to eliminate risk entirely but to reduce non-systematic risk (risk specific to individual companies or sectors) and to smooth out overall portfolio returns. When one asset class is underperforming, another might be outperforming, thereby balancing the overall portfolio. A well-diversified portfolio aims to achieve a target return with the lowest possible level of risk, or conversely, maximize return for a given level of risk.
S&P 500 Returns in the Context of Investment Strategy
Understanding the S&P 500’s average return is most valuable when integrated into a broader investment strategy.
Passive vs. Active Investing
The consistent, historically strong average return of the S&P 500 forms the bedrock of passive investing. Passive investors typically opt for low-cost index funds or ETFs that track the S&P 500, aiming to replicate its market-average performance. The philosophy is that over the long run, very few active fund managers consistently beat the market after fees, making passive investing a cost-effective and often superior strategy. Active investing, on the other hand, involves stock picking or market timing, attempting to outperform the S&P 500. While some active managers do succeed, it’s a challenging endeavor, and the majority fail to beat the index over extended periods, especially after accounting for higher fees. The S&P 500’s average return serves as a powerful benchmark against which all investment strategies are measured.
Comparing S&P 500 to Other Asset Classes
When constructing a portfolio, investors often compare the S&P 500’s potential returns to those of other asset classes. Historically, equities (represented by the S&P 500) have provided higher long-term returns than bonds, cash, or gold. However, stocks also come with higher volatility. Bonds offer lower returns but provide stability and income, often serving as a ballast during stock market downturns. Real estate and commodities have their own risk/return profiles. The optimal asset allocation depends on an individual’s financial goals, risk tolerance, and time horizon. For long-term growth, a significant allocation to equities, often via an S&P 500 tracker, is a common recommendation.
The Role of Reinvestment and Compounding
Perhaps the most magical aspect of the S&P 500’s average return is the effect of compounding, particularly when dividends are reinvested. Compounding is the process of earning returns not only on your initial investment but also on the accumulated returns from previous periods. When dividends paid by S&P 500 companies are automatically reinvested back into more shares, this accelerates the compounding process significantly. A substantial portion of the S&P 500’s historical average return comes from the powerful effect of reinvested dividends. This highlights the importance of not just achieving a good return, but allowing that return to work for you over many years.
Practical Implications for Investors
Understanding the S&P 500’s average return translates into actionable insights for effective financial planning.
Setting Realistic Expectations
While the historical average of 10-12% is appealing, investors must set realistic expectations. It’s an average, not a guarantee. There will be years of underperformance and years of outperformance. Expecting consistent double-digit returns year after year can lead to disappointment and poor decision-making during inevitable market downturns. A balanced perspective acknowledges the long-term potential while being prepared for short-term fluctuations. It’s about staying disciplined and focusing on your financial goals rather than market noise.
Long-Term Perspective is Key
The most profound lesson from the S&P 500’s historical data is the paramount importance of a long-term perspective. Short-term speculation is fraught with risk, but long-term investing, particularly in a broadly diversified index like the S&P 500, has historically been a powerful engine for wealth creation. Investors who commit to holding their investments for decades, riding out market cycles, are the ones most likely to capture the full benefit of the S&P 500’s average return and the compounding effect. Time in the market, not timing the market, is the adage to remember.

When to Seek Professional Advice
For many, navigating the complexities of investing, understanding risk, and building a diversified portfolio can be daunting. While understanding the S&P 500’s average return is a great starting point, a qualified financial advisor can provide personalized guidance. They can help assess individual risk tolerance, define financial goals, create an appropriate asset allocation strategy, and ensure an investor remains on track, especially during volatile periods. Even for those well-versed in financial markets, a professional perspective can offer valuable insights and accountability.
In conclusion, the S&P 500’s average return is more than just a historical statistic; it’s a testament to the enduring growth potential of the U.S. economy and a powerful tool for long-term wealth accumulation. By understanding its components, the factors that influence it, and its place within a broader investment strategy, investors can harness its power to build a secure financial future.
aViewFromTheCave is a participant in the Amazon Services LLC Associates Program, an affiliate advertising program designed to provide a means for sites to earn advertising fees by advertising and linking to Amazon.com. Amazon, the Amazon logo, AmazonSupply, and the AmazonSupply logo are trademarks of Amazon.com, Inc. or its affiliates. As an Amazon Associate we earn affiliate commissions from qualifying purchases.