
For investors, financial analysts, and anyone with an eye on the economy, few metrics carry as much weight and generate as much discussion as the annual return of the S&P 500. Often referred to simply as “the market,” this index is widely regarded as the best single gauge of large-cap U.S. equities and a proxy for the overall health of the American economy. Understanding its historical performance, the nuances of its returns, and the factors that drive them is fundamental to informed financial planning and investment strategy.
The allure of the S&P 500 lies in its seemingly consistent long-term growth, which has historically outpaced inflation and many other asset classes. However, diving deeper reveals a complex interplay of economic forces, corporate performance, and market sentiment that shapes its yearly fluctuations. This article will demystify the S&P 500’s annual returns, exploring what they truly represent, how they are calculated, and what influences their ebb and flow, providing a comprehensive perspective for both novice and seasoned investors.
Understanding the S&P 500 and its Historical Performance
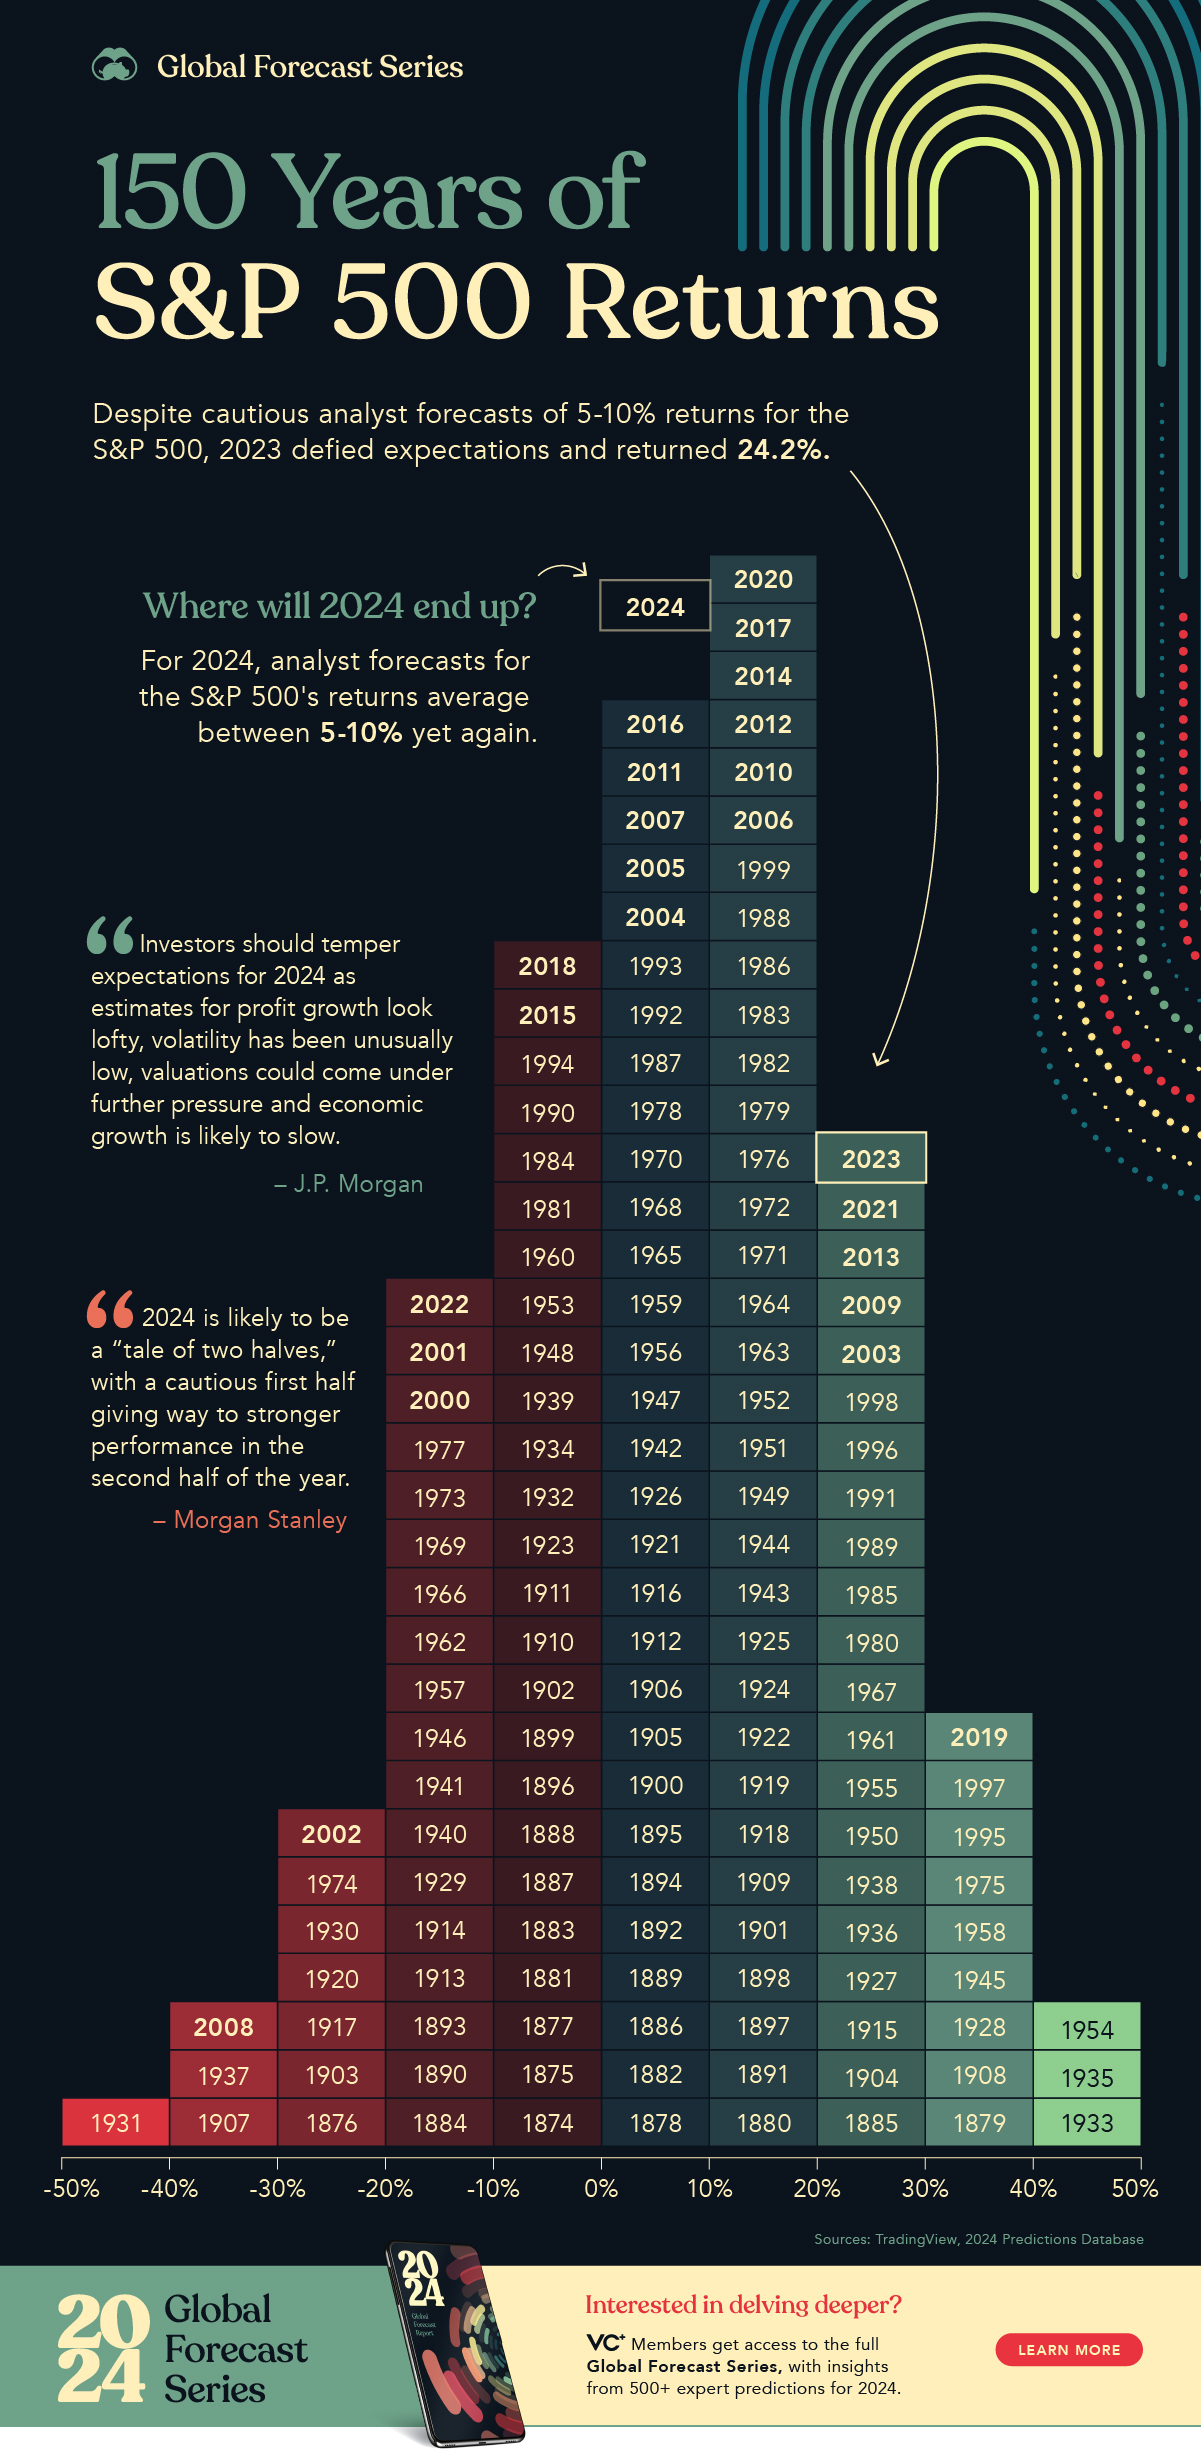
To appreciate the significance of the S&P 500’s annual return, it’s crucial to first grasp what the index is and how it functions as a barometer for the U.S. stock market. Its historical performance serves as a cornerstone for long-term investment planning, yet it’s vital to distinguish between averages and the sometimes-volatile reality of year-to-year results.
What is the S&P 500?
The S&P 500, or the Standard & Poor’s 500, is a stock market index that represents 500 of the largest publicly traded companies in the United States, selected by S&P Dow Jones Indices. These companies are chosen based on criteria such as market size, liquidity, and sector representation, making the index a diversified representation of the U.S. economy across various industries. Unlike indices that are simply price-weighted, the S&P 500 is market-capitalization-weighted, meaning companies with larger market values have a greater impact on the index’s movement. This structure makes it a highly effective benchmark for the performance of large-cap U.S. stocks and, by extension, a significant indicator of the broader economic landscape. Investors often use the S&P 500 as a proxy for the “market” because it encompasses a substantial portion of the total value of the U.S. stock market.
A Look at Average Historical Returns
When people talk about the “average annual return” of the S&P 500, they typically refer to its performance over a very long period, often since its inception or over several decades. Historically, the S&P 500 has delivered an average annual return of approximately 10% to 12% per year, including reinvested dividends. This figure is frequently cited as a baseline for long-term equity investing. However, it’s critical to understand that this is an average. It smooths out the peaks and valleys of market cycles, including periods of robust growth, significant downturns, and stagnant years.
Distinguishing between nominal and real returns is also paramount. Nominal return is the stated percentage gain, while real return accounts for the erosion of purchasing power due to inflation. For instance, a 10% nominal return in a year with 3% inflation yields a real return of approximately 7%, which is what truly matters for your long-term wealth. While historical averages provide a valuable context for expected long-term growth, they are not a guarantee of future performance and do not reflect the volatility experienced in any single year.
The Impact of Compounding
One of the most powerful forces behind the S&P 500’s long-term wealth creation is the principle of compounding. Compounding refers to the process where your investment gains generate their own returns. When dividends are reinvested and capital gains are allowed to grow, the returns from previous periods begin to earn returns themselves, leading to exponential growth over time. For example, an initial investment of $10,000 earning an average of 10% annually would grow to significantly more than $20,000 in ten years, not just $10,000 in simple interest. The longer the investment horizon, the more pronounced the effect of compounding becomes. This “snowball effect” is why even modest average annual returns can transform into substantial wealth over decades, underscoring the importance of early investment and a long-term perspective.
Dissecting Annual Returns: More Than Just a Number
While the long-term average return of the S&P 500 offers a reassuring perspective, focusing solely on this figure can be misleading. A deeper dive into how annual returns fluctuate and what components make up the “total return” provides a more nuanced and accurate picture for investors.
Variability Year-to-Year
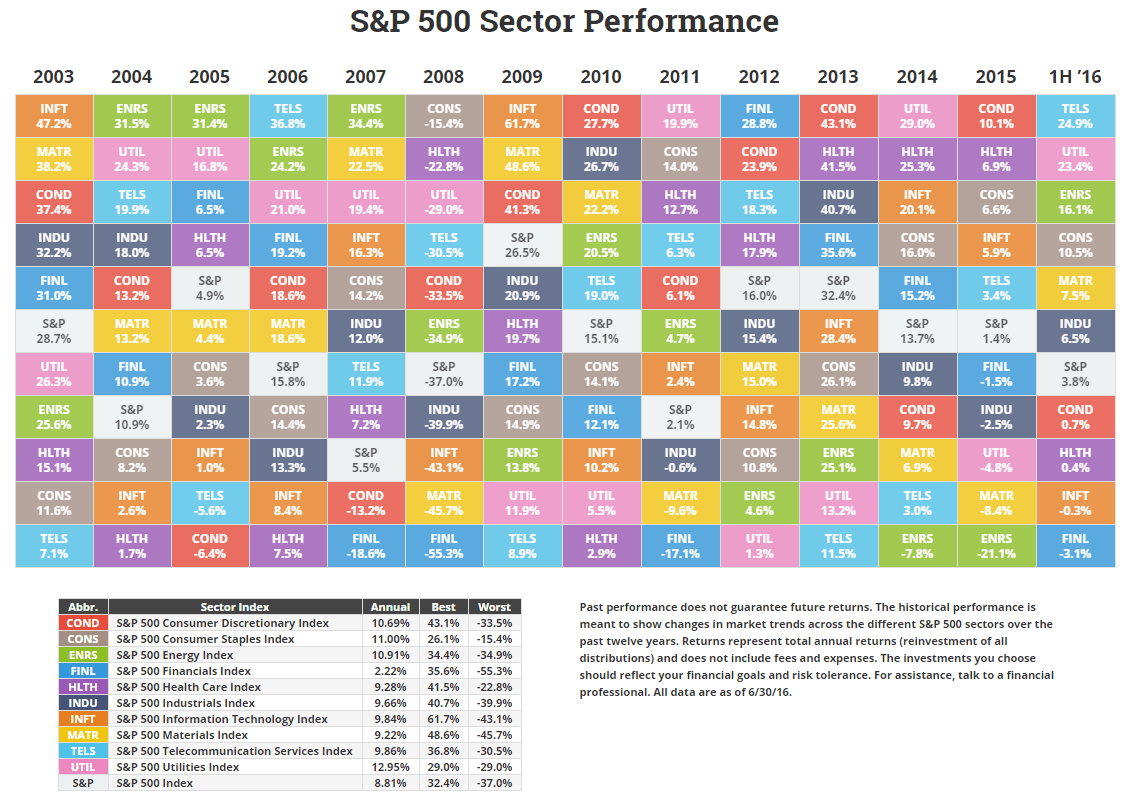
The S&P 500’s annual returns are far from consistent. While the average might be 10-12%, individual years can see returns ranging from significant gains (e.g., over 30% in some bullish years) to substantial losses (e.g., over 30% in bear markets like 2008). This year-to-year variability is a hallmark of equity investing. For instance, a year with a -20% return might be followed by a year with a +25% return. This volatility highlights why market timing – attempting to buy low and sell high on a short-term basis – is notoriously difficult and often detrimental to long-term returns. Investors who panic and sell during downturns often miss the subsequent recovery, locking in losses and forfeiting potential gains. Understanding this inherent variability reinforces the importance of a disciplined, long-term investment strategy that can withstand market fluctuations.
Total Return vs. Price Return
When discussing the performance of the S&P 500, it’s crucial to differentiate between price return and total return.
- Price Return reflects only the capital appreciation of the index, meaning the change in the market price of the stocks. If the index starts at 4,000 points and ends at 4,400 points, that’s a 10% price return.
- Total Return, which is generally the more relevant metric for investors, includes both the capital appreciation and the income generated by the investments, primarily through dividends. Companies in the S&P 500 regularly pay dividends to shareholders, and when these dividends are reinvested back into the index, they purchase more shares, which then generate their own dividends and capital appreciation. Historically, dividends have contributed a significant portion (often 20-40%) of the S&P 500’s total return over the long run. Therefore, an investor tracking their wealth growth should always focus on the total return, as it provides a comprehensive measure of an investment’s performance.
Inflation’s Role: Real vs. Nominal Returns
Inflation is an often-overlooked yet critical factor when evaluating investment returns. As mentioned earlier, nominal return is the raw percentage gain of an investment. However, inflation erodes the purchasing power of money over time. A 10% nominal return when inflation is 5% means your real purchasing power has only increased by approximately 5%. Over long periods, even modest inflation can significantly diminish the true value of your investment gains. For long-term financial planning, such as retirement savings, calculating real returns is essential to understand how much your wealth is truly growing in terms of what it can buy. Investors need returns that not only grow their capital but also outpace inflation to genuinely increase their financial well-being. This is one of the primary reasons why investing in equities, like through the S&P 500, is often favored over simply holding cash, as stocks have historically demonstrated an ability to provide real returns above inflation.
Key Factors Influencing S&P 500 Returns
The S&P 500’s annual performance is not random; it’s a complex interplay of numerous macroeconomic and microeconomic factors. Understanding these drivers helps investors anticipate potential market movements and contextualize past performance.
Economic Growth and Corporate Earnings
At its core, the stock market reflects the health and future prospects of the underlying companies. Strong economic growth, characterized by rising GDP, low unemployment, and increased consumer spending, typically translates into higher corporate revenues and earnings. When companies are profitable and growing, their stock prices tend to rise, which in turn boosts the S&P 500 index. Conversely, economic slowdowns or recessions often lead to decreased corporate profits, prompting investors to sell stocks and resulting in a decline in the index. Investor confidence also plays a significant role; if businesses and consumers are optimistic about the future, they are more likely to invest and spend, creating a positive feedback loop for stock market performance. Earnings reports, therefore, are closely watched, as they offer tangible evidence of corporate health and the broader economic trajectory.
Interest Rates and Monetary Policy
Central banks, such as the U.S. Federal Reserve, wield significant influence over market returns through their monetary policy, particularly by adjusting interest rates. Lower interest rates generally make it cheaper for companies to borrow money for expansion, stimulating economic activity and making stocks more attractive compared to lower-yielding bonds. Higher interest rates, conversely, can increase borrowing costs for businesses and consumers, slow down economic growth, and make bonds more appealing, potentially drawing money away from equities. The Fed’s forward guidance and actions on interest rates, quantitative easing, or tightening can therefore have a profound psychological and practical impact on investor sentiment, company valuations, and overall S&P 500 performance. Changes in interest rate expectations often lead to immediate market reactions.
Geopolitical Events and Market Sentiment
Beyond fundamental economic indicators and monetary policy, global events and shifting market sentiment can cause significant short-term volatility in the S&P 500. Geopolitical events, such as wars, trade disputes, political instability in major economies, or even natural disasters, can introduce uncertainty, disrupt supply chains, and impact investor confidence, leading to sell-offs. Similarly, shifts in market sentiment—often driven by news headlines, social media trends, or collective psychological biases—can create bubbles or panics unrelated to underlying corporate fundamentals. For example, a sudden surge in oil prices due to political tensions can impact transportation costs for companies, raising inflation fears and affecting profitability across various sectors. While these events often cause temporary disruptions, their duration and severity can vary greatly, sometimes leading to prolonged periods of uncertainty.
Investing Strategies Informed by S&P 500 Returns
Understanding the S&P 500’s historical performance and the factors influencing it isn’t just academic; it directly informs effective investment strategies. Savvy investors leverage this knowledge to build resilient portfolios aimed at long-term wealth creation.
The Long-Term Perspective
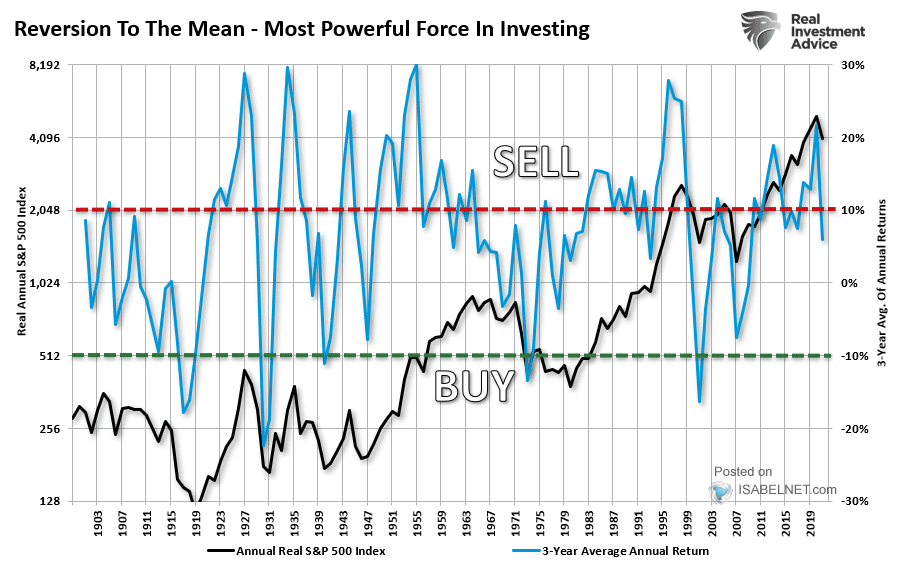
Perhaps the most crucial lesson from the S&P 500’s history is the power of a long-term perspective. While annual returns are highly volatile, the index has consistently delivered positive real returns over extended periods (10+ years). This emphasizes the futility and danger of market timing. Instead of attempting to predict short-term ups and downs, a buy-and-hold strategy, investing consistently over many years, allows investors to ride out downturns and benefit from eventual recoveries and long-term compounding. Missing just a few of the best-performing days can dramatically reduce overall returns. By committing to a long-term horizon, investors minimize the impact of short-term volatility and maximize their chances of benefiting from the market’s historical growth trajectory. Patience, not prediction, is the investor’s greatest virtue when it comes to the S&P 500.
Diversification Beyond the S&P 500
While the S&P 500 is an excellent core holding due to its diversification across 500 large U.S. companies, a truly robust portfolio often extends diversification beyond it. The S&P 500 represents only large-cap U.S. equities. For broader diversification, investors might consider adding:
- International stocks: Exposure to developed and emerging markets helps mitigate risks associated with solely relying on the U.S. economy.
- Small-cap and mid-cap stocks: These offer potential for higher growth, albeit with higher volatility, complementing the stability of large-caps.
- Bonds: Government and corporate bonds typically offer lower returns but also lower volatility, acting as a ballast during stock market downturns.
- Alternative assets: Real estate, commodities, or other alternative investments can further reduce correlation within a portfolio.
Diversification across different asset classes, geographies, and company sizes helps smooth out overall portfolio returns, reducing reliance on any single market segment and potentially enhancing risk-adjusted returns.
Dollar-Cost Averaging
Dollar-cost averaging is a simple yet powerful strategy that directly addresses market volatility. It involves investing a fixed amount of money at regular intervals (e.g., monthly or quarterly), regardless of the S&P 500’s current price. When prices are high, your fixed investment buys fewer shares; when prices are low, it buys more shares. Over time, this strategy averages out your purchase price, reducing the risk of making a large investment at a market peak. It automates disciplined saving and removes the emotional component from investing decisions. For investors building wealth over years or decades, dollar-cost averaging is an effective way to navigate the S&P 500’s natural ups and downs without trying to time the market, making it an ideal strategy for retirement accounts and regular savings.
Reinvesting Dividends
As discussed, dividends are a significant component of the S&P 500’s total return. A smart strategy is to automatically reinvest these dividends. Instead of taking the dividend payments as cash, reinvesting them buys additional shares (or fractions of shares) of the underlying index fund or ETF. This amplifies the effect of compounding, as these newly purchased shares then generate their own dividends and capital appreciation. Over long periods, the act of reinvesting dividends can dramatically increase the overall value of an investment, often contributing a substantial portion to the total return compared to just taking the price appreciation. It’s a passive way to continuously expand your holdings and supercharge your long-term growth within the S&P 500.
The S&P 500 remains a cornerstone of informed investing, providing a crucial benchmark for market performance and a vehicle for long-term wealth accumulation. While its average historical returns are compelling, a deeper understanding of its annual variability, the difference between price and total returns, and the pervasive impact of inflation is essential. Furthermore, recognizing the economic, monetary, and geopolitical factors that shape its movements allows investors to approach the market with greater insight. By adopting strategies such as a long-term perspective, broad diversification, dollar-cost averaging, and dividend reinvestment, investors can effectively harness the power of the S&P 500 to work towards their financial goals, always remembering that while past performance offers valuable lessons, it does not guarantee future results.
aViewFromTheCave is a participant in the Amazon Services LLC Associates Program, an affiliate advertising program designed to provide a means for sites to earn advertising fees by advertising and linking to Amazon.com. Amazon, the Amazon logo, AmazonSupply, and the AmazonSupply logo are trademarks of Amazon.com, Inc. or its affiliates. As an Amazon Associate we earn affiliate commissions from qualifying purchases.