
The S&P 500 index stands as a towering benchmark in the financial world, widely recognized as the most comprehensive gauge of large-cap U.S. equities and, by extension, the overall health of the American economy. For countless investors, understanding its historical performance is not merely an academic exercise but a cornerstone of their investment strategy. Whether you’re a seasoned investor evaluating portfolio benchmarks or a newcomer exploring the foundations of wealth building, the question “What is the average return of the S&P 500?” is often among the first to arise. This article delves into the nuances of this critical metric, exploring its historical trajectory, the factors influencing its performance, and its profound implications for strategic long-term investing.
Deconstructing the S&P 500: America’s Economic Barometer
To truly appreciate the S&P 500’s average returns, it’s essential to first grasp what the index represents and why it holds such significant sway in global financial markets. Far more than just a number, the S&P 500 is a dynamic reflection of America’s corporate prowess and economic vitality.
A Definitive Overview of the Index
The S&P 500, or Standard & Poor’s 500, is a market-capitalization-weighted index comprising 500 of the largest publicly traded companies in the United States. While it’s named for 500 companies, it actually includes 500 stocks, sometimes representing more companies if one company has multiple share classes listed. These companies are selected by a committee at S&P Dow Jones Indices based on criteria such as market size, liquidity, and sector representation, ensuring that the index accurately reflects the broad U.S. economy. Because it’s market-cap-weighted, companies with larger market valuations have a greater impact on the index’s performance. This mechanism means that the movements of giants like Apple, Microsoft, Amazon, and Google (Alphabet) carry more weight than smaller constituents within the index.
Founded in 1957, the S&P 500 replaced earlier, narrower indices and quickly became the dominant benchmark for institutional investors, mutual funds, and exchange-traded funds (ETFs). Its comprehensive nature, covering approximately 80% of the total market capitalization of the U.S. stock market, makes it an indispensable tool for understanding market trends and corporate performance.
Why the S&P 500 Matters to Investors
For individual and institutional investors alike, the S&P 500 serves multiple critical functions. Firstly, it acts as a primary benchmark for comparing the performance of investment portfolios and active fund managers. If a fund manager consistently underperforms the S&P 500, investors might question their strategy or fees. Secondly, investing in an S&P 500 index fund or ETF offers instant, broad diversification across numerous sectors and industries within the U.S. economy. This diversification significantly reduces idiosyncratic risk—the risk associated with any single company’s poor performance—as the failure of one or two companies will have a minimal impact on the overall index.
Moreover, the S&P 500 is widely regarded as a reliable proxy for the U.S. economy’s health and growth potential. Its constituents are often global leaders, generating revenue not just domestically but worldwide. Therefore, its performance often reflects broader economic cycles, corporate earnings trends, consumer sentiment, and technological advancements. For long-term investors, gaining exposure to this index is a strategy to participate in the general prosperity and growth of the American capitalist system, aiming to build wealth over decades rather than attempting to pick individual winners in the short term.
Unveiling the S&P 500’s Historical Performance
When investors ask about the “average return,” they are typically seeking a quantifiable measure of the S&P 500’s historical growth. While a single number is often cited, the reality is more nuanced, requiring an understanding of how returns are calculated and how they vary across different timeframes.
The Iconic 10-12% Figure: Context and Caveats
The most frequently quoted average annual return for the S&P 500 is often cited as somewhere between 10% and 12% per year. This figure generally refers to the long-term historical average, typically calculated since the index’s inception in 1957 or over an even longer period encompassing data from its predecessors. For instance, looking at data from 1957 through the end of 2023, the annualized average total return (including dividends) hovers around the 10-11% mark. If we extend that back further to 1928, considering data from Standard & Poor’s Composite Index, the average can be closer to 10% or slightly higher.
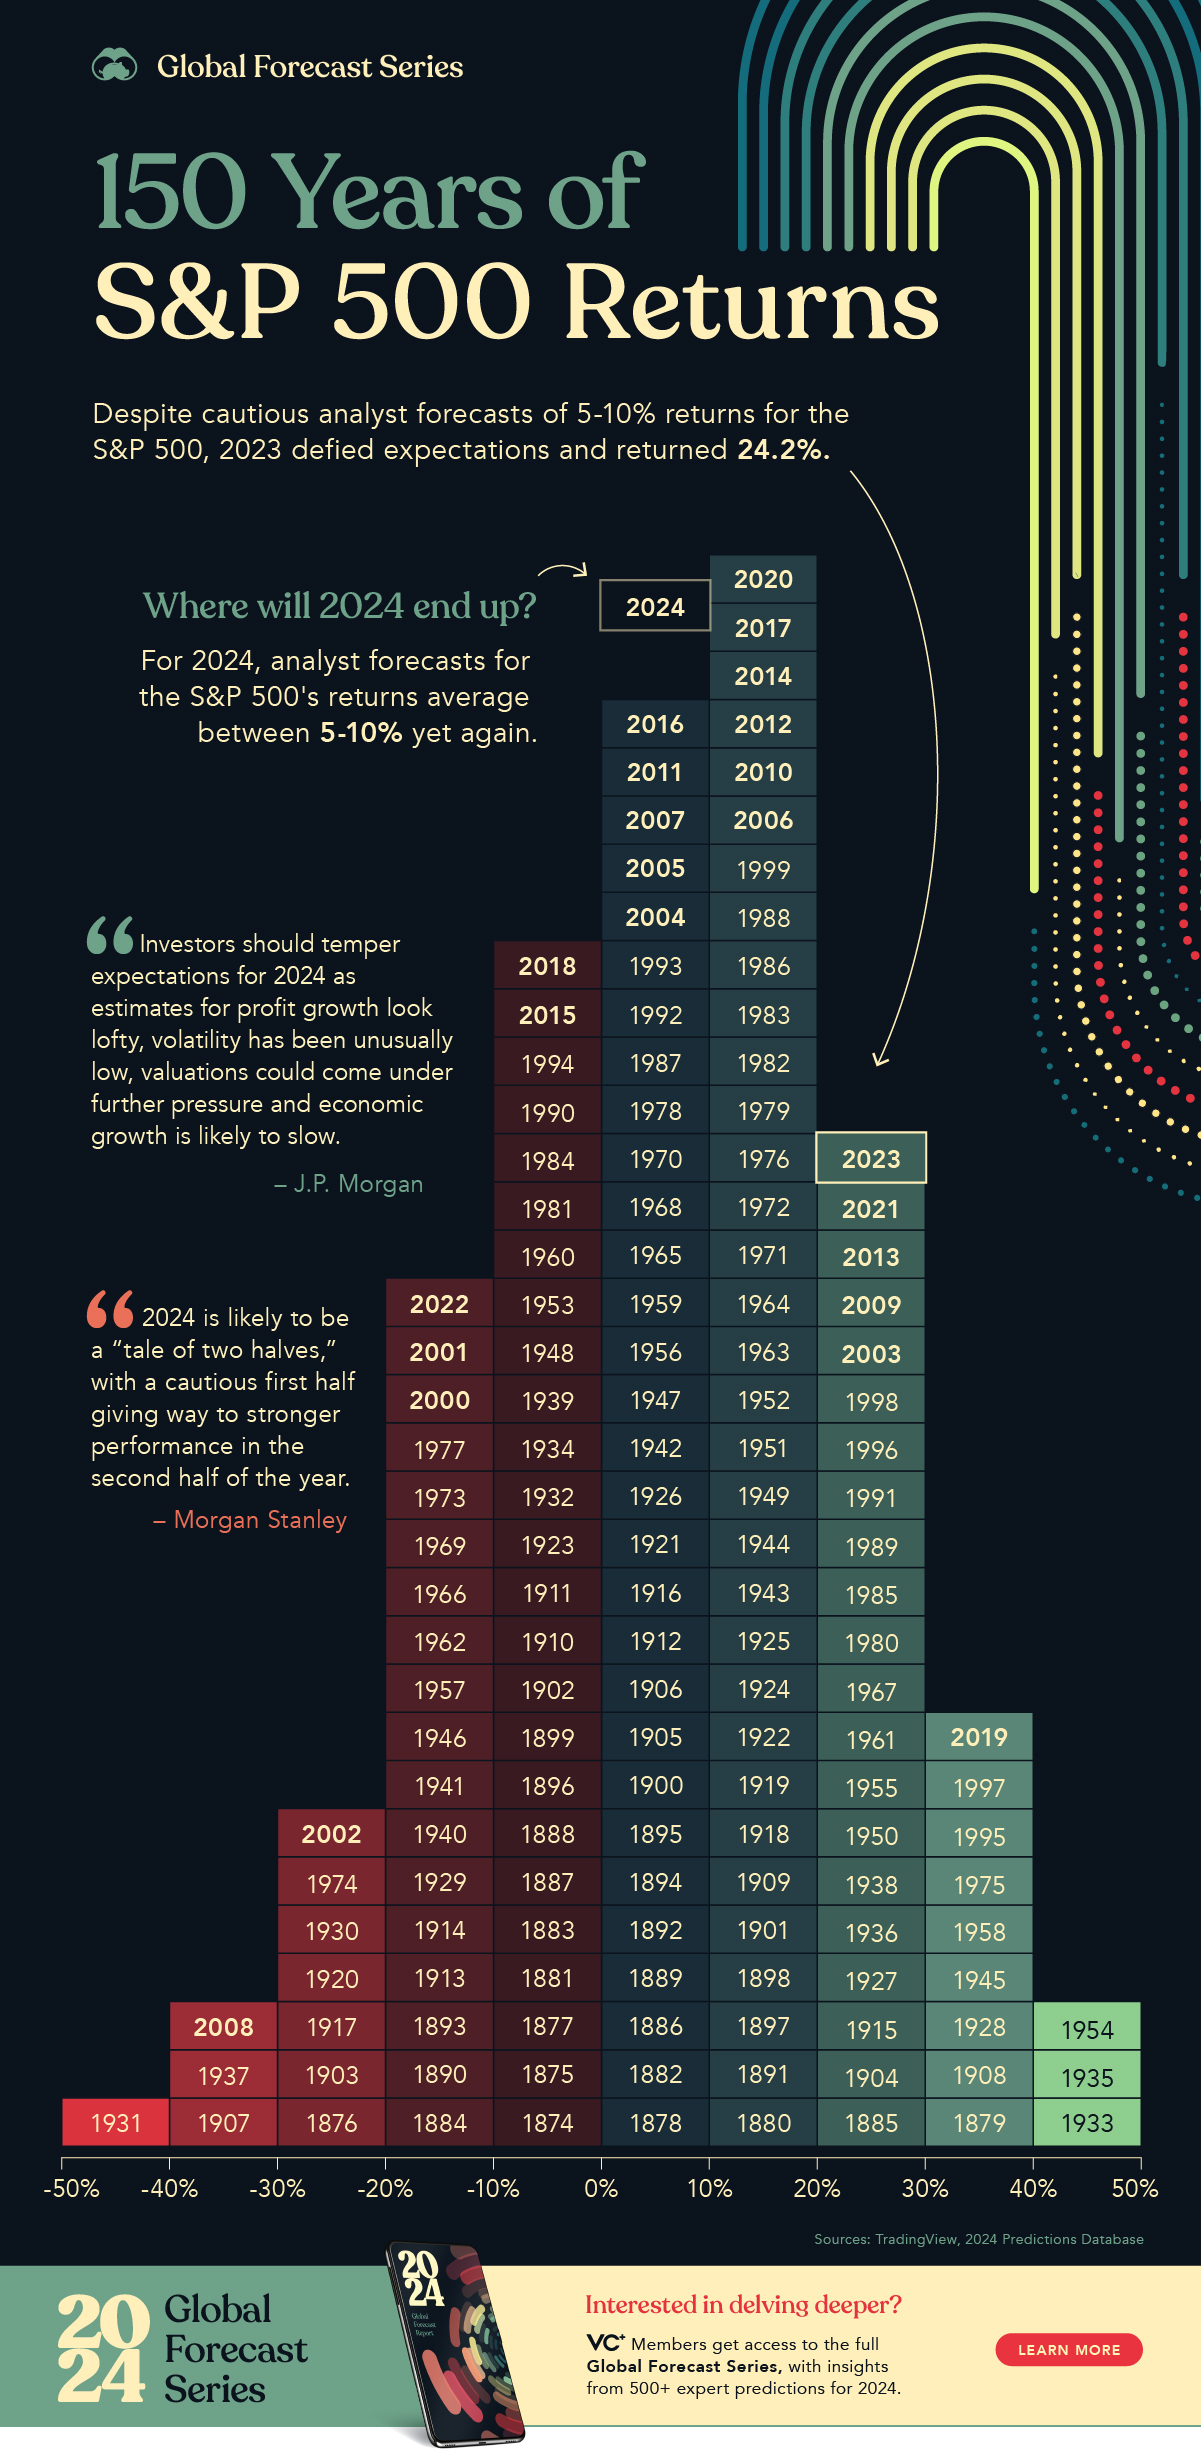
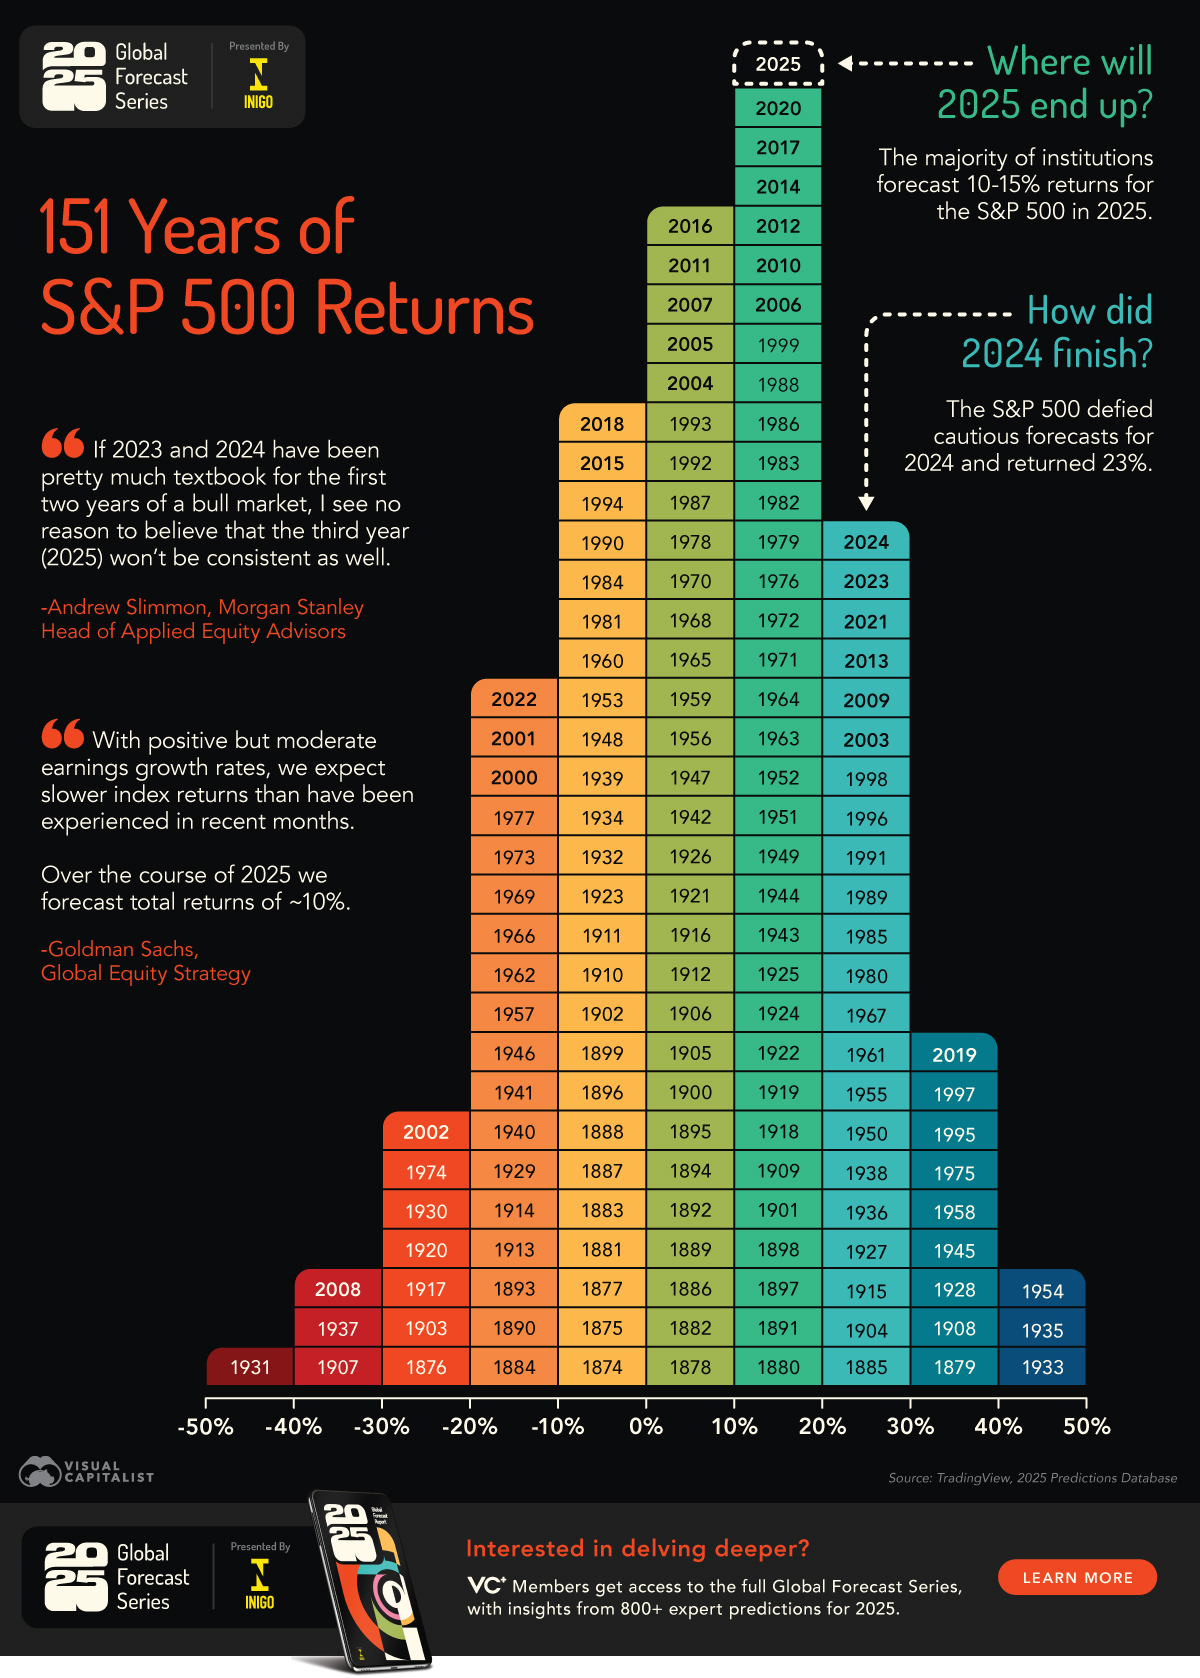
It’s crucial to understand that this is an average. It represents a mean return over many decades, smoothing out the significant ups and downs experienced year to year. The S&P 500 has had years where it returned over 30% (e.g., 1995, 1997, 2013, 2019) and years where it lost over 30% (e.g., 2008). The average provides a powerful testament to the market’s long-term upward trajectory despite these periods of volatility, driven by economic growth, innovation, and corporate profitability.
Price Return vs. Total Return: A Critical Distinction
A fundamental aspect of accurately assessing S&P 500 returns is understanding the difference between price return and total return. This distinction is often overlooked but profoundly impacts actual investor gains.
- Price Return: This refers solely to the change in the market price of the stocks within the index. If the S&P 500 index value goes from 4,000 to 4,400, that’s a 10% price return. This measure excludes any income generated from the stocks themselves.
- Total Return: This is the more accurate and relevant metric for investors. Total return includes both the price appreciation of the underlying stocks and the reinvestment of dividends paid by those companies. Historically, dividends have contributed a significant portion of the S&P 500’s total return, often accounting for 2-4 percentage points of the annual average.
For example, while the S&P 500’s average price return might be closer to 7-8% annually over the long run, its average total return often reaches 10-12% when dividends are factored in and assumed to be reinvested. For investors holding S&P 500 index funds or ETFs, it is the total return that reflects their actual compounded gains over time, making it the most appropriate figure to consider for financial planning and wealth accumulation.
Performance Across Different Time Horizons
While the long-term average is informative, examining returns over varying timeframes offers a more nuanced perspective on the S&P 500’s performance and the impact of market cycles.
- Short-Term (1-5 Years): Returns in the short term are highly volatile and unpredictable. A single year could see returns anywhere from -37% (2008) to +34% (1995). Attempting to time the market based on short-term averages is generally a losing proposition.
- Medium-Term (10-20 Years): Over a decade or two, the power of compounding and the market’s general upward bias begin to smooth out volatility. For instance, the annualized total return for the S&P 500 over the past 10 years (ending 2023) has been approximately 12-14%. Over the past 20 years, encompassing the dot-com bust, the 2008 financial crisis, and subsequent bull markets, the annualized total return has been closer to 9-10%. These figures highlight that even significant market downturns can be overcome given sufficient time.
- Long-Term (50+ Years): This is where the 10-12% historical average truly shines. Over periods spanning several market cycles, recessions, wars, and technological revolutions, the S&P 500 has consistently delivered robust inflation-beating returns. This consistent performance underscores the fundamental principle of long-term investing in diversified equity markets: patience is rewarded. It also demonstrates the resilience of the American corporate landscape and its ability to adapt and grow.
Driving Forces Behind S&P 500 Returns
The S&P 500’s performance is not a random walk; it is influenced by a complex interplay of economic fundamentals, market psychology, and global events. Understanding these drivers provides deeper insight into the index’s historical patterns and potential future trajectories.
Macroeconomic Indicators and Corporate Health
At the core of the S&P 500’s performance are the health and growth prospects of the underlying companies, which are inextricably linked to broader macroeconomic conditions. Corporate earnings growth is perhaps the single most significant determinant. As companies grow their profits, their stock prices tend to rise. Factors like Gross Domestic Product (GDP) growth signal economic expansion, which typically translates to higher corporate revenues and earnings.
Interest rates, largely controlled by the Federal Reserve, play a crucial role. Lower interest rates generally make borrowing cheaper for companies (stimulating investment) and make stocks relatively more attractive compared to bonds, thus supporting higher valuations. Conversely, rising rates can depress stock prices. Inflation is another critical factor; while moderate inflation is often a sign of a healthy economy, high inflation can erode purchasing power, increase business costs, and lead central banks to raise rates, all of which can negatively impact stock market returns.
Market Sentiment and Geopolitical Influences
Beyond pure financials, investor sentiment often dictates short-to-medium term market movements. Fear and greed cycles can lead to overreactions, driving markets above or below their intrinsic value. News headlines, analyst ratings, and popular narratives can create momentum (or panic) that influences daily trading.
Furthermore, geopolitical events—ranging from international trade disputes and political instability to wars and pandemics—can have profound and immediate effects on market confidence and, consequently, S&P 500 performance. These events introduce uncertainty, prompting investors to de-risk or seek safe havens, which can cause significant market volatility, even if the underlying economic fundamentals remain relatively strong. However, markets often demonstrate remarkable resilience and tend to recover from such shocks over time.
Innovation and Sectoral Shifts
The S&P 500 is not a static entity; its composition constantly evolves to reflect the changing economic landscape. Technological advancements and innovation are powerful engines of growth that can propel certain sectors and companies to dominance. For instance, the rise of information technology, healthcare, and e-commerce companies has dramatically reshaped the index over the past few decades. Companies that fail to innovate or adapt risk falling out of the index, while new, dynamic players rise to take their place. This continuous renewal ensures that the S&P 500 remains a relevant and forward-looking representation of the leading edge of American capitalism, contributing to its sustained long-term growth.
Strategic Implications for Investors: Leveraging the S&P 500
Understanding the S&P 500’s average returns and the forces behind them provides invaluable insights for crafting effective investment strategies. For many, the index serves as a cornerstone for building long-term wealth.
The Power of Diversification and Long-Term Compounding
One of the most compelling reasons to invest in the S&P 500 is the inherent diversification it offers. By investing in an S&P 500 index fund or ETF, you simultaneously gain exposure to 500 of America’s largest and most influential companies across diverse sectors. This broad exposure mitigates the risk of any single company or industry significantly harming your portfolio. Should one company falter, the other 499 can cushion the blow, leading to a smoother overall return profile than investing in individual stocks.
Coupled with diversification is the immense power of long-term compounding. The historical average returns of 10-12%, particularly when dividends are reinvested, allow initial investments to grow exponentially over time. A relatively small sum invested early in one’s career, consistently contributed to, and allowed to compound over decades within an S&P 500 index fund, can grow into a substantial retirement nest egg. This effect is often referred to as “snowballing,” where returns themselves begin to generate returns.
Accessibility Through Index Funds and ETFs
Gaining exposure to the S&P 500 is remarkably easy and cost-effective for modern investors. Instead of buying individual shares of all 500 companies, which would be impractical, investors can simply purchase shares of an S&P 500 index fund (a type of mutual fund) or an S&P 500 ETF (Exchange Traded Fund). These vehicles are designed to passively track the performance of the index.
The advantages of S&P 500 index funds and ETFs are numerous:
- Low Expense Ratios: Because they are passively managed, they typically have significantly lower fees (expense ratios) compared to actively managed mutual funds. This means more of your investment returns stay in your pocket.
- Simplicity: They offer a straightforward way to invest in the broad market without needing to research individual stocks.
- Liquidity: ETFs, in particular, can be bought and sold throughout the trading day like individual stocks.
- Tax Efficiency: Their low turnover (infrequent buying and selling of underlying stocks) can lead to greater tax efficiency compared to actively managed funds.

Mitigating Risks and Future-Proofing Investments
While the historical average returns of the S&P 500 are impressive, it’s paramount for investors to remember the crucial disclaimer: past performance is not indicative of future results. Markets can and will experience periods of significant volatility, including corrections (drops of 10-20%) and bear markets (drops of 20% or more).
To navigate this inherent uncertainty and “future-proof” investments, several strategies are advisable:
- Long-Term Horizon: Commit to a long-term investment horizon (10+ years) to allow sufficient time for market cycles to play out and for compounding to work its magic.
- Dollar-Cost Averaging: Instead of trying to time the market, consistently invest a fixed amount of money at regular intervals (e.g., monthly). This strategy, known as dollar-cost averaging, ensures you buy more shares when prices are low and fewer when prices are high, averaging out your purchase price over time and mitigating the impact of market fluctuations.
- Diversification Beyond S&P 500: While the S&P 500 is diversified within U.S. large-cap equities, a truly diversified portfolio might also include international stocks, small-cap stocks, bonds, and other asset classes to further reduce overall portfolio risk and enhance potential returns.
- Regular Rebalancing: Periodically adjust your portfolio back to your target asset allocation. If stocks have performed exceptionally well, you might trim some S&P 500 exposure and reallocate to other assets to maintain your desired risk level.
In conclusion, the S&P 500’s historical average total return of 10-12% is a powerful testament to the long-term wealth-generating potential of diversified equity investing. It serves as a beacon for investors seeking to participate in the growth of the U.S. economy. By understanding the distinction between price and total returns, appreciating the drivers of market performance, and employing disciplined investment strategies, individuals can effectively leverage the S&P 500 to pursue their financial goals with confidence and insight.
aViewFromTheCave is a participant in the Amazon Services LLC Associates Program, an affiliate advertising program designed to provide a means for sites to earn advertising fees by advertising and linking to Amazon.com. Amazon, the Amazon logo, AmazonSupply, and the AmazonSupply logo are trademarks of Amazon.com, Inc. or its affiliates. As an Amazon Associate we earn affiliate commissions from qualifying purchases.