
Tesla’s annual sales figures are far more than mere statistics; they are a direct pulse of the company’s operational prowess, market demand, and, critically, its financial trajectory. For investors, market analysts, and anyone tracking the evolving automotive and energy sectors, understanding Tesla’s delivery numbers provides profound insights into its revenue potential, profitability, and long-term valuation. Each car sold translates into revenue, contributes to economies of scale, and influences the company’s ability to fund ambitious projects, from new Gigafactories to cutting-edge AI research. This article delves into the financial implications of Tesla’s annual sales, examining how these numbers shape its position in the global economy and what they signal for its future financial health.
The Financial Pulse of Tesla’s Annual Deliveries
The sheer volume of vehicles Tesla delivers annually is a primary driver of its financial performance, influencing everything from quarterly earnings to long-term investment strategies. These figures are meticulously scrutinized, offering a transparent look into the company’s ability to scale production, meet market demand, and generate significant cash flow.
Decoding Production vs. Delivery Metrics for Investors
For financial stakeholders, distinguishing between production and delivery numbers is crucial. Production figures represent the total number of vehicles manufactured within a given period, reflecting manufacturing capacity and efficiency. Deliveries, on the other hand, indicate the number of vehicles successfully handed over to customers, directly correlating with revenue recognition. A disparity between these two figures can signal supply chain bottlenecks, logistical challenges, or demand fluctuations, all of which have direct financial implications. Investors typically focus more on deliveries as they are the direct precursor to recognized revenue. A strong and consistent conversion rate from production to delivery is a positive signal for operational excellence and efficient capital deployment. Conversely, inventory build-up due to slow deliveries can tie up capital and increase holding costs, negatively impacting profitability. Understanding this nuance allows investors to assess not just Tesla’s manufacturing capability but also its sales and distribution effectiveness, both vital for sustained financial growth.
Historical Growth Trajectories and Market Dominance
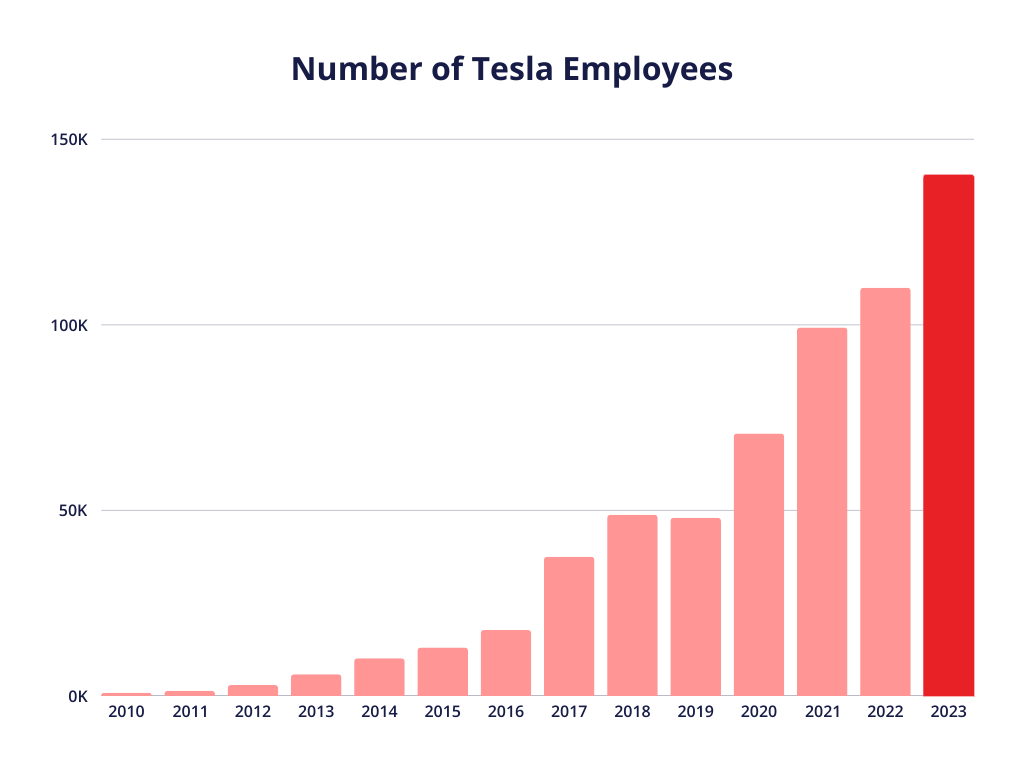
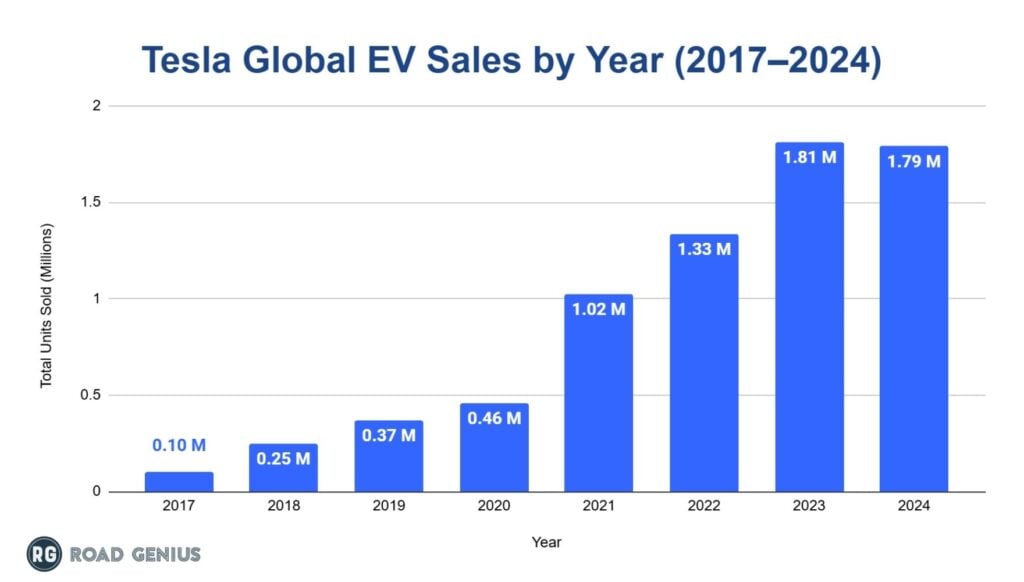
Tesla’s journey from a niche electric vehicle manufacturer to a global automotive powerhouse is mirrored in its astounding historical growth in annual deliveries. Year-over-year growth rates have frequently surpassed industry averages, a testament to its innovation, brand appeal, and the accelerating transition to electric mobility. These robust growth trajectories are fundamental to Tesla’s high valuation multiples. Investors often price in future growth, and Tesla has consistently demonstrated its ability to expand production and capture increasing market share. This dominance isn’t just about selling more cars; it’s about establishing an ecosystem of charging infrastructure, software services, and energy solutions that further entrenches its market position and creates additional revenue streams. The consistent expansion of its delivery footprint globally — from North America to Europe and Asia — underscores its successful strategy of penetrating new markets and adapting to diverse regulatory and consumer landscapes. Each new market entry and increased sales volume in existing markets contributes to the critical mass needed for economies of scale, reducing per-unit costs and boosting overall profitability.
Sales Figures: A Cornerstone of Tesla’s Valuation and Revenue
Tesla’s valuation, often a topic of intense debate, is inextricably linked to its sales performance. Unlike traditional automakers whose valuations are often tethered to current profitability, Tesla’s market capitalization heavily reflects anticipated future growth, driven primarily by projected vehicle sales.
Revenue Generation and Profitability Margins
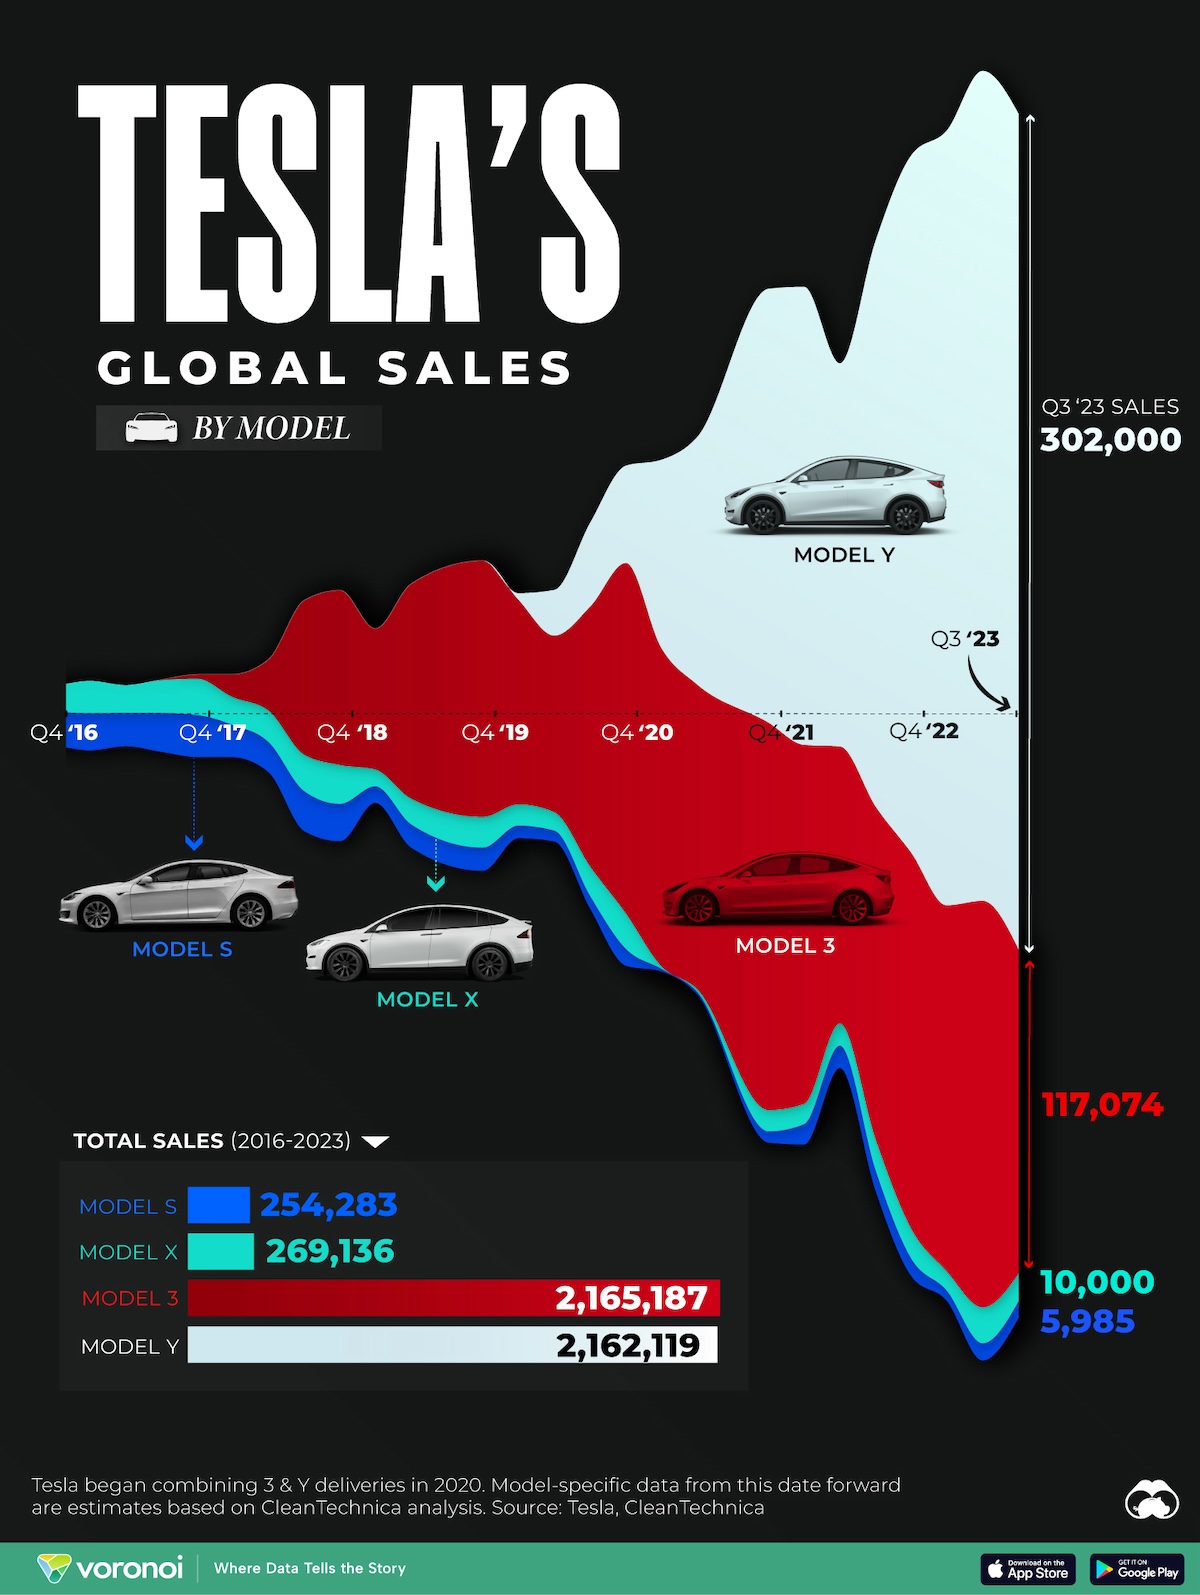
Every vehicle delivered contributes directly to Tesla’s top-line revenue. As sales volumes increase, the company benefits from economies of scale in manufacturing, procurement, and research and development, which can lead to improved gross profit margins. For a growth company like Tesla, the ability to translate increased sales into higher revenue and, eventually, greater profitability is paramount for long-term financial health. While early years saw heavy investment and lower margins, Tesla has demonstrated a consistent trend towards improving its gross and operating margins, particularly as its Gigafactories mature and production becomes more efficient. The sale of regulatory credits, though a diminishing factor, has also historically bolstered profitability. Analyzing the average selling price (ASP) per vehicle in conjunction with total sales provides further insight into revenue quality and market positioning. Higher ASPs for premium models like the Model S and X, combined with high-volume sales of Model 3 and Y, create a blended revenue stream that balances profitability with market accessibility.
Impact on Stock Performance and Investor Confidence
Tesla’s stock performance is notoriously volatile, yet consistently linked to its delivery announcements. Exceeding quarterly or annual delivery targets often sends the stock soaring, reflecting increased investor confidence in the company’s ability to execute its growth strategy. Conversely, missing targets can trigger sell-offs. This sensitivity highlights how closely financial markets tie Tesla’s valuation to its sales pipeline and production capacity. Beyond short-term reactions, consistent delivery growth over several years has been a fundamental narrative supporting Tesla’s elevated stock valuation compared to legacy automakers. Investors are essentially betting on Tesla’s ability to maintain its lead in the EV transition, expand into new areas like AI and robotics, and generate immense cash flows from its burgeoning energy and automotive divisions. Strong sales figures validate these long-term theses, attracting more institutional and retail investment, which in turn reinforces the stock’s market capitalization. The ability to consistently hit and exceed sales targets also impacts bond ratings and access to capital markets, lowering borrowing costs and providing greater financial flexibility for future expansion.
Production Scalability and Capital Expenditure
Tesla’s ambitious sales targets necessitate equally ambitious production scalability. Achieving high delivery volumes requires immense capital expenditure in manufacturing facilities and technological advancements, which has significant implications for its balance sheet and cash flow.
Gigafactory Expansion and Its Financial Commitment
The construction and operationalization of Gigafactories worldwide are central to Tesla’s sales growth strategy. Each Gigafactory—be it in Nevada, Shanghai, Berlin, or Texas—represents a multi-billion-dollar investment in land, construction, machinery, and personnel. These capital expenditures are financed through a combination of debt, equity offerings, and internally generated cash flow. For financial analysts, monitoring the efficiency of this capital deployment is critical. How quickly a new Gigafactory can ramp up production to full capacity, and at what cost, directly impacts Tesla’s return on invested capital (ROIC). Faster and more efficient ramp-ups mean quicker monetization of these massive investments, leading to improved cash flow and profitability. Delays or cost overruns, conversely, can strain financial resources and delay the realization of projected sales. The strategic placement of Gigafactories also has financial benefits, reducing logistics costs and tariff exposure, thereby improving overall gross margins on vehicles sold in those regions.
Supply Chain Resilience and Cost Management
The ability to sell millions of cars annually hinges on a robust and resilient global supply chain. Managing the procurement of vast quantities of raw materials, components (especially semiconductors), and finished goods efficiently is a constant financial challenge. Fluctuations in commodity prices, geopolitical events, and logistics disruptions can significantly impact production costs and, consequently, profitability. Tesla’s approach to vertical integration, including investments in battery production and raw material sourcing, is partly a response to these challenges, aimed at enhancing control over its supply chain and mitigating cost volatility. Effective cost management in the supply chain directly translates to healthier gross margins on each vehicle sold. Negotiating favorable terms with suppliers, optimizing inventory levels to reduce holding costs, and implementing just-in-time manufacturing principles are all critical financial levers. For investors, a resilient and cost-effective supply chain is a strong indicator of sustainable profitability and an ability to navigate macroeconomic headwinds without severely impacting sales or margins.
Market Share, Competition, and Future Financial Horizons
Tesla’s annual sales figures are not just about its own performance; they are a critical metric in the broader competitive landscape of the automotive industry, especially within the rapidly growing electric vehicle (EV) segment.
Navigating the Global EV Market Landscape
As the EV market matures, competition intensifies. Legacy automakers like Volkswagen, GM, and Ford are pouring billions into their own electric offerings, while new entrants from China (e.g., BYD, Nio) are rapidly expanding. Tesla’s continued sales growth is thus essential for maintaining and expanding its global EV market share. Losing market share, even if sales volumes are growing, can signal long-term competitive weakness and dampen investor enthusiasm. Financial analysts closely watch Tesla’s market share percentages in key regions like North America, Europe, and China, as these indicate its competitive positioning and potential for future revenue streams. Strong sales numbers in these competitive environments confirm Tesla’s product appeal and technological leadership, justifying its premium valuation. Furthermore, Tesla’s sales impact the broader energy transition by accelerating the adoption of EVs, which has long-term financial implications for the energy sector, grid infrastructure, and associated industries.
Diversification, Innovation, and Long-Term Financial Projections
Beyond vehicle sales, Tesla’s long-term financial projections are tied to its ability to diversify its revenue streams through innovation. Sales of Full Self-Driving (FSD) software, energy storage solutions (Powerwall, Megapack), and Supercharging network utilization all contribute to its financial resilience. High vehicle sales create a larger installed base for these services, generating recurring revenue that is typically higher-margin than vehicle sales. For investors, this diversification strategy provides a cushion against potential slowdowns in vehicle sales and opens up new avenues for growth. The capital generated from robust vehicle sales is often reinvested into R&D for these new technologies, creating a virtuous cycle of innovation and financial growth. Assessing Tesla’s annual sales, therefore, requires looking beyond just cars to understand how these sales underpin the expansion of its broader technological and energy ecosystem, which is crucial for its multi-trillion-dollar aspirations.
What Annual Sales Mean for Tesla’s Financial Future
Tesla’s annual sales figures are the bedrock upon which its ambitious financial future is built. They dictate the pace of its expansion, the health of its balance sheet, and its ability to deliver shareholder value.
Sustaining Growth in a Maturing EV Market
The challenge for Tesla moving forward is not just to grow sales, but to sustain high growth rates as the global EV market matures and competition intensifies. This requires continuous product innovation, competitive pricing strategies, and efficient capital allocation. From a financial perspective, sustaining growth means managing operational costs effectively, optimizing manufacturing processes, and leveraging existing assets to improve profitability per unit. As the market expands, Tesla’s ability to maintain high margins while increasing volume will be paramount. Investors will scrutinize gross margins, operating leverage, and free cash flow generation to ensure that growth is profitable and sustainable. The scale achieved through robust annual sales also provides Tesla with significant bargaining power with suppliers and enables further investment into its charging network and software capabilities, consolidating its competitive edge.
Capital Allocation and Shareholder Value
Ultimately, the financial success derived from annual vehicle sales empowers Tesla to make strategic capital allocation decisions that directly impact shareholder value. This includes reinvesting in new products and technologies (e.g., humanoid robots, AI, new vehicle platforms), expanding global manufacturing footprints, or returning capital to shareholders through share buybacks. A company with strong and consistent sales growth generating substantial free cash flow has greater flexibility to choose the most value-accretive paths. For shareholders, consistent sales growth validates the investment thesis and suggests a high likelihood of continued share price appreciation. Conversely, a slowdown in sales can trigger concerns about future profitability and growth potential, leading to a re-evaluation of the company’s intrinsic value. Thus, “how many cars Tesla sells a year” is not just a question of volume, but a fundamental metric that encapsulates the company’s operational strength, financial health, and its potential to deliver long-term value to its investors.
aViewFromTheCave is a participant in the Amazon Services LLC Associates Program, an affiliate advertising program designed to provide a means for sites to earn advertising fees by advertising and linking to Amazon.com. Amazon, the Amazon logo, AmazonSupply, and the AmazonSupply logo are trademarks of Amazon.com, Inc. or its affiliates. As an Amazon Associate we earn affiliate commissions from qualifying purchases.