The stock market is a dynamic, complex ecosystem, a barometer of economic health and investor sentiment. For individuals and institutions alike, understanding “how the stock market is doing today” is more than just a passing curiosity; it’s crucial for making informed financial decisions, managing portfolios, and gauging the broader economic landscape. Every trading day brings a fresh set of data, news, and market reactions, reflecting a multitude of global and local factors. This daily snapshot dives into the key drivers, analytical tools, and strategic considerations that help decipher the day’s market performance within the context of your financial journey.
Understanding Daily Market Movements
The stock market is not a monolithic entity, but rather a collection of indices, sectors, and individual securities, each influenced by distinct and interconnected forces. A clear understanding of what moves these markets on a daily basis is fundamental to interpreting their performance.
Key Market Indices: Dow, S&P 500, Nasdaq
When people ask “how the stock market is doing,” they are typically referring to the performance of major market indices. These indices serve as proxies for the overall health of different segments of the economy:
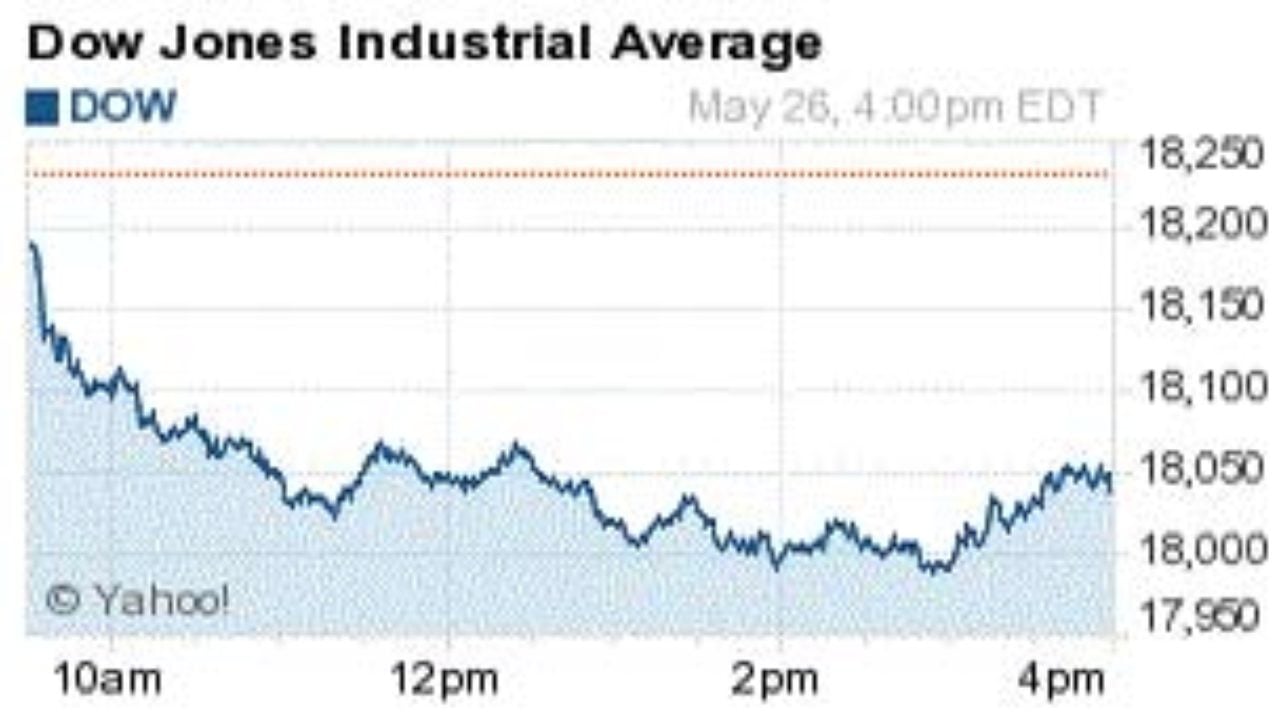
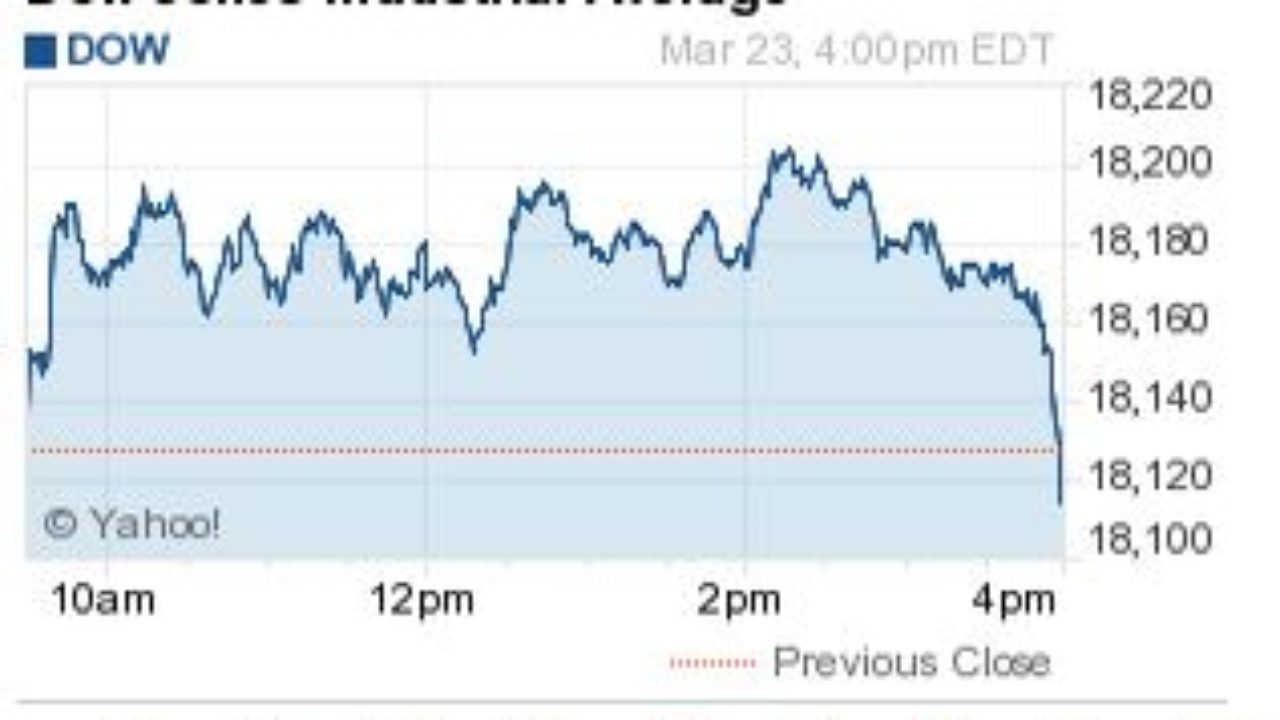
- The Dow Jones Industrial Average (DJIA): Often simply called “the Dow,” this index tracks 30 large, publicly owned companies based in the United States. It’s a price-weighted average, meaning stocks with higher prices have a greater influence, and it tends to reflect the performance of traditional industrial giants.
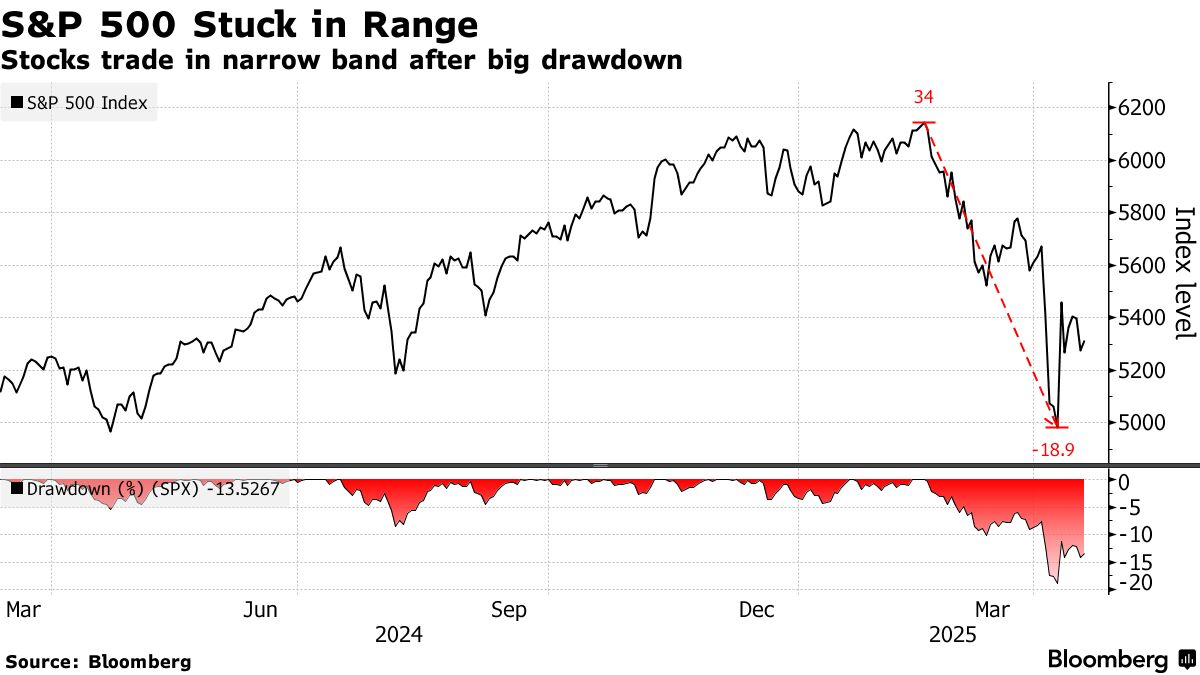
- The S&P 500: Considered a broader and more representative measure of large-cap U.S. equities, the S&P 500 tracks 500 of the largest U.S. publicly traded companies. It is market-capitalization weighted, meaning companies with larger market values have a greater impact, making it a more accurate gauge of the overall U.S. stock market’s health.
- The Nasdaq Composite: Heavily weighted towards technology and growth companies, the Nasdaq Composite includes over 3,000 stocks listed on the Nasdaq exchange. Its performance is often seen as an indicator of the tech sector’s health and investor appetite for innovation and growth.
Daily movements in these indices are driven by the collective buying and selling activity across thousands of individual stocks. A significant rise or fall in one of these indices indicates a widespread shift in investor sentiment, often reacting to new information.
The Role of Economic Indicators
Beyond specific company news, macroeconomic data provides a vital framework for understanding daily market movements. These indicators offer insights into the health and direction of the broader economy, influencing investor expectations for future corporate earnings and interest rate policies.
- Inflation Reports (CPI, PPI): Data on consumer and producer prices significantly impacts market sentiment. Higher-than-expected inflation can signal tighter monetary policy from central banks (like the Federal Reserve), potentially leading to higher interest rates, which can dampen corporate profits and make bonds more attractive than stocks.
- Employment Data (Non-Farm Payrolls, Unemployment Rate): Strong employment figures suggest a robust economy, which is generally positive for corporate earnings. However, excessively strong numbers can also raise inflation concerns. Conversely, weak job reports can signal an impending economic slowdown or recession.
- Gross Domestic Product (GDP): The broadest measure of economic activity, GDP reports provide a snapshot of economic growth. Positive GDP growth generally supports a bullish market, while contractions can trigger sell-offs.
- Consumer Confidence and Retail Sales: These indicators reflect consumer spending habits, a major component of economic activity. High confidence and robust sales typically suggest a healthy economy and strong corporate revenues.
These economic reports are often released on a scheduled basis, creating specific points of market anticipation and reaction throughout the trading day, or even week.
Corporate Earnings and News
While macroeconomic data sets the stage, individual corporate announcements often steal the spotlight on any given day. Earnings reports are particularly impactful, offering a quarterly look into a company’s financial performance.
- Earnings Per Share (EPS) and Revenue: Investors closely watch whether a company beats, meets, or misses analyst expectations for EPS and revenue. A beat can send a stock soaring, while a miss can lead to a sharp decline, often impacting related sectors or even the broader market if it’s a major company.
- Guidance: Beyond past performance, a company’s outlook (guidance) for future earnings and revenue is critical. Positive guidance can reassure investors, even if past earnings were slightly mixed, while a cautious outlook can trigger concerns.
- Mergers & Acquisitions (M&A) and Strategic Partnerships: Announcements of M&A deals can lead to significant price movements for the involved companies and sometimes for competitors. Strategic partnerships can also unlock new growth avenues and boost investor confidence.
- Product Launches and Innovation: For companies in the technology or consumer goods sectors, new product announcements or breakthroughs in innovation can significantly affect their stock price and generate sector-wide buzz.
News specific to a company or industry can create immediate volatility, highlighting the need for investors to stay informed beyond just the headline indices.
Factors Shaping Today’s Market Performance
The immediate performance of the stock market is a culmination of various forces, from the sweeping macroeconomic trends to granular geopolitical shifts, all influencing investor behavior and capital allocation. Understanding these factors provides deeper context to the daily fluctuations seen across indices and individual stocks.
Macroeconomic Influences: Inflation, Interest Rates, GDP
At the broadest level, the macroeconomy dictates the environment in which companies operate and investors make decisions.
- Inflation: Persistent high inflation erodes purchasing power and increases business costs. Central banks typically respond by raising interest rates to cool the economy. Higher inflation can lead to lower corporate profit margins, while the prospect of higher interest rates makes future earnings less valuable and competing assets (like bonds) more attractive, generally putting downward pressure on stock prices. Conversely, low and stable inflation provides a healthier backdrop for sustainable economic growth and corporate profitability.
- Interest Rates: Decisions by central banks regarding benchmark interest rates are perhaps the most significant macroeconomic lever. Higher interest rates increase borrowing costs for businesses and consumers, potentially slowing down economic activity and making it more expensive for companies to expand. They also increase the discount rate used to value future cash flows, making stocks less appealing relative to fixed-income investments. Lower rates, conversely, tend to stimulate economic activity and boost equity valuations.
- Gross Domestic Product (GDP): The rate of GDP growth directly impacts corporate revenues and profits. A strong and growing economy generally translates to higher corporate earnings and thus higher stock prices. Conversely, a slowdown or contraction in GDP signals economic weakness, often leading to market corrections as investors anticipate reduced profitability. Expectations for future GDP growth are constantly being priced into market valuations.
These macroeconomic factors are not static; they evolve with new data and policy decisions, creating a continuous feedback loop with market performance.
Geopolitical Events and Global News
Beyond the economic fundamentals, geopolitical developments and major global events can introduce significant uncertainty and volatility into financial markets.
- International Conflicts and Tensions: Wars, trade disputes, or diplomatic tensions between major powers can disrupt supply chains, impact commodity prices (especially oil), and create an environment of risk aversion. This often leads investors to seek “safe haven” assets like gold or government bonds, while pulling capital from riskier equities.
- Policy Changes and Elections: Significant policy shifts in major economies, or the outcomes of national elections, can introduce new regulations, tax structures, or trade agreements that directly affect various industries and corporate profitability. Uncertainty surrounding these events can lead to market jitters.
- Global Health Crises: As demonstrated by the COVID-19 pandemic, widespread health emergencies can severely disrupt economic activity, alter consumer behavior, and trigger rapid market downturns as investors react to unprecedented levels of uncertainty and potential long-term shifts in business models.
- Commodity Price Shocks: Dramatic fluctuations in the price of key commodities like oil, natural gas, or industrial metals can have ripple effects across numerous sectors. For example, a sharp rise in oil prices can increase transportation costs for businesses and reduce consumer discretionary spending, impacting profits.
These events, often unpredictable, introduce an element of risk that can override even strong economic fundamentals in the short term, requiring investors to monitor global headlines closely.
Sectoral Performance and Market Trends
While broad indices provide an overall view, the stock market’s daily performance is also characterized by specific sectoral movements and emerging trends. Different sectors respond differently to the same economic news or geopolitical events.
- Sector Rotation: Investors often rotate capital between sectors based on economic cycles or prevailing themes. For example, during periods of economic expansion, cyclical sectors like industrials, consumer discretionary, and financials might outperform. In contrast, during downturns or periods of uncertainty, defensive sectors like utilities, healthcare, and consumer staples might hold up better.
- Growth vs. Value Investing: The market often swings between favoring “growth” stocks (companies expected to grow earnings faster than the overall market, often in tech or innovation) and “value” stocks (companies trading below their intrinsic value, often in more mature industries). Daily market movements can reflect which of these investment styles is currently in favor.
- Emerging Themes: Specific trends, such as the rise of artificial intelligence, renewable energy, or electric vehicles, can create significant tailwinds for companies within those niches, leading to outsized gains or losses on particular days as new developments unfold.
- Industry-Specific News: Regulatory changes affecting pharmaceuticals, new product launches in consumer electronics, or commodity supply disruptions impacting basic materials can cause significant shifts within specific industries, even if the broader market is relatively stable.
Analyzing sectoral performance provides a more nuanced understanding of where capital is flowing and which areas of the economy are experiencing strength or weakness on a given day.
Interpreting Today’s Data for Tomorrow’s Decisions
Simply observing whether the market is up or down today is insufficient for making sound financial decisions. Effective investing requires deeper interpretation of the data, understanding its implications for different investor profiles, and employing robust risk management strategies.
Beyond the Headlines: Deep Diving into Market Data
The initial market headlines provide a superficial view. A truly insightful investor delves deeper into the underlying data:
- Volume Analysis: High trading volume accompanying a price movement indicates stronger conviction behind that move. Low volume might suggest a temporary fluctuation or lack of widespread consensus.
- Market Breadth: This refers to the number of advancing stocks versus declining stocks. Even if a major index is up, if most stocks are down (poor breadth), it could signal underlying weakness. Conversely, strong breadth, even with a modest index gain, can indicate broad-based strength.
- Sectoral Performance Breakdown: Identify which sectors are leading or lagging. Is the market rally concentrated in just a few large-cap tech stocks, or is it a broad-based move? This helps determine the sustainability and quality of the market’s performance.
- Volatility Indices (e.g., VIX): The CBOE Volatility Index (VIX), often called the “fear index,” measures market expectations of future volatility based on S&P 500 options. A rising VIX often indicates increasing investor anxiety, while a falling VIX suggests growing complacency. Monitoring the VIX can provide insights into potential future market swings.
- Bond Market Signals: The bond market, particularly government bond yields, can offer critical insights into investor expectations for inflation and economic growth. An inverted yield curve (short-term yields higher than long-term yields) has historically been a strong predictor of recessions.
By examining these deeper metrics, investors can gain a more comprehensive and less emotional understanding of today’s market action.
The Impact on Different Investor Profiles
Today’s market movements have varying implications depending on an individual’s investment goals, risk tolerance, and time horizon.
- Long-Term Investors: For those with a horizon of 5+ years, daily fluctuations are largely noise. Their focus should remain on fundamental company health, diversified portfolios, and dollar-cost averaging. A down day might even be seen as an opportunity to buy more shares at a lower price. An up day, while welcome, doesn’t necessarily alter their core strategy.
- Short-Term Traders: Day traders or swing traders are highly attuned to daily and intraday movements, using technical analysis and rapid execution to capitalize on small price swings. Their strategies are inherently higher risk and require constant monitoring.
- Retirees/Those Nearing Retirement: For individuals drawing income from their portfolios or nearing the distribution phase, significant market downturns can be particularly concerning. Their portfolios often lean towards more conservative assets, and their primary goal is wealth preservation. Daily movements here might prompt rebalancing or adjustments to withdrawal strategies.
- Growth vs. Value Investors: A day where technology stocks surge might be great for growth investors but irrelevant for value investors unless their specific value holdings show movement. Understanding which investment styles are driving the day’s performance helps these investors assess their relative standing.
Tailoring the interpretation of market data to one’s personal financial situation is paramount.
Risk Management in a Volatile Market
Given the inherent volatility of the stock market, especially on a daily basis, robust risk management is essential.
- Diversification: Spreading investments across different asset classes (stocks, bonds, real estate), sectors, geographies, and company sizes helps mitigate the impact of poor performance in any single area. A bad day for tech stocks might be offset by a good day for energy stocks in a diversified portfolio.
- Asset Allocation: Regularly reviewing and rebalancing one’s asset allocation ensures that the portfolio remains aligned with the investor’s risk tolerance and financial goals. If one asset class significantly outperforms, its weight in the portfolio might grow too large, requiring rebalancing to maintain the desired risk profile.
- Setting Stop-Loss Orders: For more active traders, stop-loss orders can limit potential losses on a security by automatically selling it if it drops to a predetermined price.
- Maintaining an Emergency Fund: Having readily accessible cash outside of investments provides a buffer against unexpected expenses, preventing the need to sell investments during a market downturn.
- Emotional Discipline: One of the most critical aspects of risk management is controlling emotional reactions to daily market movements. Panic selling during a dip or getting overconfident during a surge often leads to poor long-term outcomes. Stick to a well-defined investment plan.
Understanding today’s market data is not just about prediction, but about adapting and protecting one’s financial position against inherent market uncertainties.
Navigating Short-Term Fluctuations with a Long-Term Vision
While “how the stock market is doing today” is a compelling question, a truly successful investment strategy hinges on understanding that daily movements are often just noise in the context of long-term wealth creation. Embracing a long-term perspective is crucial for weathering the inevitable short-term fluctuations and achieving financial goals.
The Perils of Day Trading vs. Strategic Investing
The allure of rapid gains from daily market movements often draws individuals into day trading, a strategy focused on opening and closing positions within the same trading day. While some professional traders thrive in this high-frequency environment, for the vast majority of individual investors, day trading is fraught with peril:
- High Transaction Costs: Frequent buying and selling racks up commissions and fees, eroding potential profits.
- Emotional Toll: The constant pressure to make quick decisions in a volatile environment can lead to emotional trading, resulting in impulsive and often losing trades.
- Information Overload: Reacting to every piece of news or tick in price is overwhelming and often counterproductive.
- Tax Implications: Short-term capital gains are typically taxed at higher ordinary income rates, significantly reducing net returns.
In contrast, strategic investing (also known as long-term investing) focuses on holding quality assets for years, even decades. This approach prioritizes:
- Fundamental Analysis: Researching companies with strong business models, competitive advantages, and solid financials.
- Compounding Returns: Allowing investments to grow over time, with earnings reinvested to generate further earnings.
- Ignoring Daily Noise: Recognizing that short-term volatility is a natural part of the market and does not necessarily reflect the long-term prospects of a good company.
While monitoring daily market performance can be informative, letting it dictate short-term trading decisions often undermines long-term wealth accumulation.
Diversification as a Hedge Against Uncertainty
Diversification is the cornerstone of any prudent investment strategy, acting as a crucial defense against the unpredictability of daily market movements. It’s about not putting all your eggs in one basket.
- Across Asset Classes: Spreading investments across different asset types, such as stocks, bonds, and real estate, ensures that a downturn in one area doesn’t decimate the entire portfolio. When stocks are down, bonds might offer stability, and vice versa.
- Within Equities: Diversifying within the stock market means investing across various sectors (e.g., technology, healthcare, financials, energy), company sizes (large-cap, mid-cap, small-cap), and geographies (domestic, international). A bad day for U.S. tech stocks might be offset by positive performance in European industrials or emerging market financials.
- Benefit in Volatility: During periods of high daily volatility, diversification helps smooth out returns. While some parts of the portfolio might be down, others could be up or stable, limiting overall losses and providing a more consistent growth trajectory over the long run.
A well-diversified portfolio aims to reduce specific risks inherent in any single investment, making the day-to-day market gyrations less impactful on your overall financial health.
Rebalancing Your Portfolio
Over time, different investments in a portfolio will perform differently, causing their initial allocations to drift. Rebalancing is the process of adjusting your portfolio periodically to bring it back to your original, desired asset allocation. This strategy is vital for maintaining your risk profile and capitalizing on market movements.
- Maintaining Risk Level: If stocks have performed exceptionally well, their percentage of your portfolio might increase beyond your comfort level. Rebalancing involves selling some of the appreciated stocks and using the proceeds to buy assets that have underperformed or bonds, bringing the portfolio back to its target risk allocation.
- “Buy Low, Sell High” (Implicitly): Rebalancing often involves selling assets that have done well (and are thus “high”) and buying assets that have underperformed (and are thus “low”). This systematic approach helps an investor naturally engage in a “buy low, sell high” strategy without needing to actively predict market turns.
- Discipline and Structure: Rebalancing instills discipline by preventing emotional decision-making. It provides a structured approach to managing your investments, ensuring you don’t become overly concentrated in one area simply because it had a good run today.
- Periodic Review: Most investors rebalance annually or semi-annually, rather than reacting to daily movements. This allows for sufficient time for market trends to play out and avoids unnecessary transaction costs.
By embracing a long-term vision, understanding the value of diversification, and practicing regular rebalancing, investors can effectively navigate the daily fluctuations of the stock market and stay firmly on track toward their financial objectives.
Essential Tools and Resources for Tracking the Market
Staying informed about “how the stock market is doing today” requires access to reliable, timely information and robust analytical tools. While the goal for long-term investors isn’t to react to every tick, understanding market conditions is crucial for portfolio reviews, rebalancing decisions, and overall financial literacy.
Financial News Outlets and Data Platforms
The digital age has democratized access to financial information, making it easier than ever to track market performance.
- Major Financial News Outlets: Reputable sources like The Wall Street Journal, Bloomberg, Reuters, Financial Times, CNBC, and Yahoo Finance provide real-time news, analysis, and market commentary. These outlets offer insights into breaking news, economic reports, corporate earnings, and expert opinions that drive daily market movements.
- Dedicated Data Platforms: Platforms such as Google Finance, Yahoo Finance, Investing.com, and numerous brokerage platforms offer detailed stock quotes, historical data, charting tools, and personalized watchlists. Many provide pre-market and after-hours trading data, crucial for understanding potential opening moves.
- Central Bank and Government Agency Websites: For raw economic data, direct sources like the Federal Reserve (for monetary policy and economic reports), the Bureau of Labor Statistics (for employment and inflation data), and the Bureau of Economic Analysis (for GDP) offer primary data, often released at scheduled times, triggering market reactions.
These resources provide both the raw data and the narrative around what’s driving the market’s daily performance.
Analytical Tools and Expert Insights
Beyond just reporting data, many platforms offer tools and insights to help investors make sense of the numbers.
- Technical Analysis Tools: Charting software allows investors to analyze price patterns, volume trends, and various indicators (e.g., moving averages, RSI, MACD) to identify potential entry and exit points for trades. While more relevant for active traders, understanding these basic concepts can offer insights into market sentiment.
- Fundamental Analysis Reports: Many brokerage firms and financial websites provide in-depth research reports on individual companies, including financial statements, analyst ratings, and valuation metrics. These reports help long-term investors assess the intrinsic value of a company beyond its daily stock price.
- Economic Calendars: These calendars list upcoming economic data releases, central bank meetings, and earnings reports, allowing investors to anticipate periods of potential market volatility and prepare for significant announcements.
- Expert Commentary and Podcasts: Podcasts, webinars, and articles from reputable economists, market strategists, and investment professionals can provide valuable perspectives, helping investors understand the broader implications of daily news and market trends. It’s important to consume a variety of viewpoints to avoid bias.
Utilizing these tools helps translate raw market data into actionable insights for different investment strategies.
Staying Informed Without Being Overwhelmed
The sheer volume of financial information available today can be overwhelming. The key is to develop a disciplined approach to staying informed without falling into the trap of over-analysis or emotional reactivity.
- Curate Your Sources: Choose a few trusted news outlets and data platforms that align with your investment style and goals. Avoid constantly jumping between dozens of sources.
- Set Specific Check-In Times: For long-term investors, there’s no need to monitor the market minute-by-minute. A daily check-in (perhaps morning headlines and end-of-day summary) or even a weekly review might suffice.
- Focus on Your Portfolio: While the broader market context is important, your primary focus should always be on how market developments affect your specific investments and financial plan. Don’t let generalized fear or greed dictate your personal strategy.
- Understand the “Why”: Instead of just knowing what happened (e.g., S&P 500 up 1%), strive to understand why it happened (e.g., strong tech earnings, positive inflation report). This builds deeper financial literacy and helps in long-term decision-making.
- Avoid Chasing Headlines: Resist the urge to make impulsive decisions based on sensationalized news or short-term market spikes or drops. Remember your long-term plan and stick to it.
By judiciously using the available tools and adopting a balanced approach to information consumption, investors can effectively track the stock market’s daily performance, gaining valuable insights without succumbing to the noise and volatility that characterize the day-to-day.
aViewFromTheCave is a participant in the Amazon Services LLC Associates Program, an affiliate advertising program designed to provide a means for sites to earn advertising fees by advertising and linking to Amazon.com. Amazon, the Amazon logo, AmazonSupply, and the AmazonSupply logo are trademarks of Amazon.com, Inc. or its affiliates. As an Amazon Associate we earn affiliate commissions from qualifying purchases.