
Understanding the ebb and flow of the financial markets is a primary concern for any serious investor. When headlines scream about billions of dollars in market capitalization evaporating in a single session, the immediate reaction is often one of alarm. However, the question of “how much the market lost today” requires a nuanced perspective that goes beyond a simple number on a ticker tape. To truly grasp the significance of a daily loss, we must look at the indices involved, the underlying economic catalysts, and the broader historical context of market volatility.
The Anatomy of a Market Slide: Points versus Percentages
When the evening news reports that the Dow Jones Industrial Average fell by 500 points, it sounds catastrophic. To the uninitiated, a triple-digit drop suggests a complete financial meltdown. However, in the modern era of high-value indices, the point total is often less significant than the percentage change.
Understanding the Major Indices
To calculate how much the market lost, one must first identify which “market” is being referenced. The three primary benchmarks in the United States—the Dow Jones Industrial Average (DJIA), the S&P 500, and the Nasdaq Composite—often tell different stories.
- The Dow Jones Industrial Average: Comprising 30 “blue-chip” companies, the Dow is price-weighted. A loss here signifies a downturn in massive, established industrial and consumer brands.
- The S&P 500: Widely considered the best representation of the U.S. economy, this market-cap-weighted index tracks 500 of the largest publicly traded companies. When the S&P 500 “loses,” it reflects a broad-based decline across multiple sectors, from healthcare to energy.
- The Nasdaq Composite: Heavily weighted toward technology and growth stocks, the Nasdaq is typically more volatile. A significant loss in the Nasdaq often indicates a shift in sentiment regarding future innovation, interest rate sensitivity, or the valuation of AI and software giants.
The Nuance of Market Capitalization
A “loss” in the stock market is technically a decrease in the aggregate market capitalization of the companies within an index. If the S&P 500 drops by 2%, it represents trillions of dollars in theoretical wealth being erased. However, it is vital to remember that these are “unrealized” losses for the vast majority of investors. The money hasn’t physically disappeared from a bank vault; rather, the perceived value of the assets has adjusted downward based on the latest available data and trader sentiment.
Key Drivers Behind Today’s Market Decline
Markets do not move in a vacuum. Every red day on Wall Street is fueled by specific macroeconomic or geopolitical catalysts. Identifying these drivers is essential for determining whether today’s loss is a temporary “blip” or the start of a sustained correction.
Inflation and Federal Reserve Policy
In the current economic climate, the Federal Reserve is the primary architect of market movement. Investors closely monitor the Consumer Price Index (CPI) and other inflation metrics. If data suggests that inflation is stickier than expected, the market often reacts negatively.
The logic is straightforward: higher inflation leads to a more “hawkish” Federal Reserve. When the Fed raises interest rates or delays cutting them, the cost of borrowing increases for corporations. This eats into profit margins and makes the future cash flows of growth stocks less valuable today. Consequently, a “hot” inflation report can cause the market to lose significant ground in a matter of minutes as investors recalibrate their expectations for the cost of capital.
Corporate Earnings and Forward Guidance
While macro data sets the stage, individual company performance provides the script. During earnings season, the market can see sharp declines if “bellwether” companies—such as Apple, Microsoft, or Nvidia—report underwhelming numbers.
Often, a company may beat its current earnings estimates but see its stock price tumble because of “weak guidance.” If executives express caution about the coming quarters due to slowing consumer demand or supply chain disruptions, the market proactively prices in that future weakness today. This can lead to a contagion effect where a sell-off in one major tech stock drags down the entire index.
Geopolitical Instability and the “Flight to Safety”
Markets loathe uncertainty. Geopolitical tensions, whether they involve trade disputes, regional conflicts, or unexpected political shifts, create a risk-off environment. When global stability is threatened, institutional investors often rotate out of “risk assets” like equities and into “safe havens” like U.S. Treasuries, gold, or the U.S. dollar. This mass rotation results in a sharp daily loss for the major stock indices as sell orders outpace buy orders.

The Psychology of Loss: Navigating a Red Portfolio
Seeing a portfolio drop in value is an emotional experience. Behavioral finance teaches us that “loss aversion”—the tendency to feel the pain of a loss twice as strongly as the joy of a gain—can lead to poor decision-making during market downturns.
The Trap of Panic Selling
When the market loses significant value in a single day, the impulse to “sell before it gets worse” is powerful. However, historical data consistently shows that some of the market’s best days occur shortly after its worst days. Investors who panic sell often miss the inevitable rebound, effectively “locking in” their losses and sabotaging their long-term compounding potential.
Differentiating Between Corrections and Bear Markets
It is helpful to categorize the severity of a loss.
- Pullback: A decline of 5% to 10%. These are common and healthy parts of a bull market.
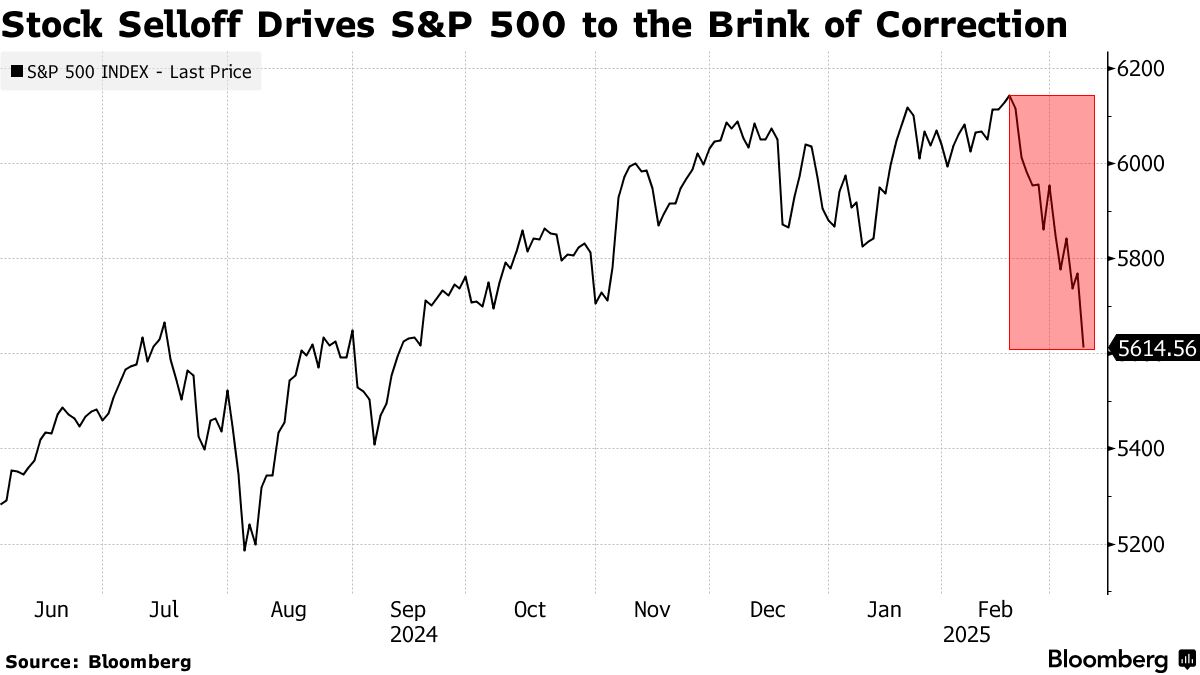
- Correction: A decline of 10% to 20%. These often occur once every one to two years and serve to “reset” overextended valuations.
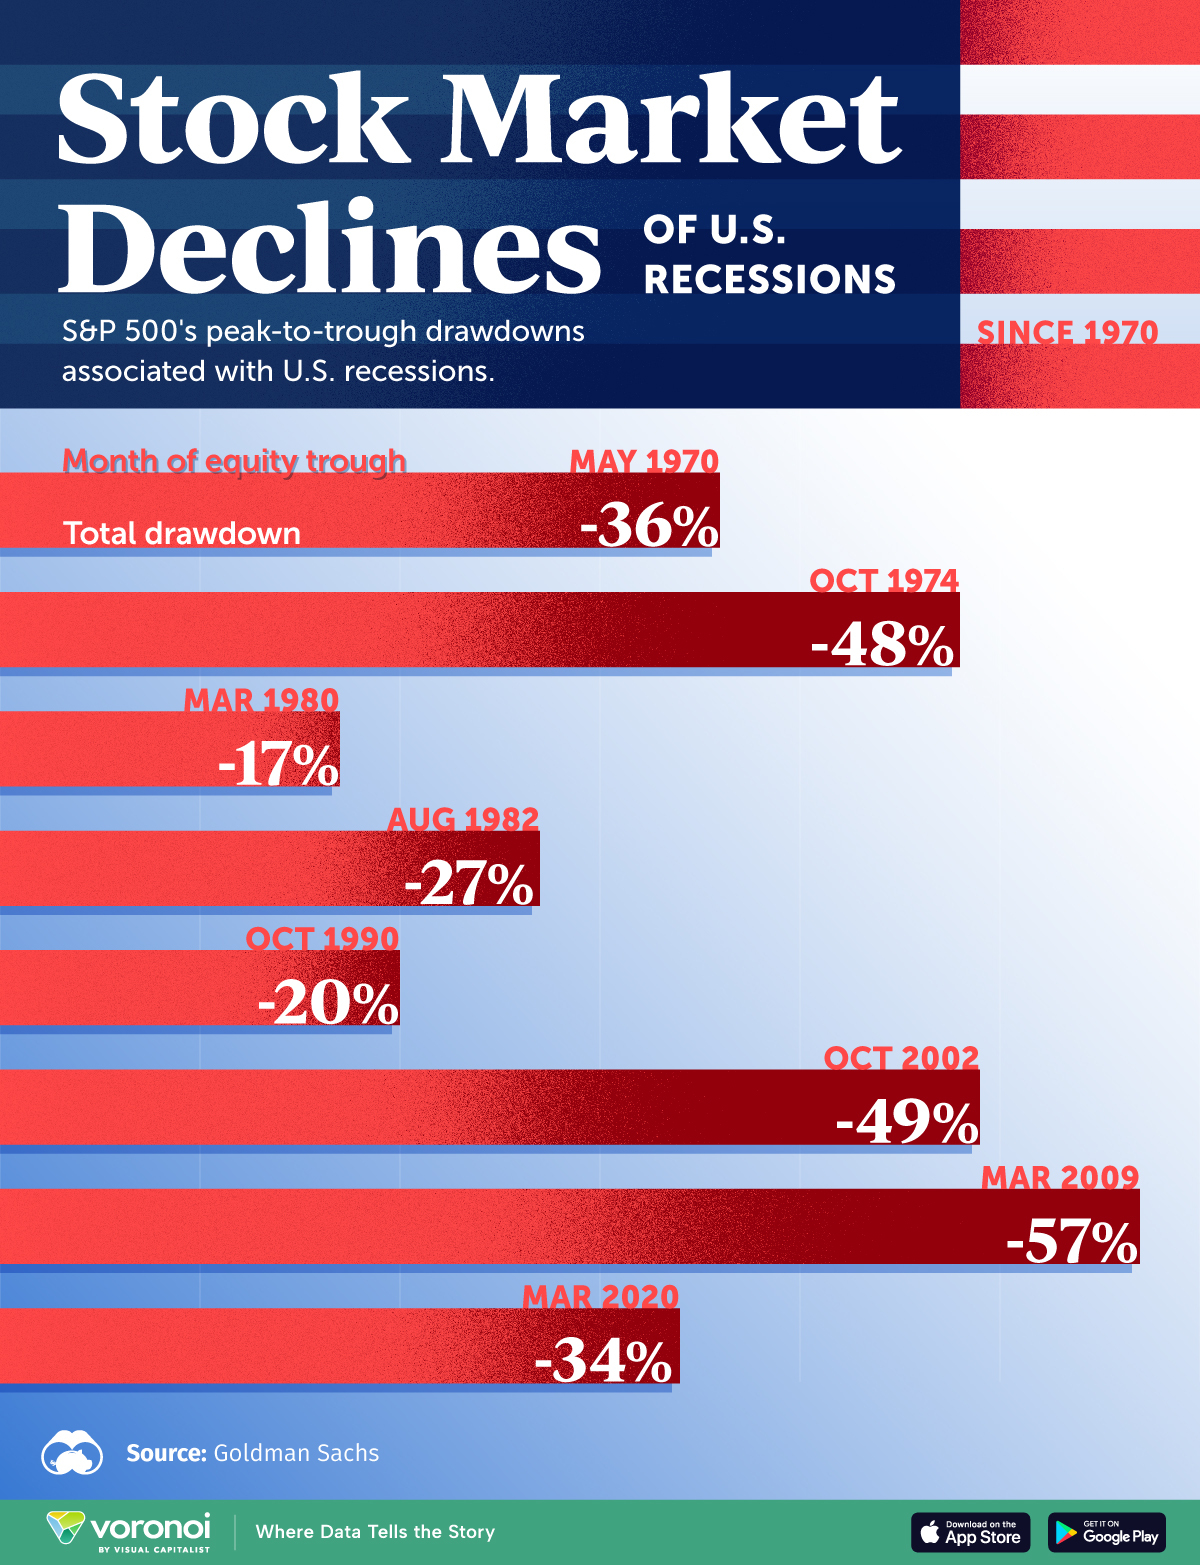
- Bear Market: A decline of 20% or more from recent highs. These are often associated with recessions and require a more defensive strategy.
By identifying which phase the market is in, an investor can maintain a professional detachment from daily fluctuations. Today’s loss, while perhaps significant in dollar terms, may simply be a routine correction within a larger upward trend.
Strategic Maneuvers During Market Downturns
For the savvy investor, a day when the stock market loses value is not just a challenge; it is an opportunity to refine a strategy and position for future growth. Professional money managers do not simply watch the screen in despair; they execute planned adjustments.
Rebalancing and the “Sale” Mentality
One of the most effective ways to handle a market loss is through systematic rebalancing. If a sharp drop in tech stocks has reduced your equity allocation below your target percentage, a down day is an opportunity to buy more shares at a “discount” to return to your desired asset allocation. This forces the investor to “buy low,” a fundamental tenet of wealth building that many find difficult to execute emotionally.
The Power of Dollar-Cost Averaging
For those contributing to 401(k)s or brokerage accounts on a fixed schedule, market losses are actually beneficial in the long run. Through dollar-cost averaging, your fixed contribution buys more shares when prices are low and fewer shares when prices are high. Over decades, this lowers the average cost per share and significantly boosts total returns. Viewing today’s market loss as an opportunity to acquire more units of a high-quality index fund can change an investor’s entire psychological outlook.
Defensive Sector Rotation
During periods of sustained market weakness, investors often look toward “defensive” sectors. These include Consumer Staples (companies that sell things people need regardless of the economy, like soap and food), Healthcare, and Utilities. These sectors tend to lose less value than high-growth tech or discretionary retail during a downturn, providing a “cushion” for a diversified portfolio.
Putting Today’s Loss in Perspective
To answer “how much the stock market lost today” is to provide a snapshot of a single moment in a journey that spans decades. The history of the stock market is a story of resilience. Despite world wars, pandemics, financial crises, and periods of staggering inflation, the long-term trajectory of the equity market has remained upward.
Every major “loss” in market history—from the 1987 crash to the 2008 financial crisis and the 2020 pandemic plunge—has eventually been surpassed by new all-time highs. The losses recorded today are the “tuition” paid for the long-term premiums that stocks offer over safer assets like cash or bonds.
A professional approach to personal finance requires looking past the daily noise. While the “how much” of today’s loss is a data point worth noting for the sake of awareness, it should rarely be the catalyst for a change in a well-constructed financial plan. Understanding why the market lost value allows an investor to remain calm, stay invested, and potentially capitalize on the volatility that frightens the less informed. Wealth is not built by timing the daily fluctuations of the market, but by spending time in the market and maintaining a disciplined strategy through both green and red days.
aViewFromTheCave is a participant in the Amazon Services LLC Associates Program, an affiliate advertising program designed to provide a means for sites to earn advertising fees by advertising and linking to Amazon.com. Amazon, the Amazon logo, AmazonSupply, and the AmazonSupply logo are trademarks of Amazon.com, Inc. or its affiliates. As an Amazon Associate we earn affiliate commissions from qualifying purchases.