When people ask, “How is the stock market doing?” they are rarely looking for a single number. Instead, they are seeking an interpretation of the complex web of economic indicators, corporate performance metrics, and psychological shifts that define the global financial landscape. Assessing the “health” of the market requires looking beyond the daily fluctuations of the green and red tickers on a screen. It involves understanding the interplay between central bank policies, inflationary pressures, and the fundamental strength of the world’s largest corporations.
In the current financial era, the answer to this question is multifaceted. While major indices may reach record highs, underlying volatility and sector-specific struggles can tell a different story. To truly understand how the stock market is doing, one must analyze the benchmarks, the macroeconomic environment, and the strategic shifts occurring within the investment community.
1. Deciphering the Major Indices: The Market’s Vital Signs
The most common way to gauge market performance is by looking at the major indices. These serve as a shorthand for the collective health of different segments of the economy. However, each index provides a different perspective, and “the market” can be doing very well in one area while struggling in another.
The S&P 500: The Standard for Modern Portfolios
The S&P 500 is widely considered the best single gauge of large-cap U.S. equities. Because it is market-capitalization-weighted, it reflects the performance of the 500 largest publicly traded companies in the United States. When the S&P 500 is trending upward, it generally indicates that corporate America is thriving and that investor confidence is high. Currently, the performance of this index is heavily influenced by a handful of mega-cap companies, meaning that the “health” of the market is often concentrated in specific high-growth sectors.
The Nasdaq Composite: The Growth and Innovation Engine
If you want to know how the “future” is doing, you look at the Nasdaq. Heavily weighted toward technology, biotechnology, and growth-oriented firms, the Nasdaq is more sensitive to interest rate changes than its counterparts. When the Nasdaq outperforms, it suggests a “risk-on” environment where investors are willing to pay a premium for future earnings. Conversely, when the Nasdaq lags, it often signals a retreat from speculative assets and a move toward safety.
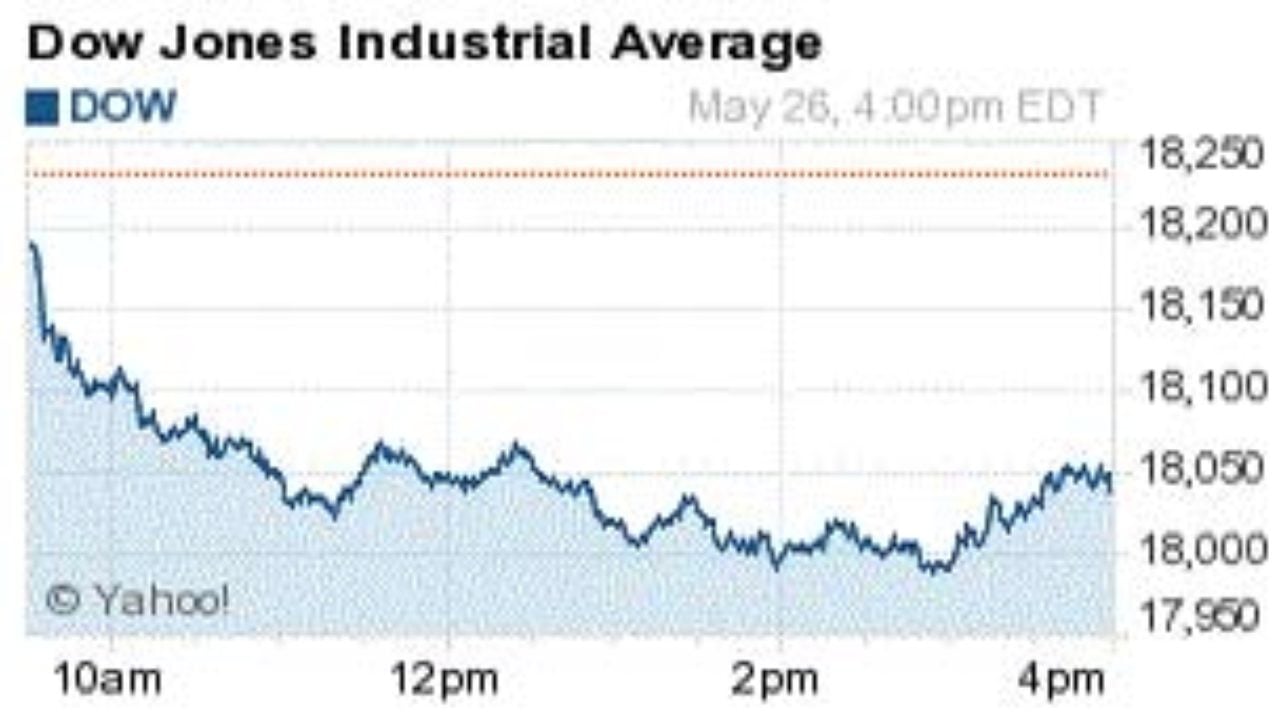
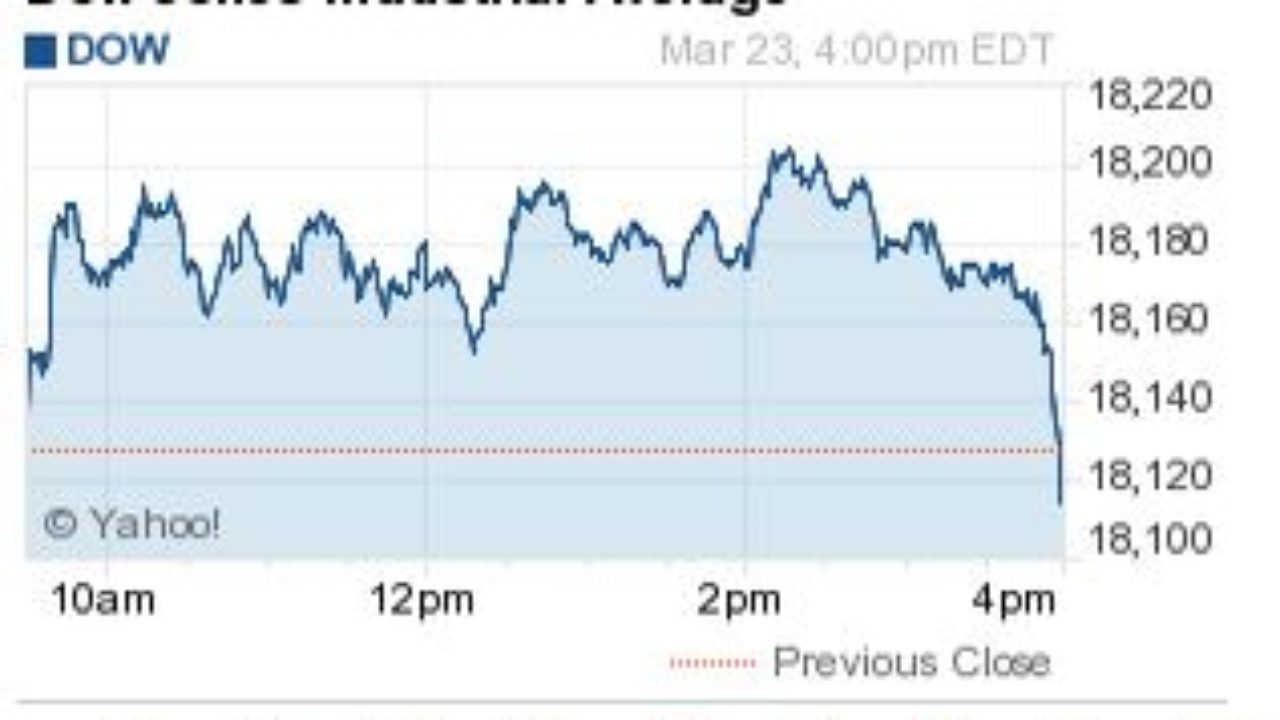
The Dow Jones Industrial Average: A Legacy Perspective
The Dow remains the most cited index in mainstream media, though many professional investors find it less representative due to its price-weighting methodology and its small sample size of only 30 companies. However, the Dow is an excellent indicator of “Blue Chip” health—the stability of massive, industrial, and consumer-staple companies that form the backbone of the traditional economy.
2. Macroeconomic Drivers: The Forces Behind the Tickers
To understand why the market is moving in a certain direction, we must look at the macroeconomic forces that dictate capital flow. The stock market does not exist in a vacuum; it is the child of the broader economy and the ward of central bank policy.
Federal Reserve Policy and Interest Rate Cycles
Perhaps no single entity influences the stock market more than the Federal Reserve. The “cost of money”—interest rates—determines how much companies pay to borrow, how much consumers spend, and what valuation multiples investors are willing to pay for stocks. When the Fed signals a “hawkish” stance (maintaining or raising rates), markets often contract as the discounted future value of earnings drops. When the Fed turns “dovish” (lowering or pausing rates), it acts as a tailwind for stock prices. Assessing the market’s health today requires a deep dive into the Fed’s dot plots and inflation targets.
Inflation Data and Consumer Spending Power
Inflation is the silent killer of market valuations. High inflation erodes corporate profit margins and reduces the purchasing power of the consumer, who drives approximately 70% of the U.S. economy. Investors closely monitor the Consumer Price Index (CPI) and Personal Consumption Expenditures (PCE) to determine if the economy is overheating or cooling too rapidly. A market doing “well” is one where inflation is moderated, allowing for steady growth without the threat of aggressive monetary tightening.
The Strength of the Labor Market
A robust stock market is typically supported by a strong labor market. Low unemployment rates suggest that consumers have the income necessary to fuel corporate profits. However, in a strange paradox of finance, an overly strong labor market can sometimes spook investors, as it may lead to wage-push inflation and further interest rate hikes. The balance between full employment and price stability is the “Goldilocks” zone that market participants are always searching for.
3. Fundamental Health: Corporate Earnings and Valuations
Beyond the macro headlines, the stock market is ultimately a collection of businesses. The long-term trajectory of the market is dictated by the ability of these businesses to generate profit.
The Importance of Earnings Seasons
Four times a year, public companies pull back the curtain on their financial health. These earnings reports are the “truth serum” of the stock market. Analysts look not just at “beats” or “misses” on the top and bottom lines, but at forward guidance. If companies are lowering their outlook for the next quarter, the market may decline even if current profits are high. To know how the market is doing, one must look at the aggregate earnings growth across sectors.
Valuation Metrics: Are Stocks Overpriced?
Even if companies are making money, the market may not be “doing well” if stocks are excessively expensive. The Price-to-Earnings (P/E) ratio is a vital tool here. If the S&P 500 is trading at a P/E significantly higher than its 10-year historical average, the market may be in a “bubble” or “overbought” territory. A healthy market is one where price appreciation is supported by actual earnings growth rather than pure speculation.
Sector Rotation: Where the Money is Flowing
A healthy market is often characterized by “breadth.” This means that gains are spread across many sectors—Financials, Healthcare, Energy, and Industrials—rather than being concentrated in just one. If only tech stocks are rising while the rest of the market falls, the market’s foundation is shaky. Monitoring sector rotation allows investors to see where the “smart money” is moving as economic conditions change.
4. Market Sentiment and Volatility: The Psychology of Investing
The stock market is a voting machine in the short term and a weighing machine in the long term. Understanding the current “mood” of the market is essential to answering how it is performing.
The VIX: Measuring the “Fear Gauge”
The CBOE Volatility Index, or VIX, measures the market’s expectation of 30-day forward volatility. A high VIX suggests panic and uncertainty, while a low VIX suggests complacency or stability. To understand the market’s current state, one must look at whether investors are hedging their bets or diving in headfirst.
The Fear & Greed Index
Sentiment indicators, such as the Fear & Greed Index, aggregate various factors like market momentum, junk bond demand, and safe-haven buying. When the market is driven by “extreme greed,” it often signals a looming correction. When “extreme fear” dominates, it can ironically be a sign that the market is bottoming out and presenting a buying opportunity.
5. Strategic Navigation: How to Respond to Market Conditions
Understanding how the market is doing is only half the battle; the other half is knowing how to manage your own capital in response to that information. Financial health is not just about the market’s performance, but about the investor’s discipline.
The Power of Dollar-Cost Averaging (DCA)
In volatile markets, trying to time the “top” or “bottom” is a fool’s errand. One of the most effective strategies in any market environment is dollar-cost averaging—investing a fixed amount of money at regular intervals regardless of the share price. This reduces the impact of volatility and ensures that you are buying more shares when prices are low and fewer when they are high.
Diversification and Risk Management
A market that is “doing well” can change in an instant. The only true defense is a diversified portfolio. By spreading investments across different asset classes—stocks, bonds, real estate, and cash—investors can protect themselves from a downturn in any single sector. How the market is doing matters much less to an investor who has a well-balanced, risk-adjusted portfolio tailored to their long-term goals.
The Long-Term Perspective
Ultimately, the stock market’s daily movements are “noise” compared to its long-term “signal.” Historically, the stock market has returned an average of about 10% annually over long periods. Whether the market is “down” this month or “up” this week, the most successful investors are those who stay the course, reinvest dividends, and focus on their personal financial milestones rather than the daily headlines.
In conclusion, determining how the stock market is doing requires a synthesis of data: from the macro-level shifts in Federal Reserve policy to the micro-level realities of corporate balance sheets. While the tickers provide the “what,” the economic and psychological contexts provide the “why.” By maintaining a professional and analytical perspective, investors can look past the noise and make informed decisions that secure their financial future.