
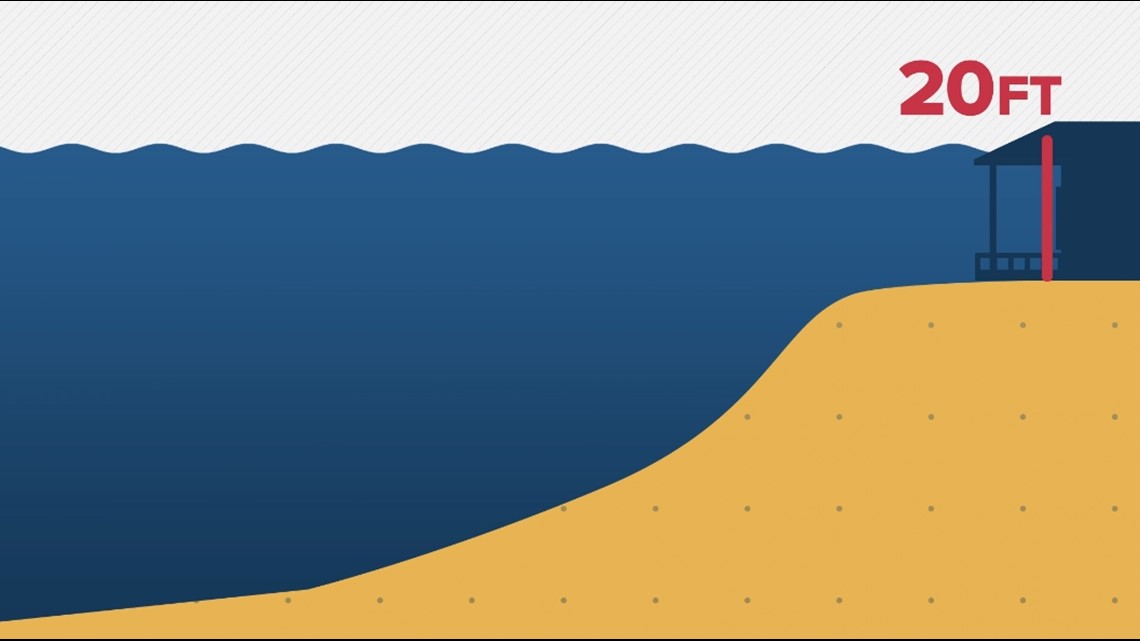
In the era of climate volatility, the term “storm surge” has moved from the lexicon of meteorologists into the daily conversations of coastal residents and urban planners. However, a “20-foot storm surge” is a figure that defies easy human visualization. To the untrained eye, it is just a number. To a technologist, it is a complex data set involving bathymetry, atmospheric pressure, and fluid dynamics.
Understanding what a 20-foot storm surge looks like is no longer a matter of waiting for the water to arrive. Today, we rely on a sophisticated stack of technologies—from LiDAR and digital twins to AI-driven hydrodynamic modeling—to render these catastrophes in high definition before they ever touch the shore. This article explores the cutting-edge tech used to visualize and predict the impact of a massive surge, transforming abstract data into actionable visual intelligence.
Digital Twins and 3D Modeling: Visualizing the Inevitable
To understand the visual impact of 20 feet of water, we must first have a perfect digital replica of the environment it will hit. This is where “Digital Twin” technology comes into play. A digital twin is a virtual representation of a physical object or system, in this case, a coastal city or a specific ecosystem.
The Role of LiDAR in Terrain Mapping
Light Detection and Ranging (LiDAR) is the foundational technology for visualizing storm surges. By pulsing laser light from aircraft or satellites, technicians can map the Earth’s surface with centimeter-level accuracy. For a 20-foot surge, every inch of elevation matters.
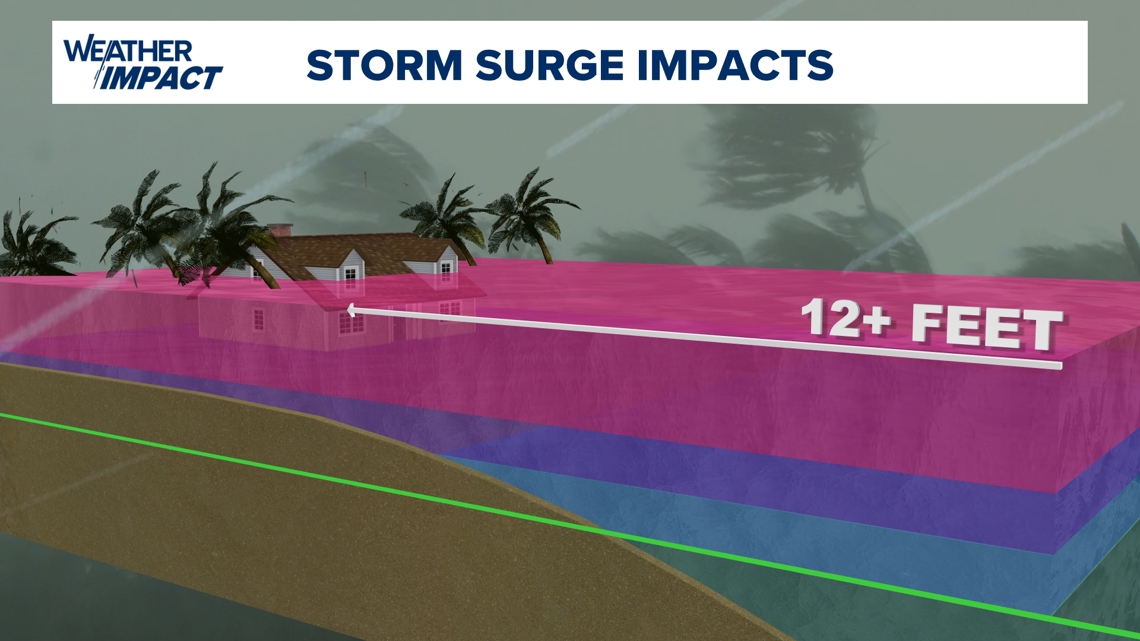
LiDAR allows us to see the “bare earth” beneath vegetation and buildings. When this data is fed into visualization software, we can see exactly where a 20-foot wall of water will meet resistance and where it will flow unimpeded. Tech firms now use these high-resolution point clouds to render 3D models of cities, allowing planners to “see” the water rise against the actual architecture of a specific neighborhood, reaching second-story windows and submerging critical electrical infrastructure.
Real-Time Hydrodynamic Simulation
Static 3D models are only the beginning. To visualize the movement of a surge, engineers use hydrodynamic simulation software such as MIKE 21 or Delft3D. These tools simulate how water interacts with complex urban geometries.
A 20-foot surge isn’t just a rising tide; it is a violent, churning force. Modern simulation tech accounts for “friction factors”—how a paved parking lot versus a mangrove forest slows down or accelerates the water. By applying these algorithms, tech experts can generate photorealistic animations showing how a 20-foot surge doesn’t just sit; it flows, creates eddies, and exerts thousands of pounds of pressure per square foot against glass and steel.
The Evolution of Forecasting: From 2D Maps to AI Realism
Historically, visualizing a storm surge meant looking at a “spaghetti plot” or a flat, color-coded map. While useful for experts, these visuals failed to convey the sheer scale of the threat to the public. The tech industry has responded by moving toward AI-integrated predictive modeling.
Machine Learning and Predictive Analytics
The National Oceanic and Atmospheric Administration (NOAA) and private tech firms are increasingly using machine learning (ML) to improve the speed and accuracy of surge visualizations. Traditional models, like SLOSH (Sea, Lake, and Overland Surges from Hurricanes), are being augmented by AI that can process thousands of storm scenarios in seconds.
By training models on decades of historical surge data and real-time atmospheric conditions, AI can predict the “look” of a surge with unprecedented granularity. Instead of a general warning for a county, AI-driven platforms can provide a street-level visualization. This tech allows for the creation of “probability heat maps” that show not just where the water will go, but the velocity and debris-carrying potential of a 20-foot surge.
Integrating Satellite Data with Ground-Level IoT
The visualization of a storm surge is also being transformed by the Internet of Things (IoT). Thousands of water-level sensors and pressure transducers are now deployed along coastlines. These sensors feed real-time data into the cloud, which is then overlaid onto satellite imagery.
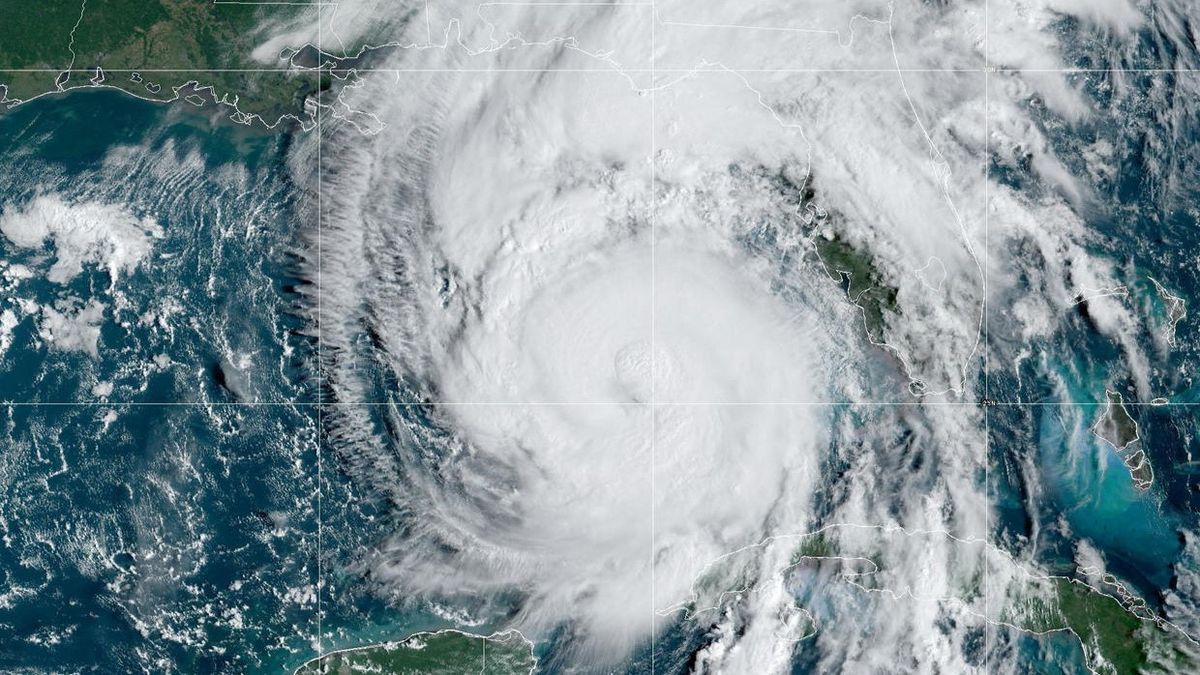
Synthetic Aperture Radar (SAR) satellites are particularly crucial here. Unlike optical satellites, SAR can see through the thickest hurricane clouds and even at night. This allows tech platforms to generate real-time visualizations of the surge as it is happening, providing a “live look” at the 20-foot water line that was previously impossible due to weather conditions.
Virtual Reality (VR) as a Tool for Public Awareness and Policy
One of the greatest challenges in disaster management is the “optimism bias”—the belief that “it won’t be that bad.” Technology is bridging this psychological gap through immersive experiences. If a person can see what a 20-foot storm surge looks like from their own front porch using a VR headset, their willingness to evacuate increases significantly.
Immersive Crisis Training
Tech companies are developing VR modules for emergency responders that simulate the visual environment of a 20-foot surge. In these simulations, the water is murky, filled with “procedural debris” (digital objects like cars and trees that move realistically in the current), and accompanied by high-fidelity spatial audio.
This level of immersion allows responders to visualize the “visual occlusion” caused by a surge. At 20 feet, familiar landmarks disappear. Street signs are underwater, and navigation becomes a matter of memory and GPS. By training in these hyper-realistic digital environments, teams can better prepare for the visual disorientation of a real-world event.
Designing Resilient Smart Cities
For urban architects, visualization tech is a design tool. Using “Generative Design” software, architects can input the data of a 20-foot surge and allow the AI to suggest structural modifications.
Visualizing the surge allows for the placement of “soft infrastructure”—parks that act as basins or buildings with “blow-out” first floors. By seeing the water move through a 3D-rendered streetscape, designers can identify “bottleneck points” where the surge would be most destructive and iterate their designs in a virtual space before a single brick is laid.
The Hardware Behind the Data: Supercomputers and the Cloud
Visualizing a 20-foot storm surge requires an immense amount of computational power. Rendering the physics of trillions of gallons of water interacting with a million individual urban objects is a task for supercomputers.
Processing Petabytes of Meteorological Data
The visualization of a surge starts in the high-performance computing (HPC) centers of organizations like the European Centre for Medium-Range Weather Forecasts (ECMWF). These machines process petabytes of data—temperature, salinity, wind speed, and seafloor topography—to calculate the surge height.
The “look” of the surge is ultimately a graphical representation of these calculations. Without the massive parallel processing power of modern GPUs (Graphics Processing Units), the visualizations would be too slow to be useful during an active storm. Cloud computing has democratized this, allowing local governments to tap into supercomputing power on-demand to run their own localized surge visualizations.
Edge Computing in Early Warning Systems
While the “big data” is handled in the cloud, “Edge Computing” is used to visualize the surge at the local level. Modern tide gauges and cameras are equipped with enough processing power to analyze visual data locally.
If a camera “sees” water rising at a rate consistent with a 20-foot surge, edge AI can immediately trigger localized alerts and generate a simplified visual representation of the projected flood path for residents’ smartphones. This reduces latency—the time between data collection and the visual warning—which is critical when a wall of water is moving toward a coastline at 30 miles per hour.
Conclusion: The Future of Visualizing the Invisible
A 20-foot storm surge is a terrifying natural phenomenon, but through the lens of technology, it becomes a problem that can be mapped, modeled, and mitigated. We have moved past the era of simple estimations. Today, through the convergence of LiDAR, AI, Digital Twins, and VR, we can visualize the catastrophic impact of these events with startling clarity.
As these technologies continue to evolve, our ability to “see” the future will only improve. The goal of this tech stack is not just to create impressive visuals, but to provide the spatial intelligence necessary to save lives and build more resilient cities. When we ask, “What does a 20-foot storm surge look like?” we are no longer guessing; we are looking at a high-resolution, data-driven window into a reality we are now better equipped to survive.
aViewFromTheCave is a participant in the Amazon Services LLC Associates Program, an affiliate advertising program designed to provide a means for sites to earn advertising fees by advertising and linking to Amazon.com. Amazon, the Amazon logo, AmazonSupply, and the AmazonSupply logo are trademarks of Amazon.com, Inc. or its affiliates. As an Amazon Associate we earn affiliate commissions from qualifying purchases.