
In the era of the quantified self, the pulse point on your wrist has transitioned from a simple biological marker to a sophisticated data stream. For years, the question of “what is considered a good resting heart rate” was answered in the sterile environment of a doctor’s office with a manual pulse check. Today, that answer is being redefined by wearable technology, high-frequency biosensors, and machine learning algorithms.
As we move deeper into the integration of health and technology, understanding your resting heart rate (RHR) is no longer just about a single number; it is about understanding the baseline of your internal operating system. This article explores the technical nuances of RHR, the hardware that tracks it, and how software ecosystems interpret these metrics to provide actionable health insights.
The Evolution of Biometric Monitoring: From Stethoscopes to Smart Sensors
The methodology for measuring heart rate has undergone a digital revolution. In the past, a “good” resting heart rate was measured once every few months during a physical exam. This “snapshot” approach was prone to errors like “white coat syndrome,” where a patient’s heart rate spikes due to the stress of being in a medical environment.
Photoplethysmography (PPG) Technology
Modern wearables—ranging from the Apple Watch and Garmin Fenix to the Oura Ring—utilize Photoplethysmography (PPG) to monitor heart rate. This technology works by shining a green LED light onto the skin. Because blood is red, it reflects red light and absorbs green light. When your heart beats, the blood flow in your wrist—and the green light absorption—is greater. Between beats, it is less. By flashing its LED lights hundreds of times per second, the device can calculate the number of times the heart beats per minute.
The Shift to Continuous Data Streams
The technological advantage of modern wearables is the ability to provide “longitudinal data.” Instead of a single point in time, tech platforms now track your RHR while you sleep, when you wake up, and throughout your daily sedentary periods. This creates a much more accurate baseline. For the software to identify a “good” heart rate, it first establishes your personal “normal” through days or weeks of continuous background monitoring, filtering out noise from movement or stress.
Understanding Your Data: What the Algorithms Consider a “Good” Resting Heart Rate
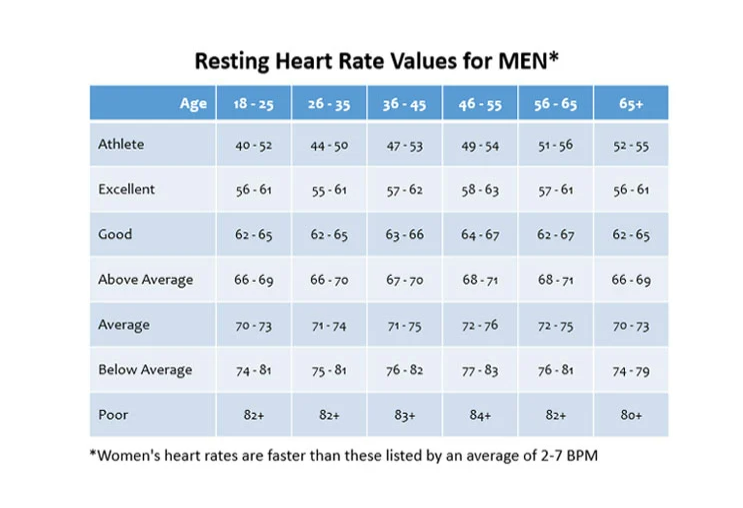
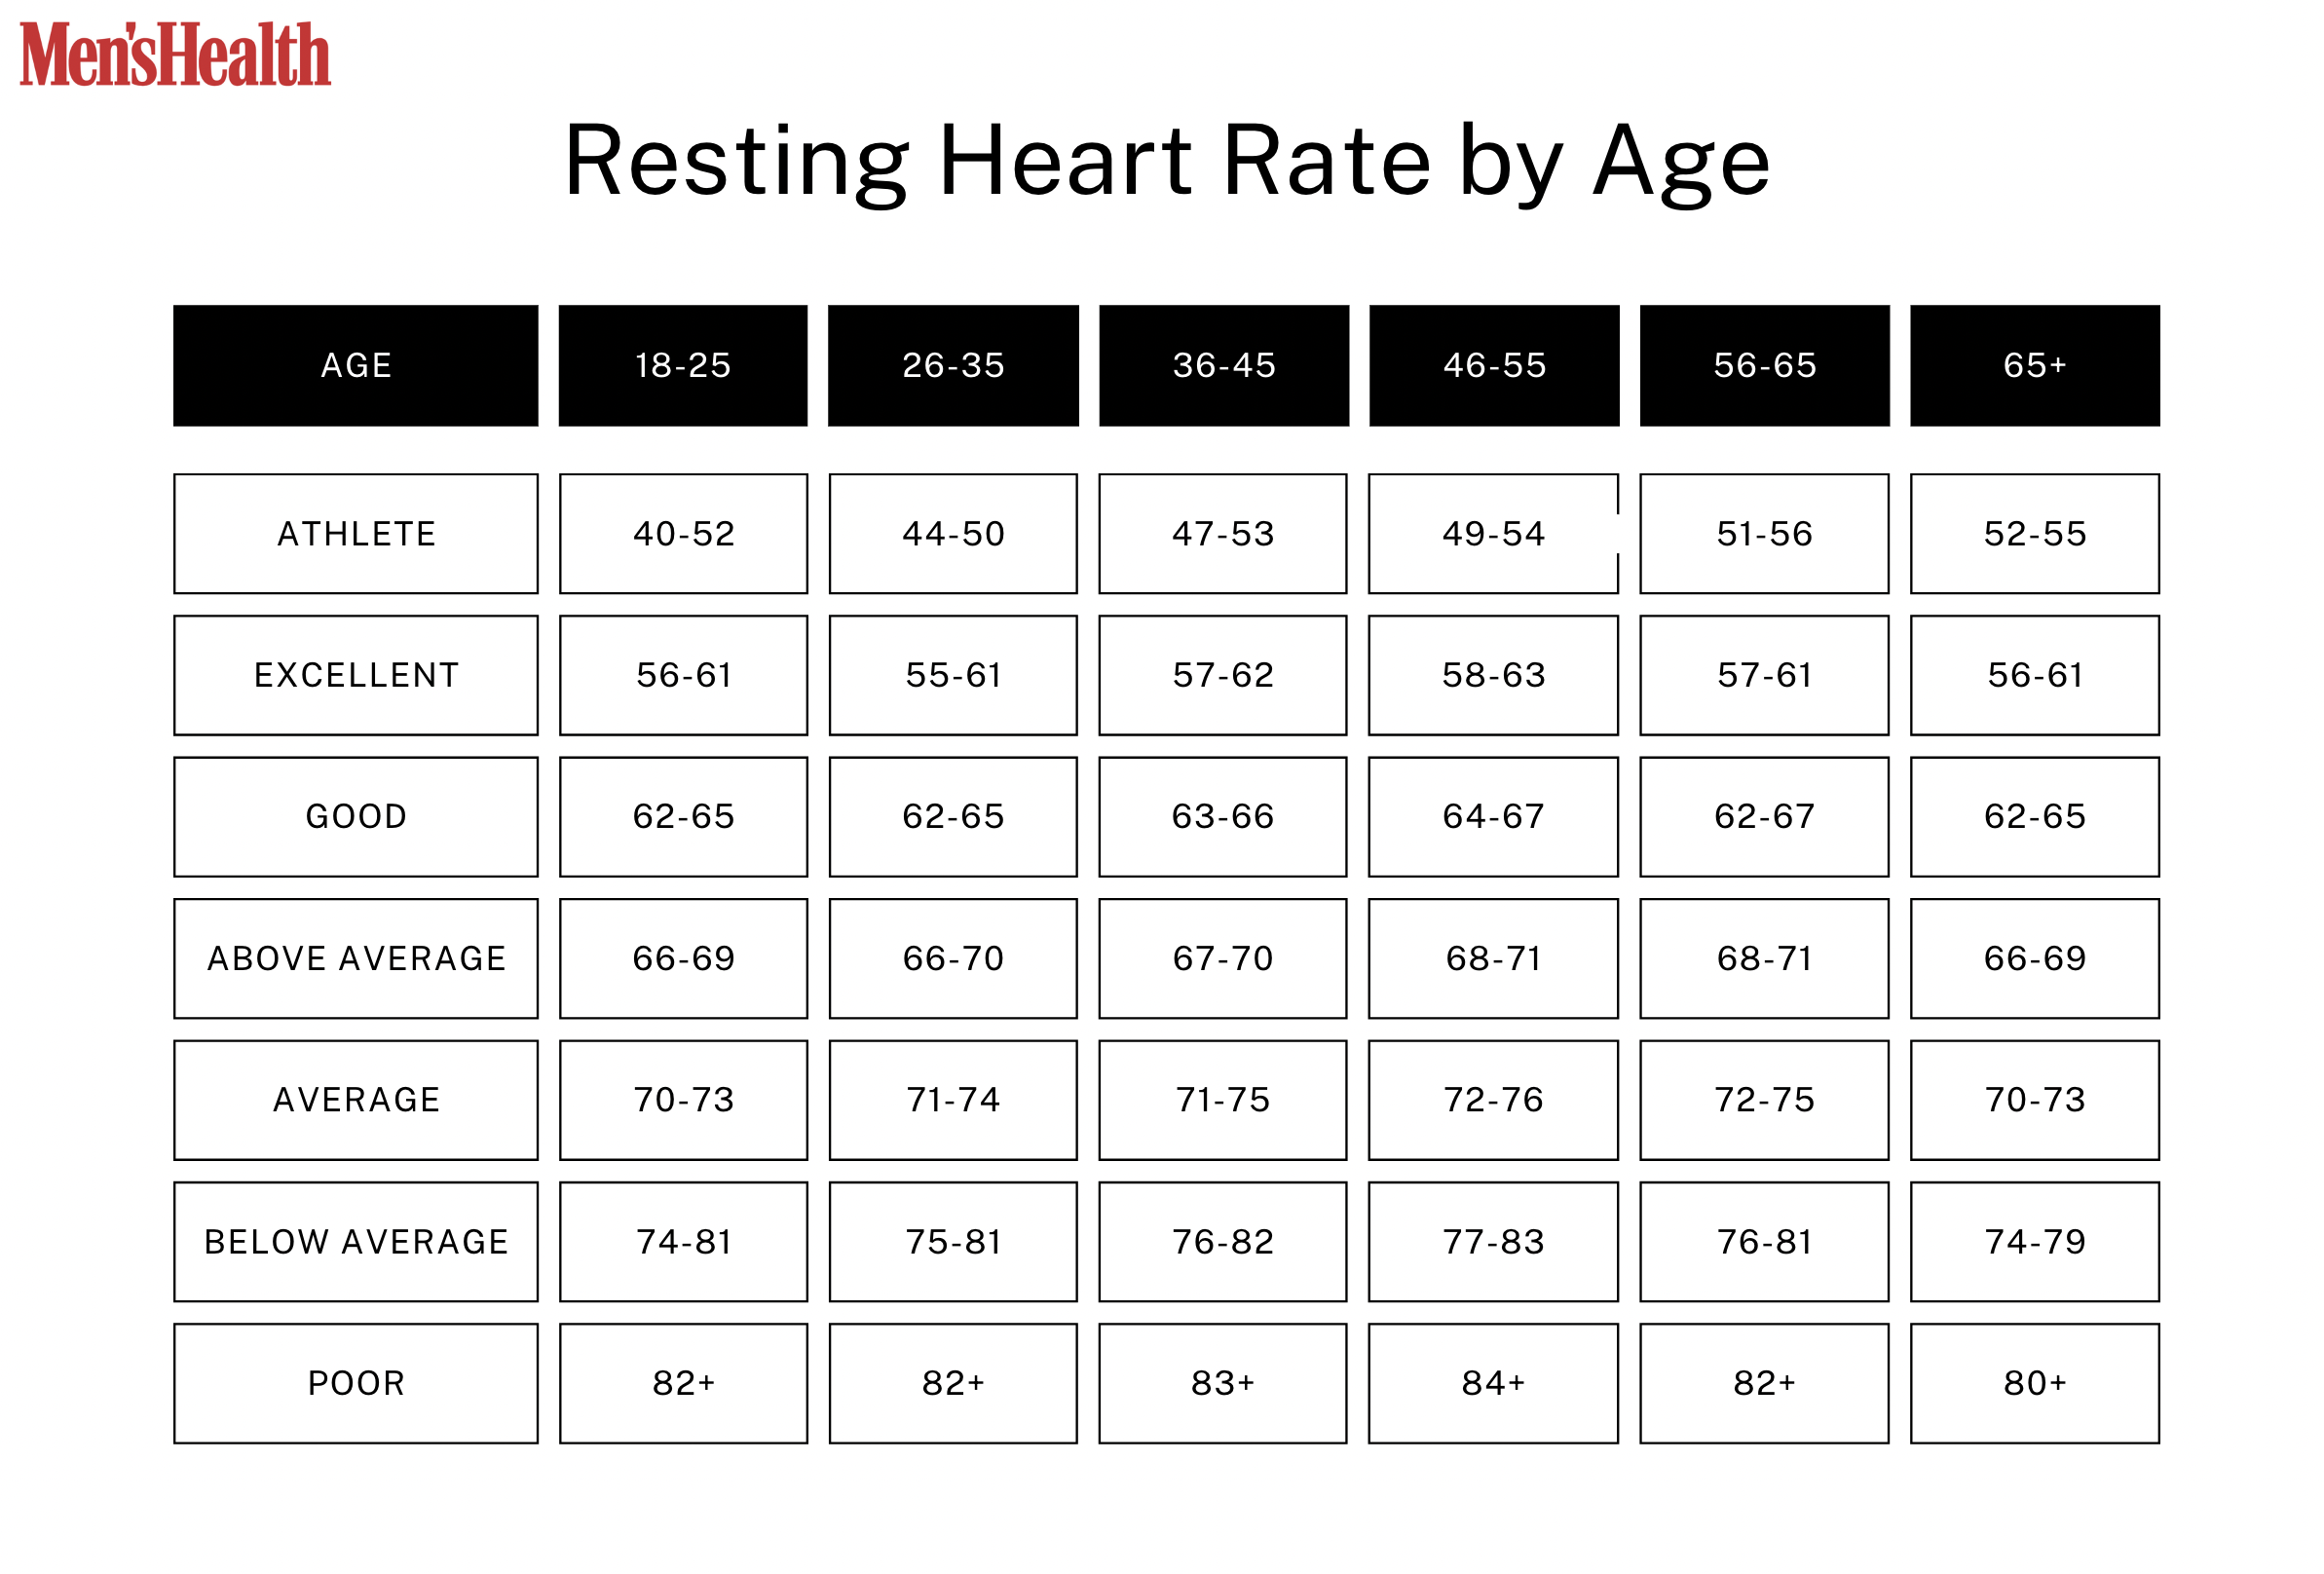
From a technical perspective, most health apps categorize RHR based on a blend of traditional medical benchmarks and comparative user data. While the standard clinical range for an adult is 60 to 100 beats per minute (BPM), tech platforms often highlight that a lower RHR is typically an indicator of higher cardiovascular efficiency and better “battery” health for the human body.
The Standard Benchmarks vs. The Tech Curve
According to the algorithms used by platforms like Fitbit and WHOOP, a “good” resting heart rate for a healthy adult usually falls between 50 and 70 BPM.
- 60–100 BPM: Labeled as “Normal” or “Average” in most UI dashboards.
- 40–60 BPM: Often flagged as “Athletic” or “Excellent.” In highly trained individuals, the heart muscle is so efficient that it can pump a higher volume of blood with fewer contractions.
- Above 100 BPM (Tachycardia): Triggering an automated alert on most smartwatches, this indicates potential stress, dehydration, or an underlying medical condition.
How AI Personalizes Your “Normal”
One of the most significant breakthroughs in health tech is the move away from static ranges toward personalized baselines. AI-driven platforms don’t just compare you to the general population; they compare you to yourself. If your tech detects that your RHR is consistently 52 BPM, but it suddenly jumps to 62 BPM for three consecutive days, the software will flag this as a “deviation” rather than “normal,” even though 62 is technically within the healthy range. This predictive analysis can often signal the onset of illness or overtraining before physical symptoms appear.
Factors Influencing Tech-Derived Biometrics
When assessing if your RHR is “good,” the technology must account for various environmental and biological variables. The raw data captured by the sensor is often “noisy,” requiring sophisticated software processing to clean the signal.
Sleep Tracking and Nocturnal Heart Rate
The most accurate “resting” heart rate is recorded during sleep, specifically during the period of lowest activity before waking. Wearable tech uses accelerometers to confirm the body is in a state of deep rest before logging the RHR. A “good” nocturnal RHR is a key metric for recovery. Tech users will often see their RHR rise after a night of poor sleep or alcohol consumption—the sensors pick up the heart’s increased workload to process toxins or manage sleep deprivation, proving that the “goodness” of your heart rate is a dynamic, daily-changing metric.
The Impact of Device Fit and Calibration
From a technical standpoint, the hardware’s placement is critical. “Signal crossover” occurs when the sensor picks up the cadence of a movement (like walking or arm swinging) instead of the actual pulse. To ensure you are getting a reading that truly reflects a “good” RHR, the device must be snug against the skin. High-end gadgets now include “skin contact sensors” to alert the user if the data quality is low due to poor placement, ensuring the integrity of the health database.
The Future of Preventive Health: AI, Big Data, and Heart Rate Variability (HRV)
As we look toward the future of health technology, the focus is shifting from a simple BPM count to more complex metrics like Heart Rate Variability (HRV). While RHR tells us how many times the heart beats per minute, HRV measures the variation in time between each heartbeat.
Moving Beyond RHR to HRV
A “good” RHR is often paired with a high HRV. In the tech world, high HRV indicates a nervous system that is responsive and resilient. Modern apps aggregate these two metrics to create a “Readiness Score” or “Body Battery.” This is a master-class in data visualization, taking complex physiological signals and turning them into a simple 1-100 score that tells the user if they are prepared for a high-intensity day or if they should focus on recovery.
Predictive Analytics for Early Illness Detection
The true power of tracking RHR lies in big data. Companies like Apple and Oura are currently involved in massive longitudinal studies to see if changes in RHR can predict conditions like COVID-19, flu, or even cardiac arrhythmias like Atrial Fibrillation (AFib). By analyzing millions of heartbeats across their user base, these companies are building neural networks that can identify “abnormal” patterns that a human doctor might miss. A “good” heart rate in 2024 is increasingly defined as one that stays within the bounds of a machine-learned “stability zone.”

Conclusion: The Democratization of Health Data
In conclusion, what is considered a good resting heart rate is no longer a static number on a chart; it is a live, tech-enabled insight into your overall well-being. Technology has democratized access to this data, moving it from the cardiologist’s office to the consumer’s wrist.
While a range of 50 to 70 BPM is generally considered “good” by most technological standards, the real value lies in the trends and deviations captured by your device. By leveraging PPG sensors, AI personalization, and advanced metrics like HRV, we are now able to monitor our cardiovascular health with unprecedented precision. As wearable tech continues to evolve, the definition of a “good” heart rate will become even more personalized, allowing users to optimize their performance, improve their longevity, and take proactive control of their digital health journey.
aViewFromTheCave is a participant in the Amazon Services LLC Associates Program, an affiliate advertising program designed to provide a means for sites to earn advertising fees by advertising and linking to Amazon.com. Amazon, the Amazon logo, AmazonSupply, and the AmazonSupply logo are trademarks of Amazon.com, Inc. or its affiliates. As an Amazon Associate we earn affiliate commissions from qualifying purchases.