
The NASDAQ Composite is more than just a ticker symbol flashing across a television screen or a mobile app; it is the heartbeat of the modern global economy. Representing over 3,000 companies, this index is the primary barometer for the technology sector and growth-oriented industries. When investors ask, “What did the NASDAQ do today?” they are rarely looking for a simple numerical value. Instead, they are seeking an understanding of market sentiment, the health of the innovation economy, and the trajectory of their personal wealth. Understanding the nuances of the NASDAQ’s daily movement requires a blend of fundamental analysis, psychological insight, and a grasp of broader macroeconomic trends.

Understanding the NASDAQ Composite and Its Daily Significance
To interpret what the NASDAQ did on any given day, one must first understand what the index actually represents. Unlike the Dow Jones Industrial Average, which is price-weighted and contains only 30 blue-chip companies, the NASDAQ Composite is a market-capitalization-weighted index. This means that the largest companies—often referred to as “Big Tech”—have a disproportionate influence on the index’s daily performance.
The Composition of the Index
The NASDAQ Composite includes almost all stocks listed on the Nasdaq Stock Market. While it is heavily weighted toward technology, it also includes significant representation from the consumer discretionary, healthcare, and biotechnology sectors. Because the index is market-cap weighted, movements in trillion-dollar giants like Apple, Microsoft, Alphabet, and NVIDIA can move the entire index, even if the majority of smaller stocks are trading in the opposite direction. For a personal finance enthusiast, monitoring the NASDAQ provides a clear view of how the “growth” portion of a portfolio is performing.
Why the NASDAQ is the Barometer for Innovation
The NASDAQ is colloquially known as the “tech-heavy” index. It serves as the primary home for companies that prioritize research, development, and disruptive technologies. When the NASDAQ rises, it often indicates a “risk-on” environment where investors are willing to pay a premium for future earnings potential. Conversely, a sharp decline in the NASDAQ often signals a flight to safety or a reassessment of the valuation of high-growth companies. Daily fluctuations here tell a story about the collective confidence in the future of AI, renewable energy, and digital infrastructure.
Key Factors Influencing Daily Price Action
The daily movement of the NASDAQ is rarely random. It is the result of millions of trades reacting to specific catalysts. Identifying these catalysts is essential for any investor looking to move beyond surface-level observations and into deep financial literacy.
The Impact of Monetary Policy and Interest Rates
Perhaps the most significant driver of the NASDAQ’s daily performance in the current era is the Federal Reserve’s monetary policy. Growth stocks, which dominate the NASDAQ, are particularly sensitive to interest rates. This is because their valuations are often based on the “discounted cash flow” model—calculating the present value of future profits. When interest rates rise, the “discount rate” increases, making those future profits less valuable today. If the Fed signals a hawkish stance (raising rates), the NASDAQ often reacts with a sell-off. If they signal a dovish stance (cutting or pausing rates), the index often rallies as the cost of capital decreases.
Corporate Earnings and Big Tech Influence
During “earnings season,” the NASDAQ’s daily performance is dictated by the quarterly reports of its largest components. Because the index is top-heavy, a stellar earnings report from a company like Amazon or Meta can single-handedly lift the index into positive territory. Investors look beyond just the “beat” or “miss” of revenue numbers; they focus on forward-looking guidance. If a tech giant warns of slowing cloud spending or increased capital expenditures for AI, the NASDAQ may experience a volatile “gap down” at the market open, regardless of how the broader economy is doing.
Macroeconomic Indicators and Market Sentiment
Daily volatility is often sparked by the release of key economic data, such as the Consumer Price Index (CPI), which measures inflation, or the Non-Farm Payrolls (NFP) report, which indicates the health of the labor market. High inflation typically hurts the NASDAQ because it increases the likelihood of higher interest rates. Additionally, “market sentiment”—the collective mood of investors—can cause the index to swing based on geopolitical news, shifts in the “fear gauge” (VIX), or even viral social media trends. Understanding these macro levers allows an investor to see the “why” behind the “what.”
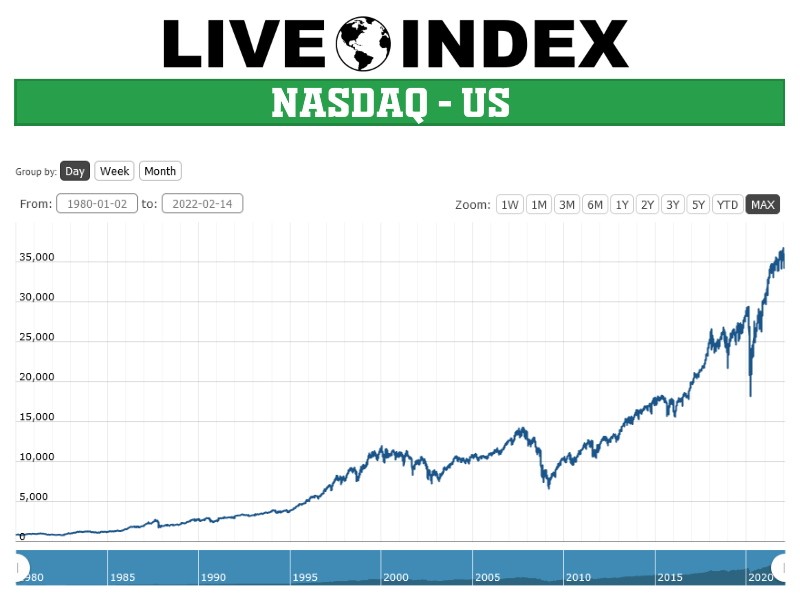
Analyzing Today’s Movement: Technical vs. Fundamental Perspectives
When assessing what the NASDAQ did today, professional analysts look through two distinct lenses: the fundamental (the “why”) and the technical (the “how”). Both are vital for a comprehensive understanding of business finance.
Common Technical Indicators to Watch
Technical analysis involves looking at price charts to identify patterns and trends. If the NASDAQ experienced a significant move today, analysts will look at the “volume”—the number of shares traded. A price increase on high volume suggests strong conviction among buyers. They also look at “Moving Averages” (like the 50-day or 200-day average) to see if the index is breaking out of a long-term trend or bouncing off a support level. If the NASDAQ “closed at its highs,” it suggests bullish momentum that might carry into the next day. If it “failed at resistance,” it suggests that sellers are still in control of the narrative.
Fundamental Shifts and Volatility Drivers
From a fundamental perspective, a daily move is analyzed based on intrinsic value and external shocks. For instance, if the NASDAQ dropped 2% today, a fundamental analyst would ask: Did a major semiconductor company lose a key contract? Was there a change in government regulation regarding data privacy? Or did a competitor launch a product that threatens the dominance of a market leader? This type of analysis helps investors distinguish between “noise” (temporary volatility) and “signal” (a permanent shift in the business landscape).
The Broader Economic Context: How Daily Changes Affect Long-Term Investing
While the daily “play-by-profit” of the NASDAQ is exciting, its true value for the personal finance practitioner lies in how these daily snapshots contribute to long-term wealth building. It is easy to get caught up in the drama of a single trading day, but the most successful investors use daily data to inform a long-term strategy.
Dollar-Cost Averaging vs. Market Timing
For the average person managing a retirement account or a side-hustle portfolio, the NASDAQ’s daily fluctuations offer a lesson in discipline. Trying to “time the market” based on what the NASDAQ did today is notoriously difficult. Instead, many financial advisors recommend dollar-cost averaging (DCA)—investing a fixed amount of money at regular intervals regardless of the index’s daily price. When the NASDAQ is down, your fixed investment buys more shares; when it is up, it buys fewer. Over time, this strategy mitigates the risk of a single “bad day” and leverages the historical upward trajectory of the NASDAQ.
Diversification Strategies in a Tech-Heavy Environment
Because the NASDAQ is so concentrated in the technology sector, a big “red day” on the index can be devastating for a portfolio that isn’t properly diversified. Professional financial planning involves balancing NASDAQ-based growth stocks with “value” stocks, bonds, or commodities. If the NASDAQ is down because of a spike in tech-specific regulation, but your portfolio also contains energy or consumer staples, your total net worth is protected. Observing the NASDAQ’s daily performance should serve as a constant reminder to check your asset allocation and ensure you aren’t over-leveraged in a single niche.

Conclusion: Staying Informed in a Fast-Paced Market
In conclusion, when you investigate what the NASDAQ Composite did today, you are engaging with the most dynamic sector of the global financial markets. You are seeing the real-time valuation of the world’s most innovative companies and the collective reaction of investors to the shifting tides of the global economy.
A single day’s performance is a chapter in a much larger story. For the savvy investor, a “green day” is an opportunity to evaluate gains, while a “red day” is often a chance to look for value or reassess risk tolerance. By understanding the composition of the index, the macroeconomic factors that drive it, and the technical signals that define its movement, you can transform from a passive observer into an informed participant in the world of finance. Whether the NASDAQ is up or down, the key is to maintain a professional perspective, focusing on long-term financial health rather than short-term market noise. Staying informed is the first step toward building lasting wealth in an ever-changing digital economy.
aViewFromTheCave is a participant in the Amazon Services LLC Associates Program, an affiliate advertising program designed to provide a means for sites to earn advertising fees by advertising and linking to Amazon.com. Amazon, the Amazon logo, AmazonSupply, and the AmazonSupply logo are trademarks of Amazon.com, Inc. or its affiliates. As an Amazon Associate we earn affiliate commissions from qualifying purchases.