
In the world of investing and corporate finance, there are dozens of metrics used to evaluate the health of a company. From Price-to-Earnings (P/E) ratios to debt-to-equity measurements, investors have no shortage of data points. However, few metrics are as revered or as revealing as Return on Equity (ROE). Often considered the “gold standard” of profitability ratios, ROE provides a direct window into how effectively a company’s management is utilizing the capital provided by its shareholders to generate earnings.
For anyone serious about personal finance, stock market investing, or business management, understanding ROE is not just a benefit—it is a necessity. It is the metric that separates efficient, high-growth machines from stagnant, capital-intensive businesses.
1. Defining the Mechanics: How ROE is Calculated and Interpreted
At its core, Return on Equity is a measure of financial performance. It tells you how many dollars of profit a company generates for each dollar of shareholders’ equity. Unlike other metrics that look at total assets, ROE focuses specifically on the “owners’ stake” in the business.
The Basic Formula
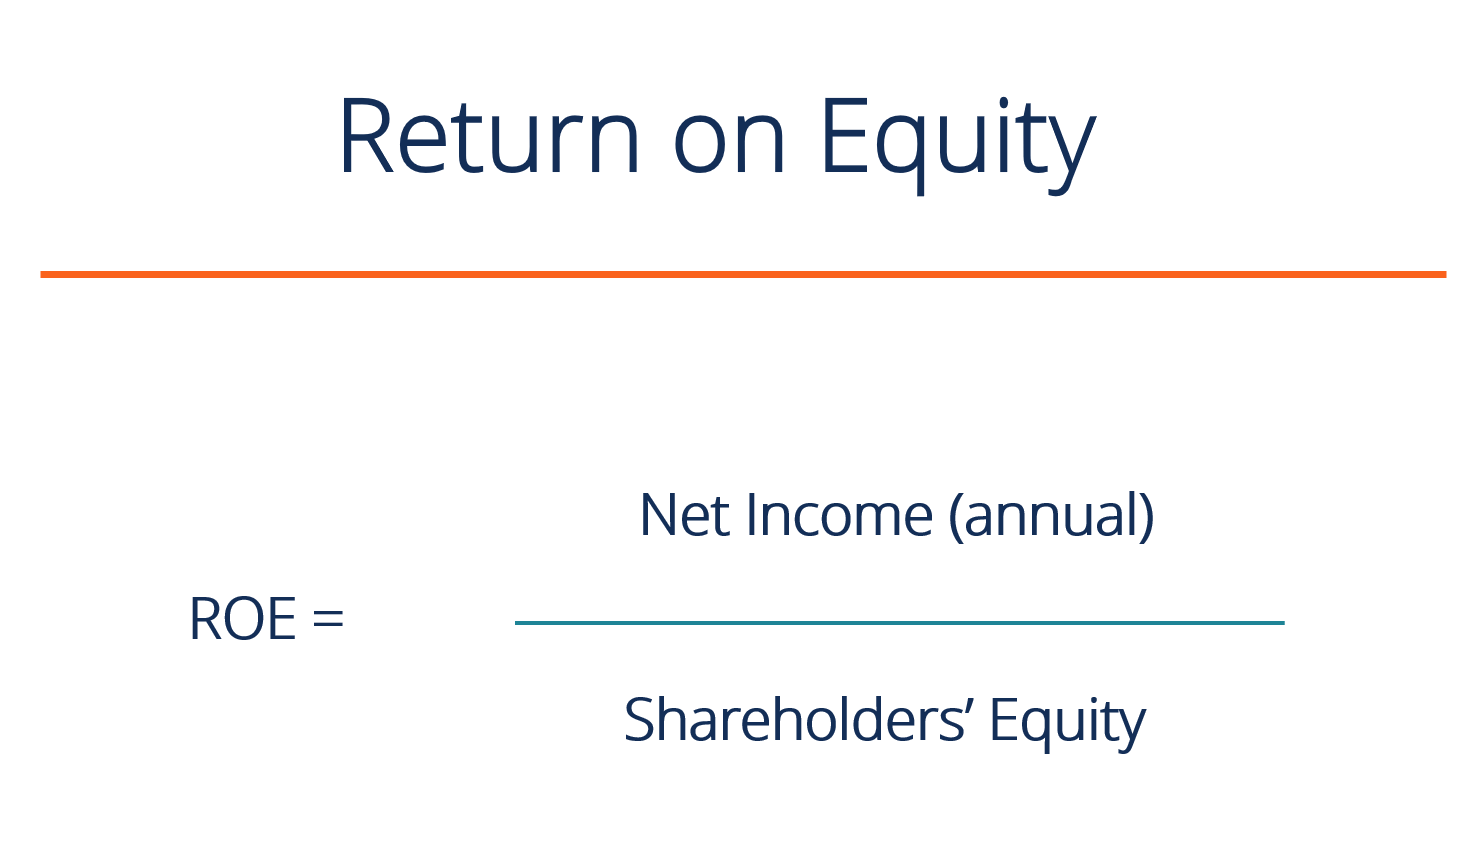
The mathematical representation of ROE is straightforward:
ROE = Net Income / Shareholders’ Equity
To find these numbers, an investor looks at two primary financial statements: the Income Statement (for Net Income) and the Balance Sheet (for Shareholders’ Equity). Net Income is the “bottom line” profit after all expenses, taxes, and interest have been paid. Shareholders’ Equity is what would remain if a company sold all its assets and paid off all its debts.
Breaking Down Shareholders’ Equity
Understanding the denominator of the ROE equation is crucial. Shareholders’ Equity consists of the initial capital invested by founders and shareholders, plus any “retained earnings”—the profits the company has kept over time rather than paying out as dividends. If a company consistently grows its retained earnings while maintaining high profitability, its ROE will remain robust, signaling a compounding effect that is highly attractive to long-term investors.
A Practical Calculation Example
Imagine “Company A” earns $10 million in net income over a fiscal year. On its balance sheet, it lists total assets of $100 million and total liabilities of $50 million. This leaves a shareholders’ equity of $50 million.
Using the formula: $10M / $50M = 0.20, or 20%.
In this scenario, for every dollar of equity invested by shareholders, Company A generated 20 cents of profit. Generally, an ROE of 15% to 20% is considered good to excellent in the broader market, though these benchmarks vary by industry.
2. The Investor’s Perspective: Why ROE is a Window into Management Quality
Investors don’t just look at ROE to see how much money a company made; they use it to judge the quality of the leadership team. A high ROE suggests that the management is adept at capital allocation—the art of deciding where to put money to get the highest return.
Measuring Management Efficiency
Management has several choices when they generate profit: they can pay dividends, buy back shares, or reinvest in the business. A consistently high ROE indicates that management is successfully reinvesting profits back into the company to generate even more growth. It proves that the leadership isn’t just “sitting on cash” or wasting it on projects that don’t yield a return. In the eyes of a value investor, a steady or rising ROE over five to ten years is a hallmark of a “moat”—a competitive advantage that protects the business from rivals.
Profitability vs. Growth
It is a common misconception that a “growing” company is always a “good” company. A business can grow its revenue by 50% year-over-year while actually destroying value if its cost of capital is higher than its return. ROE acts as a check and balance. If a company’s ROE is lower than the interest rate it pays on its debt, the company is effectively losing value as it grows. High ROE ensures that growth is “profitable growth,” which is the only kind that creates long-term wealth for shareholders.
Identifying Sustainable Competitive Advantages
Companies with a high ROE often possess intangible assets that are difficult for competitors to replicate. This might include a powerful brand, proprietary technology, or significant economies of scale. Because these companies don’t need to constantly buy expensive new machinery or real estate to grow (high asset turnover), they can produce outsized profits on a relatively small equity base. This “capital-light” model is what many of the world’s most successful investors, including Warren Buffett, look for when building a portfolio.
3. The DuPont Analysis: Deconstructing ROE for Deeper Insight
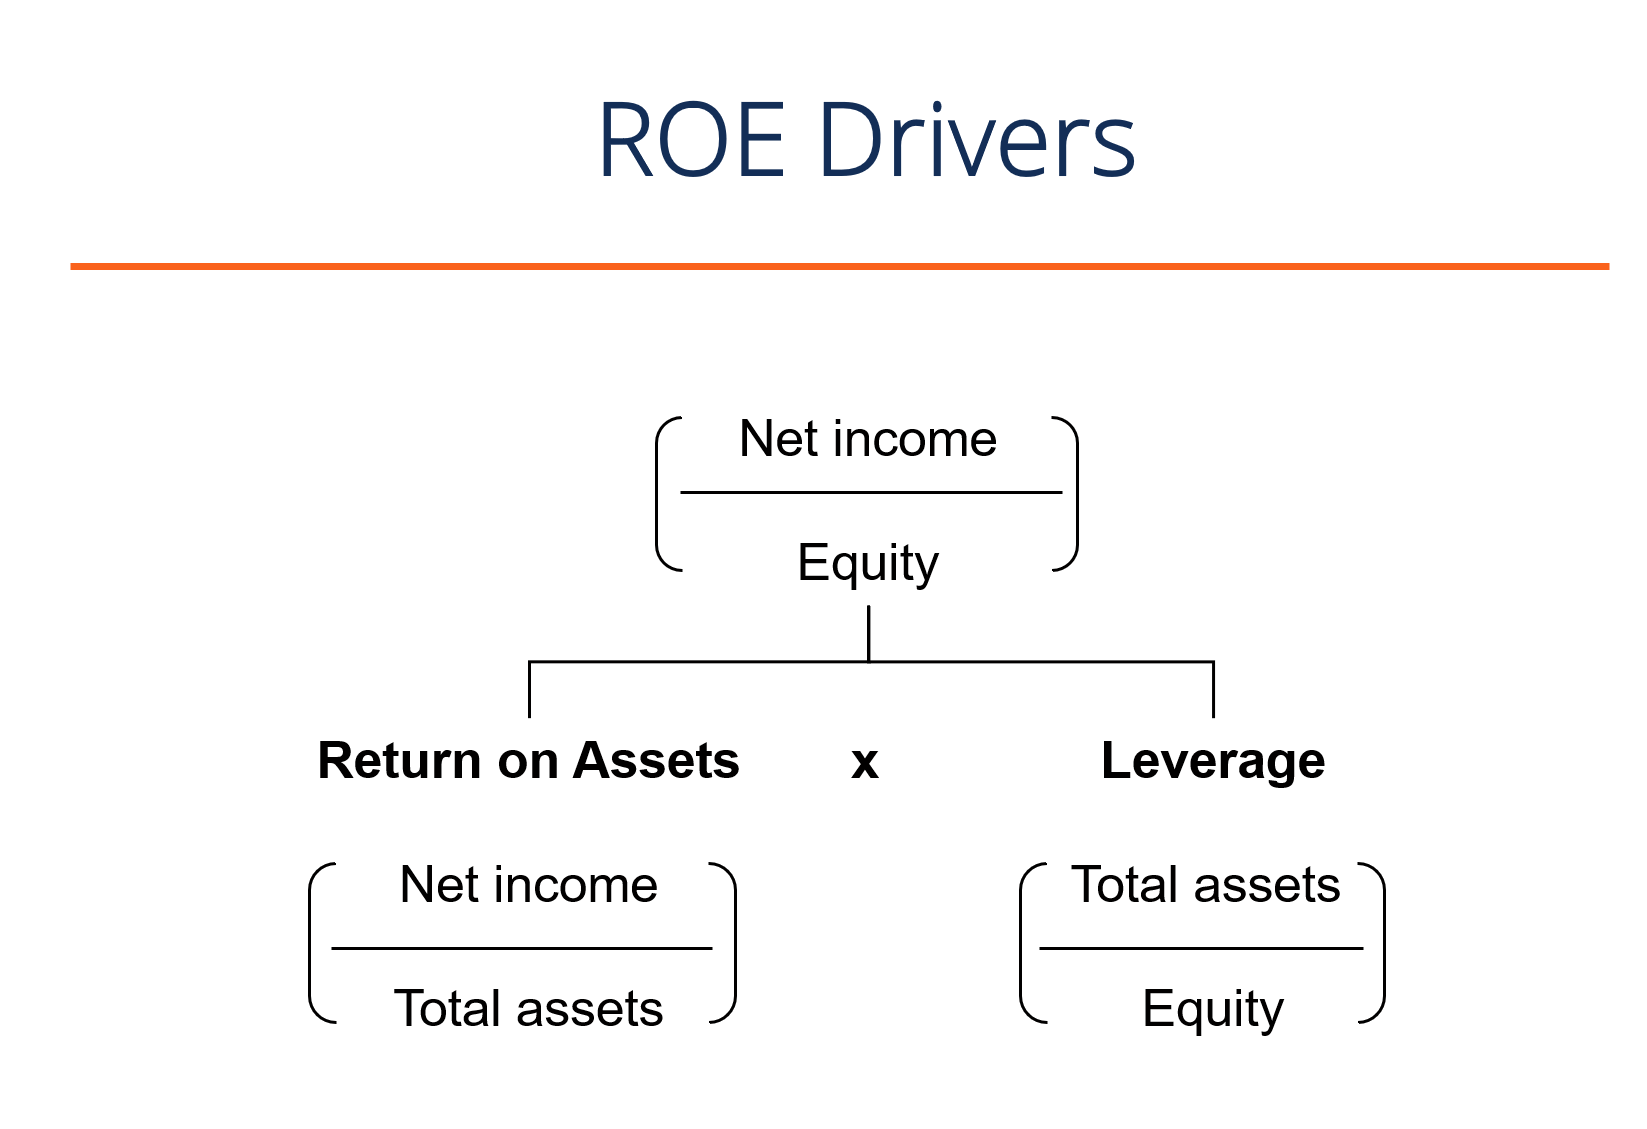
One of the dangers of looking at ROE in isolation is that it can be “gamed.” A company could theoretically show a high ROE even if it is performing poorly, simply by taking on massive amounts of debt. To prevent being misled, sophisticated investors use the “DuPont Analysis.” This method breaks ROE into three distinct components to see exactly where the return is coming from.
Component 1: Operating Efficiency (Net Profit Margin)
The first part of the DuPont model looks at Net Profit Margin (Net Income / Sales). This measures how much of every dollar of revenue is kept as profit. If a company’s ROE is high because its profit margin is high, it suggests the company has strong pricing power or excellent cost controls.
Component 2: Asset Use Efficiency (Asset Turnover)
The second part is Asset Turnover (Sales / Average Total Assets). This measures how efficiently a company uses its assets to generate sales. A grocery store might have very low profit margins, but if it moves inventory off the shelves incredibly fast, it can still achieve a high ROE through sheer volume and efficiency.
Component 3: Financial Leverage (The Equity Multiplier)
The final component is the Equity Multiplier (Average Total Assets / Average Shareholders’ Equity). This is the “wild card.” It measures financial leverage. If a company has a high ROE but a very low profit margin and slow asset turnover, it means they are using heavy debt to juice their returns. While leverage can amplify gains in good times, it increases the risk of bankruptcy during a downturn. By using the DuPont Analysis, an investor can determine if a company’s ROE is “high quality” (driven by margins and efficiency) or “high risk” (driven by debt).
4. Limitations and Red Flags: When ROE Can Be Deceptive
While ROE is a powerful tool, it is not infallible. There are specific financial maneuvers and accounting realities that can make a company’s ROE look much better—or worse—than it actually is.
The Impact of Excessive Debt
As touched upon in the DuPont Analysis, debt is the most common distorter of ROE. Because Shareholders’ Equity is calculated as Assets minus Liabilities, increasing liabilities (debt) automatically shrinks the equity base. A smaller denominator makes the resulting ROE percentage look larger. If a company has a 40% ROE but is teetering on a mountain of debt, that 40% represents a high-risk gamble rather than a sign of operational excellence.
The Distortion of Share Buybacks
In the modern corporate era, many companies use their excess cash to buy back their own shares. When a company buys back shares, it reduces the “Shareholders’ Equity” on the balance sheet. This causes the ROE to spike, even if the company’s net income hasn’t increased at all. While buybacks can be good for shareholders, an investor must be careful to distinguish between an ROE increase caused by genuine business growth and one caused by an accounting reduction in equity.
Negative ROE and Asset-Heavy Models
If a company reports a net loss, its ROE will be negative. A negative ROE is generally a sign of trouble, but for early-stage startups or companies in a temporary cyclical downturn, it may not tell the whole story. Conversely, capital-intensive industries like airlines or traditional manufacturing naturally have lower ROEs because they require billions of dollars in equity to purchase planes or factories. Comparing the ROE of a software company (high ROE, low equity) to an airline (low ROE, high equity) is like comparing apples to oranges.
5. Sector Benchmarking: Applying ROE to Your Portfolio
To use ROE effectively in personal finance and investing, you must apply it within the context of specific industries. “Good” is a relative term in finance.
Asset-Light vs. Capital-Intensive Sectors
In the technology and service sectors, ROEs of 25% or higher are common because these businesses don’t require massive physical infrastructure to scale. A software company can sell to a million more customers with very little additional equity investment. On the other hand, a utility company that must build and maintain power plants might consider a 10% to 12% ROE a major success. When analyzing a stock, always compare its ROE against its direct industry peers to see if it is truly an outperformer.
Setting Benchmarks for Success
For a diversified portfolio, many investors look for a “sweet spot” of a 15% ROE with moderate debt. This usually indicates a company that is profitable enough to self-fund its growth without relying on the whims of the credit markets. If you find a company with a 20% ROE that has maintained that level for a decade, you are likely looking at a high-quality “compounder” that can significantly grow your wealth over time.

Conclusion: Integrating ROE into a Financial Strategy
Return on Equity is more than just a percentage on a spreadsheet; it is a summary of a company’s financial soul. It tells you how efficient the management is, how profitable the business model is, and how much risk is being taken behind the scenes.
By mastering the calculation, utilizing the DuPont Analysis to spot hidden risks, and benchmarking against industry standards, you can use ROE to filter out mediocre businesses and focus your capital on the true engines of wealth creation. Whether you are analyzing a Fortune 500 company or evaluating a small business venture, ROE remains the most potent tool in the investor’s toolkit for measuring the true return on every dollar invested.
aViewFromTheCave is a participant in the Amazon Services LLC Associates Program, an affiliate advertising program designed to provide a means for sites to earn advertising fees by advertising and linking to Amazon.com. Amazon, the Amazon logo, AmazonSupply, and the AmazonSupply logo are trademarks of Amazon.com, Inc. or its affiliates. As an Amazon Associate we earn affiliate commissions from qualifying purchases.