In the landscape of modern technology, the ability to measure the invisible has become a cornerstone of innovation. From the smartphones in our pockets to the sophisticated drones navigating our skies, barometric pressure sensors play a pivotal role in how devices perceive their environment. But to understand the data these sensors provide, we must first define the parameters of the digital atmosphere. Understanding what is considered high and low barometric pressure is no longer just a task for meteorologists; it is a critical requirement for software engineers, hardware designers, and tech enthusiasts who rely on precision environmental data.

Understanding the Fundamentals of Digital Barometers
Before we can categorize pressure readings into “high” or “low,” we must understand the hardware responsible for these measurements. In the tech world, we have moved far beyond the mercury-filled glass tubes of the past. Today, we utilize Micro-Electro-Mechanical Systems (MEMS).
The Transition from Analog to MEMS Sensors
Modern electronics utilize MEMS barometric pressure sensors, which are essentially tiny silicon chips that detect the physical deformation of a diaphragm. As atmospheric pressure changes, this microscopic diaphragm flexes, altering the electrical resistance or capacitance of the circuit. This shift is then converted into a digital signal that software can interpret. This transition from bulky analog tools to nanometer-scale sensors has allowed for the integration of barometry into everything from fitness trackers to industrial IoT (Internet of Things) gateways.
How Modern Hardware Quantifies Atmospheric Weight
Barometric pressure is effectively the weight of the air column above a specific point. In the tech industry, this is typically measured in Hectopascals (hPa) or Millibars (mbar), which are functionally equivalent. Some legacy systems and aviation tech still use Inches of Mercury (inHg). A digital sensor’s job is to provide a “noise-free” reading that can distinguish between a change in weather and a change in altitude—a process known as sensor fusion.
Defining the Thresholds: What is “High” and “Low” in the Tech Context?
In the digital ecosystem, barometric pressure is measured against a standardized baseline. To determine if a reading is high or low, software algorithms refer to the Standard Atmosphere (ISA) model.
Standard Atmospheric Pressure (The Baseline)
The global baseline for barometric pressure at sea level is 1013.25 hPa (29.92 inHg). This is the “neutral” point. Any technical application, whether it’s a weather app or a drone’s flight controller, uses this figure as the starting point for calibration. When a sensor reports a value significantly above or below this mean, the system triggers specific logic sequences.
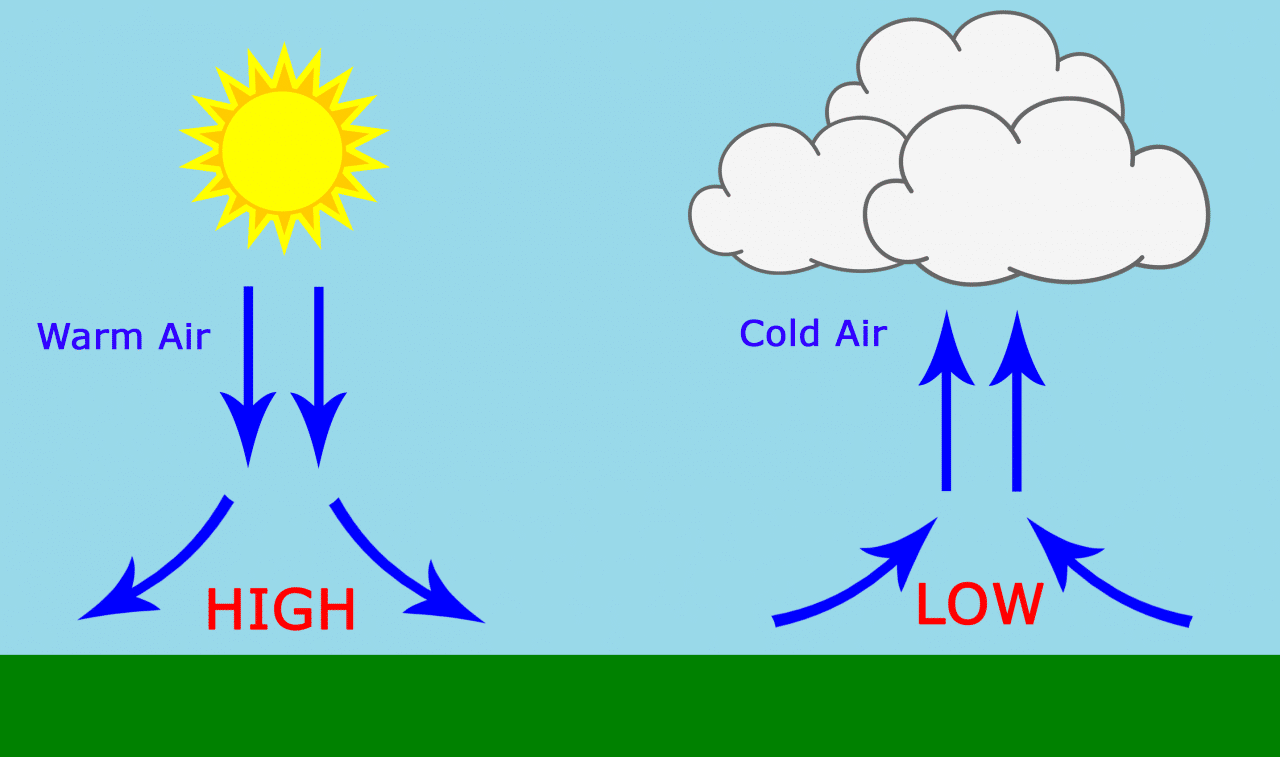
High Pressure Systems: Technical Parameters and Anticyclones
“High” barometric pressure is generally considered anything above 1020 hPa (30.12 inHg). In technical terms, high-pressure systems (anticyclones) indicate sinking air, which usually results in stable, dry conditions.
- Extreme Highs: Readings above 1040 hPa are considered exceptionally high and are often monitored by industrial sensors to adjust HVAC (Heating, Ventilation, and Air Conditioning) performance in “clean room” environments.
- System Impact: For outdoor tech, high pressure typically means lower signal interference from moisture, providing optimal conditions for long-range radio frequency (RF) transmissions and satellite link-ups.
Low Pressure Systems: Data Indicators for Cyclones
Conversely, “low” barometric pressure is defined as anything below 1000 hPa (29.53 inHg). Low pressure indicates rising air, which often leads to cloud formation and precipitation.
- Significant Lows: A drop below 980 hPa is indicative of a severe weather event or a significant storm cell.
- Predictive Maintenance: IoT networks in smart cities use these “low” triggers to initiate automated safety protocols, such as closing external vents on sensitive hardware enclosures or alerting logistics drones to return to base to avoid high-wind turbulence.
Applications in Consumer Electronics and Wearables

The distinction between high and low pressure is perhaps most visible in the consumer tech sector. For the average user, these readings are transformed into actionable health and navigation data.
Altimetry and GPS Enhancement in Smartwatches
While GPS is excellent for horizontal positioning (latitude and longitude), it is notoriously inaccurate for vertical positioning (altitude). Modern smartwatches use barometric sensors to fill this gap. By detecting the minute drop in pressure as a user moves upward (as pressure decreases with height), the device can calculate altitude with incredible precision.
- Software Logic: When the sensor detects a rapid transition from high to low pressure without a corresponding change in the user’s GPS coordinates, the software interprets this as a “floor climbed” rather than a weather change.
Activity Tracking: Vertical Velocity and Caloric Burn
For fitness tech, the “low” and “high” readings are used to calculate “Vertical Velocity.” In high-performance sports tech, such as cycling computers, the barometric sensor tracks “total ascent.” Because air pressure is denser (higher) at the base of a hill and thinner (lower) at the peak, the integration of this data allows for a more accurate calculation of a user’s power output and caloric expenditure, accounting for the increased effort of fighting gravity.
The Role of Barometric Data in IoT and Smart Home Ecosystems
The Internet of Things has revolutionized how we use atmospheric data. In a smart home or an automated industrial facility, the barometric sensor acts as a sentinel for the internal environment.
Hyper-Local Weather Monitoring and Automation
Smart home weather stations, such as those integrated into Zigbee or Z-Wave networks, monitor pressure trends rather than just static numbers. A “falling barometer”—moving from a high-pressure state to a low-pressure state—is a reliable technical trigger for automation.
- Example: A smart home hub detects a 5 hPa drop over three hours. The system interprets this as an approaching storm and automatically retracts motorized awnings, closes smart windows, and sends a push notification to the user’s smartphone.
Industrial Applications: HVAC Systems and Server Room Safety
In data centers and server rooms, maintaining “positive pressure” is a common strategy to keep dust and contaminants out. High-precision barometric sensors monitor the difference between the high pressure inside the server room and the ambient pressure outside. If the internal pressure drops (nearing the “low” ambient threshold), it signifies a seal failure or an HVAC malfunction, triggering an immediate cooling audit to protect high-value hardware from overheating or dust accumulation.
The Future of Atmospheric Data Processing: AI and Crowdsourcing
As we look toward the future, the categorization of high and low pressure is becoming more dynamic, thanks to artificial intelligence and edge computing.
Edge Computing and Real-Time Environmental Analysis
Modern chipsets are now capable of “Edge AI,” where the processing of barometric data happens on the device rather than in the cloud. This allows for instantaneous responses. For example, autonomous delivery drones use real-time barometric analysis to adjust their rotor speeds. If the drone encounters a sudden low-pressure pocket (which reduces lift), the onboard AI compensates in milliseconds to maintain a steady altitude, a feat that would be impossible with the latency of cloud-based processing.
Crowdsourced Data and Global Pressure Mapping
One of the most exciting trends in tech is the crowdsourcing of barometric data. Companies like Apple and Google can theoretically aggregate the barometric readings from millions of smartphones simultaneously. By analyzing these millions of “high” and “low” data points, tech companies can create a real-time, high-resolution map of atmospheric pressure. This “Big Data” approach allows for “hyper-casting”—weather forecasting that is accurate down to a specific city block—providing a level of granular detail that traditional satellite-based meteorology cannot match.
Conclusion
In the realm of technology, barometric pressure is far more than a number on a weather report. It is a critical data stream that informs the logic of our most advanced devices. By defining “high” as anything above 1020 hPa and “low” as anything below 1000 hPa, we create a binary framework that allows software to make decisions, drones to stay airborne, and wearables to track our every move. As sensor technology continues to shrink in size and grow in sensitivity, our ability to interpret these atmospheric fluctuations will only become more vital, turning the invisible weight of the air into a powerful tool for the digital age.
aViewFromTheCave is a participant in the Amazon Services LLC Associates Program, an affiliate advertising program designed to provide a means for sites to earn advertising fees by advertising and linking to Amazon.com. Amazon, the Amazon logo, AmazonSupply, and the AmazonSupply logo are trademarks of Amazon.com, Inc. or its affiliates. As an Amazon Associate we earn affiliate commissions from qualifying purchases.