
In the world of high-stakes finance and market analysis, technical indicators serve as the compass for traders navigating the volatile seas of stocks, forex, and cryptocurrencies. Among the most revered tools in a professional trader’s arsenal is the DMI. But what does DMI mean, and why is it considered a cornerstone of trend analysis?
DMI stands for the Directional Movement Index. Developed by the legendary technical analyst J. Welles Wilder Jr. in 1978—the same mastermind behind the Relative Strength Index (RSI)—the DMI is a sophisticated mathematical framework designed to determine the direction in which an asset’s price is moving and, more importantly, the strength of that movement. Unlike simpler indicators that merely track price changes, the DMI looks at the relationship between daily highs and lows to filter out market noise and reveal the underlying momentum of the bulls and the bears.
Decoding the DMI: The Mechanics of Directional Movement
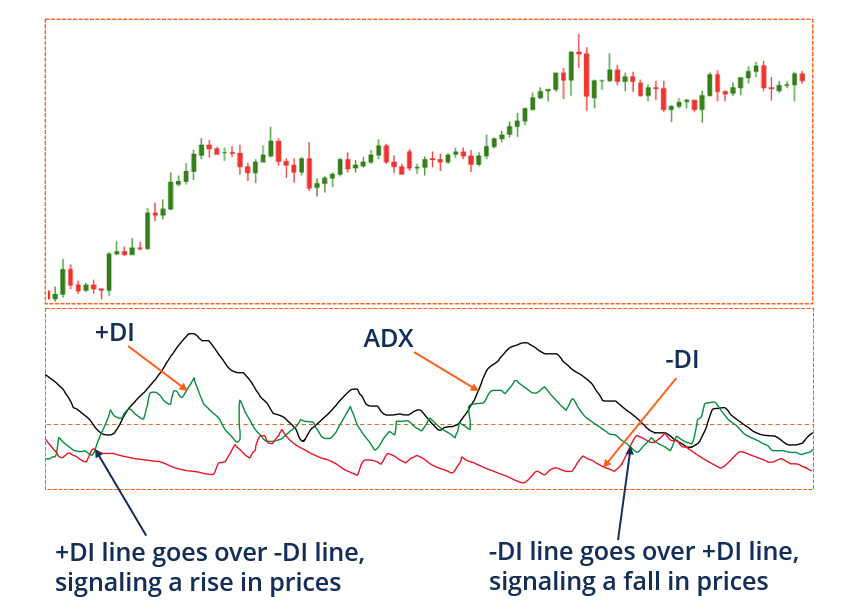
To understand the DMI, one must look under the hood at its three primary components. The indicator is typically displayed as three separate lines moving along a shared axis. While they may look like a chaotic “spaghetti chart” to the uninitiated, each line represents a specific force within the market.
The Positive Directional Indicator (+DI)
The +DI is the “bullish” component of the DMI. It measures the presence of upward price movement. Specifically, it calculates how much higher the current high is compared to the previous high. When the +DI is rising, it signals that the market’s upward momentum is increasing. In a healthy uptrend, the +DI will consistently stay above its counterpart, showing that buyers are successfully pushing the price into new territory.
The Negative Directional Indicator (-DI)
Conversely, the -DI is the “bearish” component. It tracks downward price movement by measuring how much lower the current low is than the previous period’s low. If the -DI is the dominant line, it indicates that sellers are in control and the asset is under distribution. Understanding the interplay between the +DI and -DI is essential; when these two lines cross, it often signals a potential change in market leadership.
The Role of the Average Directional Index (ADX)
While the +DI and -DI tell you the direction, the ADX (Average Directional Index) tells you the strength. This third line is perhaps the most famous part of the DMI suite. It does not indicate whether the price is going up or down; rather, it measures how powerful the current trend is. An ADX reading above 25 generally suggests a strong trend is underway, while a reading below 20 indicates a “choppy” or range-bound market where trend-following strategies might fail.
Why DMI is Crucial for Modern Financial Analysis
In an era of algorithmic trading and high-frequency fluctuations, distinguishing between a genuine trend and temporary market “noise” is the difference between profit and loss. The DMI serves as a filter that helps investors make more disciplined decisions.
Identifying Trend Strength vs. Trend Direction
Most novice investors make the mistake of buying just because a price is moving up. However, without a strong trend (as indicated by the ADX component of the DMI), that upward move could be a “bull trap”—a brief spike before a crash. The DMI allows a trader to say, “The trend is up (+DI > -DI), and it is backed by significant institutional momentum (ADX > 25).” This dual-confirmation reduces the likelihood of entering a trade that lacks the “legs” to reach a profit target.
Reducing Market Noise in Volatile Assets
Assets like growth stocks or digital currencies often experience “whipsaws”—sudden, violent moves in both directions that don’t change the overall trend. Because the DMI focuses on the range between highs and lows rather than just the closing price, it provides a smoother view of market conviction. By focusing on whether the “directional movement” is increasing, investors can avoid the emotional exhaustion of reacting to every minor price tick.
Practical Applications: Trading Strategies Using DMI
Understanding the theory of what DMI means is only the first step; the real value lies in its application to a diversified financial portfolio. Professional traders use several specific setups to capitalize on DMI data.
The Crossover Strategy
The most fundamental DMI strategy is the crossover. When the +DI crosses above the -DI, it generates a “buy” signal, suggesting that bullish momentum has overtaken bearish momentum. Conversely, when the -DI crosses above the +DI, it generates a “sell” or “short” signal. However, seasoned investors rarely trade the crossover in isolation. They look for the ADX to be rising at the time of the cross, which confirms that the new direction has sufficient energy behind it.
Combining DMI with Volume and Support/Resistance
To increase the probability of success, DMI is often paired with other financial pillars. For instance, a +DI crossover occurring at a major support level (a price where buyers historically enter) is a much stronger signal than one occurring in the middle of a price range. Furthermore, if the DMI indicates a strong upward trend and is accompanied by high trading volume, it suggests that “smart money” is participating in the move, adding another layer of security to the trade.
Common Pitfalls and Limitations of the DMI Indicator
No financial tool is a crystal ball. While the DMI is exceptionally powerful, it has limitations that every investor must respect to protect their capital.
The Lagging Nature of Trend Indicators
Like most technical indicators, the DMI is “lagging.” This means it is based on historical price data (usually the previous 14 days). By the time the +DI crosses the -DI and the ADX rises above 25, a significant portion of the initial price move may have already occurred. Traders must balance the desire for confirmation with the risk of entering a trade too late.
Navigating Whipsaws in Sideways Markets
The DMI’s greatest weakness is a “non-trending” or “ranging” market. When an asset price is moving sideways in a tight box, the +DI and -DI will frequently cross each other back and forth. If a trader blindly follows every crossover during a sideways period, they will fall victim to “whipsaws”—incurring multiple small losses as they are forced in and out of positions. This is why the ADX is so vital; if the ADX is low, many professionals choose to ignore DMI crossovers entirely and wait for the market to choose a definitive path.

Optimizing Your Financial Portfolio with DMI
Incorporating the DMI into your financial strategy requires a shift in mindset from “guessing” to “verifying.” It is not about predicting the future; it is about reacting to the current state of market momentum with a high degree of statistical confidence.
For long-term investors, the DMI can be used on weekly or monthly charts to identify “mega-trends.” Finding a sector or a stock where the +DI has remained above the -DI for several months while the ADX stays elevated can reveal the market’s true leaders. For short-term traders or side-hustlers looking for online income through swing trading, the DMI provides the necessary guardrails to manage risk and avoid overtrading in low-probability environments.
In conclusion, when we ask “what does DMI mean,” we are looking at the pulse of the financial markets. It is a comprehensive system that quantifies the eternal struggle between buyers and sellers. By mastering the relationship between the +DI, the -DI, and the ADX, you gain the ability to see through the fog of market volatility and align your capital with the strongest trends in the world of finance. Whether you are managing a personal retirement account or actively trading the markets, the DMI is an indispensable ally in the pursuit of consistent financial growth.
aViewFromTheCave is a participant in the Amazon Services LLC Associates Program, an affiliate advertising program designed to provide a means for sites to earn advertising fees by advertising and linking to Amazon.com. Amazon, the Amazon logo, AmazonSupply, and the AmazonSupply logo are trademarks of Amazon.com, Inc. or its affiliates. As an Amazon Associate we earn affiliate commissions from qualifying purchases.