
In the realm of finance, numbers are rarely viewed in isolation. A profit of $10,000 might be an extraordinary achievement for a local startup, yet a rounding error for a multinational corporation. To bring meaning to financial data, we rely on the language of proportions. Understanding how to calculate a percentage increase is perhaps the most fundamental skill for any investor, entrepreneur, or budget-conscious individual. It provides the necessary context to evaluate performance, measure the impact of inflation, and project future wealth.
Whether you are analyzing the year-over-year growth of a stock portfolio, negotiating a salary increase, or assessing the rising costs of raw materials in a business, the ability to accurately calculate and interpret percentage changes is indispensable. This guide explores the mechanics of these calculations and their strategic applications across the financial landscape.

The Fundamentals of Percentage Increase in Finance
Before diving into complex financial models, one must master the core arithmetic. A percentage increase represents the difference between a final value and an initial value, expressed as a portion of the original amount. In finance, this “original amount” is often referred to as the “cost basis” or the “principal.”
The Core Formula Explained
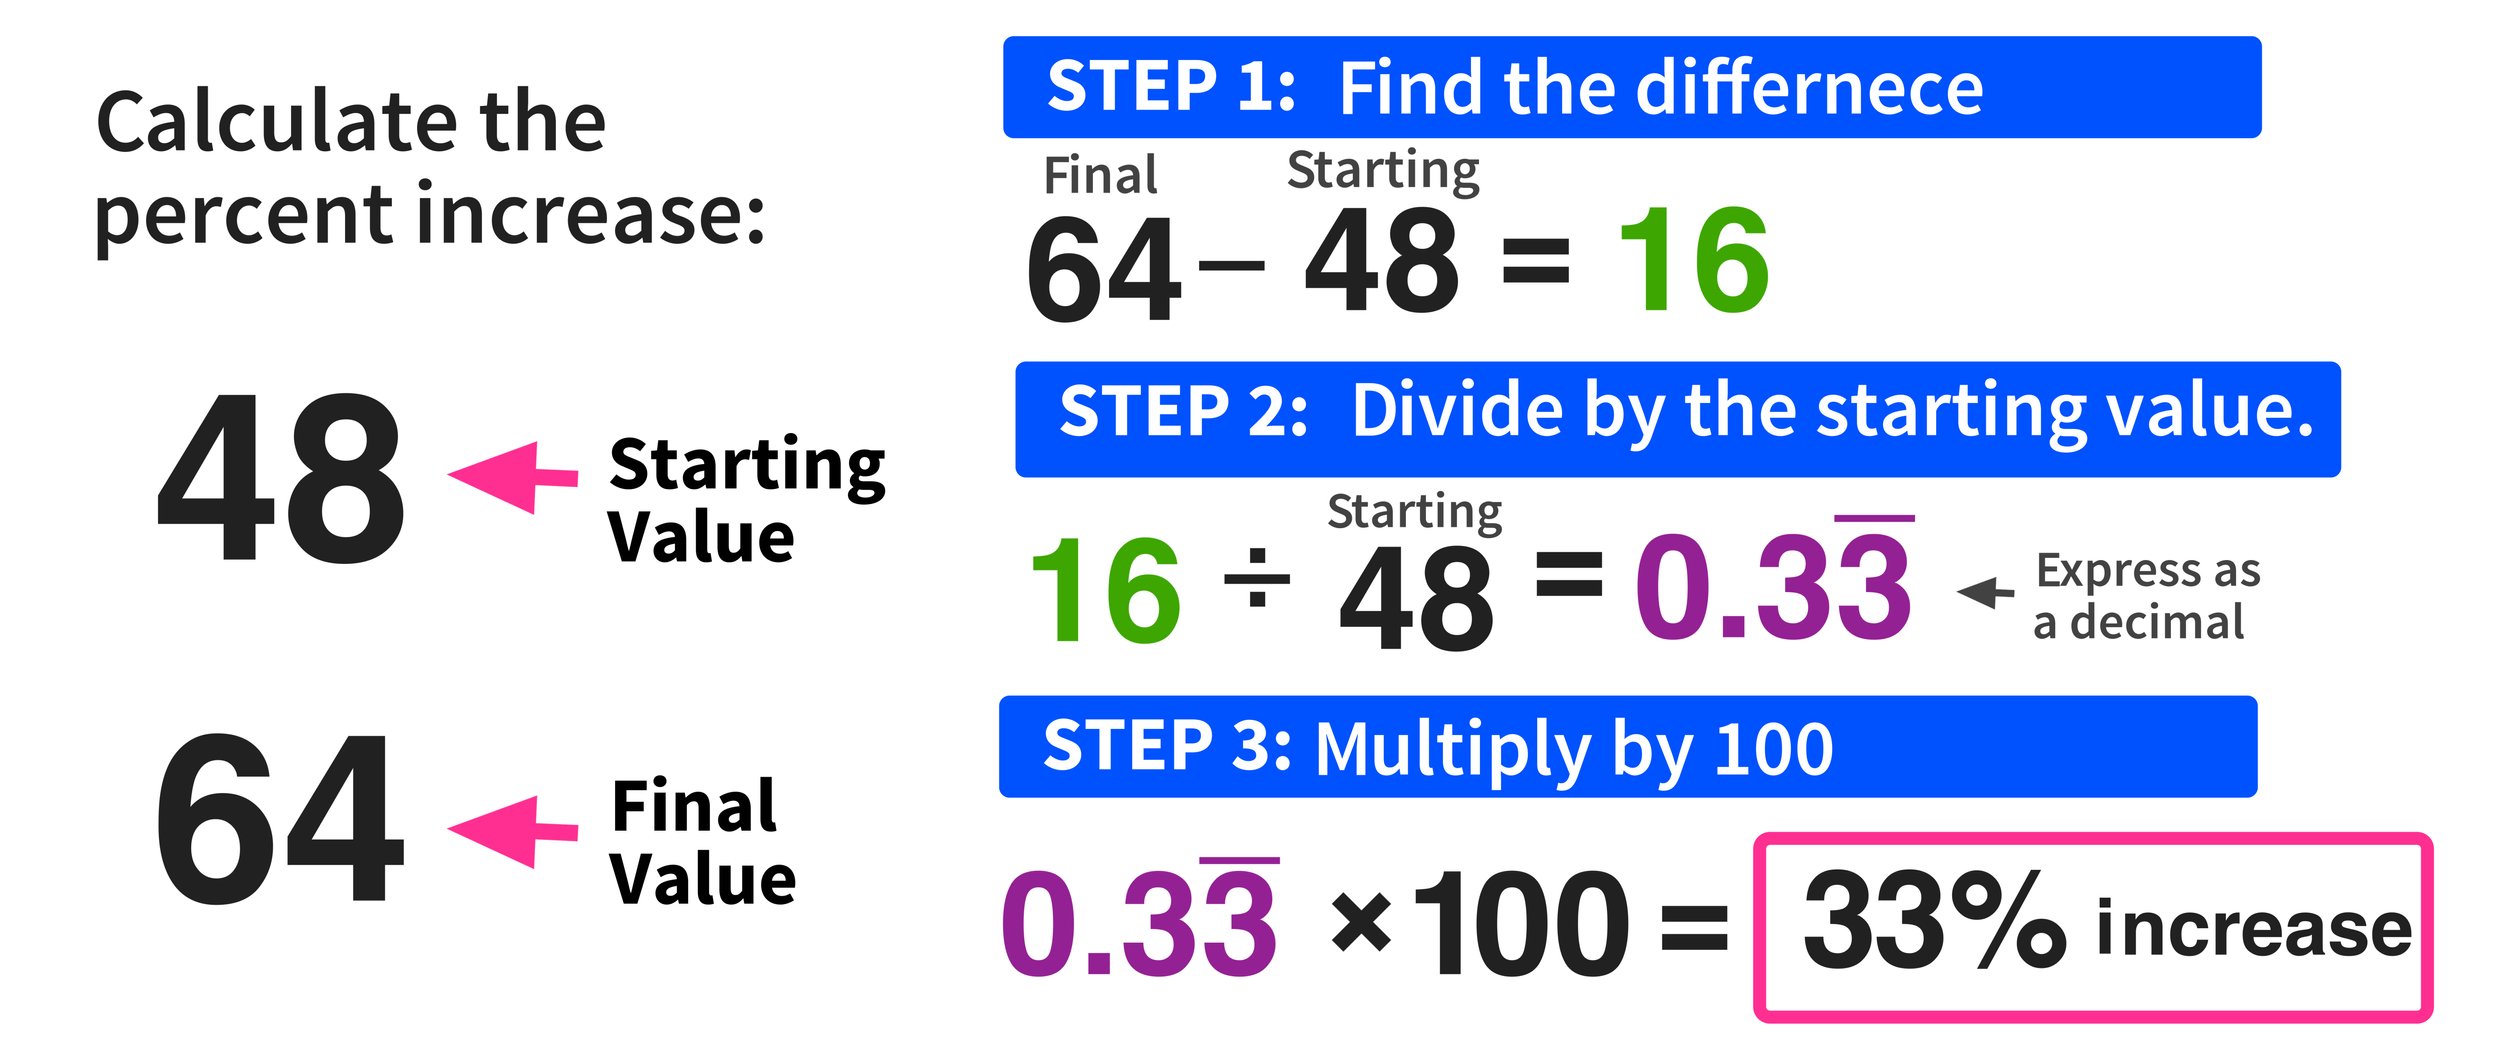
The mathematical formula for percentage increase is straightforward but requires precision:
Percentage Increase = [(New Value – Original Value) / Original Value] × 100
To use this in a practical financial scenario, imagine you invested $5,000 in a mutual fund last year, and today that investment is worth $5,750.
- Subtract the original value from the new value ($5,750 – $5,000 = $750).
- Divide the difference by the original value ($750 / $5,000 = 0.15).
- Multiply by 100 to get the percentage (0.15 × 100 = 15%).
Your investment has seen a 15% increase. This single figure tells you more about the quality of the investment than the raw $750 gain ever could, as it allows for a direct comparison against other assets or market benchmarks like the S&P 500.
The Importance of the Base Value
A common trap in financial analysis is ignoring the “base effect.” Because the percentage is always relative to the starting point, the same dollar increase can represent vastly different percentage growths depending on where you start. For instance, a $1,000 increase on a $10,000 portfolio is a 10% gain. However, a $1,000 increase on a $100,000 portfolio is a mere 1% gain. Understanding this relationship is vital when setting realistic financial goals and assessing the volatility of different asset classes.
Measuring Investment Performance and Portfolio Growth
For the modern investor, calculating percentage increases is the primary method for gauging success. Raw totals can be deceptive, especially when multiple deposits or withdrawals are made over time. By focusing on percentage growth, investors can strip away the noise and see the true efficiency of their capital.
Calculating Return on Investment (ROI)
ROI is the quintessential metric for any financial endeavor. While the basic percentage increase formula covers the capital gains, a comprehensive ROI calculation often includes other “increases” such as dividends or interest earned. If your stock increased by 5% in price but also paid a 2% dividend, your total percentage increase—your total return—is 7%. In a professional money management context, failing to calculate these “hidden” increases can lead to a significant underestimation of an asset’s true value.
Understanding Compound Annual Growth Rate (CAGR)
While a simple percentage increase tells you what happened between two points in time, it doesn’t account for the “smoothness” of that growth over several years. This is where the Compound Annual Growth Rate (CAGR) becomes essential. CAGR provides a geometric progression ratio that provides a constant rate of return over the time period.
If a business grows by 20% one year and 10% the next, you cannot simply average them to understand the long-term trajectory. By calculating the annualized percentage increase, investors can compare the performance of a highly volatile crypto asset against a steady government bond on an equal playing field.
Factoring in Inflation: Real vs. Nominal Returns
In the world of money, not all increases are “profitable.” This is the distinction between nominal and real percentage increases. If your high-yield savings account offers a 4% annual interest rate (nominal increase), but the national inflation rate is 5%, your purchasing power has actually decreased by roughly 1%. Understanding how to subtract the inflation percentage from your gain percentage is the difference between growing your wealth and merely watching numbers get larger while your buying power shrinks.

Business Finance: Analyzing Profitability and Revenue Streams
For business owners and financial analysts, percentage calculations are the pulse of the company. They are used to track health, identify inefficiencies, and justify pivots in strategy.
Year-over-Year (YoY) Revenue Growth
The most common metric reported in corporate earnings is Year-over-Year (YoY) growth. By comparing the revenue of Quarter 3 this year to Quarter 3 last year, a business can eliminate seasonal fluctuations (like the holiday rush) and see the true percentage increase in demand. A consistent 10% to 20% YoY increase is often the hallmark of a healthy, scaling enterprise. If the percentage increase begins to decelerate, it serves as an early warning sign for management to investigate market saturation or increased competition.
Profit Margin Expansion
It isn’t enough for revenue to increase; a sophisticated business owner looks at the percentage increase in margins. If a company’s revenue increases by 10% but its operating costs increase by 15%, the business is actually becoming less efficient.
Calculating the percentage increase in gross profit margins—the difference between revenue and the cost of goods sold—allows a business to see if its “pricing power” is growing. For example, if a brand raises prices by 5% and sees no drop in volume, the resulting percentage increase in net profit can be exponential, as many fixed costs remain the same.
Managing Supply Chain Cost Increases
In an era of fluctuating commodity prices, businesses must constantly calculate the percentage increase in their overhead. If the price of aluminum increases by 12%, a manufacturer must quickly calculate how that ripples through their unit cost. By understanding these percentages, they can decide whether to absorb the cost, optimize the manufacturing process, or pass the increase on to the consumer to maintain their own percentage margins.
Personal Finance Strategy: Salary Increases and Budgeting
On an individual level, the “percentage increase” is a powerful tool for career leverage and lifestyle design. Most people think of their income in terms of monthly or annual totals, but the most successful negotiators think in percentages.
Evaluating a Raise or Promotion
When a company offers a raise, they usually present it as a dollar amount (e.g., “We are giving you an extra $5,000 a year”). To truly value this offer, you must convert it to a percentage. If you were making $50,000, that is a 10% increase—a strong raise. If you were making $150,000, that is only a 3.3% increase, which might barely cover the rising cost of living.
Furthermore, when moving between jobs, calculating the “percentage jump” is vital. Financial experts often suggest that a job switch should ideally result in a 15% to 20% increase in total compensation to justify the risk of a new environment and the loss of tenure.
Tracking Expense Inflation in Your Household Budget
A budget is a living document, and percentage analysis helps keep it from becoming obsolete. By tracking the percentage increase in your “Four Walls” (housing, food, utilities, transportation), you can identify where your money is leaking. If your grocery bill has seen a 20% increase over six months while your income only increased by 3%, it signals a need to shift your spending habits or find new income streams. This proactive approach prevents “lifestyle creep,” where expenses grow at the same percentage as income, leaving the individual with no net gain in wealth.
Advanced Tools and Strategic Considerations
In the modern financial era, you don’t need to carry a chalkboard to track these changes. Technology has simplified the process, but the human element of interpretation remains paramount.
Leveraging Financial Tools for Automation
Most professional financial platforms, from Bloomberg Terminals to consumer apps like Mint or Personal Capital, automate percentage increase calculations. However, for personalized tracking, a simple spreadsheet in Excel or Google Sheets is often more powerful. Using the formula =(B2-A2)/A2 and formatting the cell as a percentage allows for real-time tracking of any financial metric. Advanced users can use “Conditional Formatting” to highlight cells where the percentage increase falls below a certain threshold, creating an automated “red flag” system for their investments or business costs.
The “Base Effect” Trap and Market Cycles
Context is everything. When a stock price drops from $100 to $50, that is a 50% decrease. However, for that stock to return to its original value of $100, it must experience a 100% increase from its new $50 base. This mathematical reality is why protecting against downside risk is so critical in money management. Large percentage losses require significantly larger percentage gains just to break even.
Conclusion
The ability to calculate a percentage increase is more than just a math problem; it is a lens through which we view financial progress. In the “Money” niche, this calculation serves as the ultimate equalizer, allowing us to compare different assets, timeframes, and business models. By mastering these calculations, you move beyond being a passive observer of your bank account and become a strategic manager of your wealth. Whether you are scaling a business or building a retirement fund, remember: it isn’t just about the dollars gained; it’s about the percentage of growth achieved.
aViewFromTheCave is a participant in the Amazon Services LLC Associates Program, an affiliate advertising program designed to provide a means for sites to earn advertising fees by advertising and linking to Amazon.com. Amazon, the Amazon logo, AmazonSupply, and the AmazonSupply logo are trademarks of Amazon.com, Inc. or its affiliates. As an Amazon Associate we earn affiliate commissions from qualifying purchases.