
In the realm of personal and business finance, numbers are the primary language of progress. Whether you are tracking the growth of a retirement portfolio, evaluating a potential salary increase, or analyzing the annual revenue of a startup, the ability to calculate and interpret percentage increases is a fundamental skill. A percentage increase isn’t just a mathematical output; it is a vital metric that provides context to raw data, allowing investors and professionals to measure performance over time.
Understanding how to work out a percentage increase empowers you to make data-driven decisions. It moves the conversation from “I made more money this year” to “My investment strategy yielded a 12% return,” providing a standardized way to compare different financial instruments and economic trends.

The Fundamental Mechanics of Percentage Growth
At its core, calculating a percentage increase is a process of determining how much a value has grown relative to its starting point. This provides a ratio that is then converted into a percentage to make it easily digestible and comparable.
The Basic Formula: From Old to New
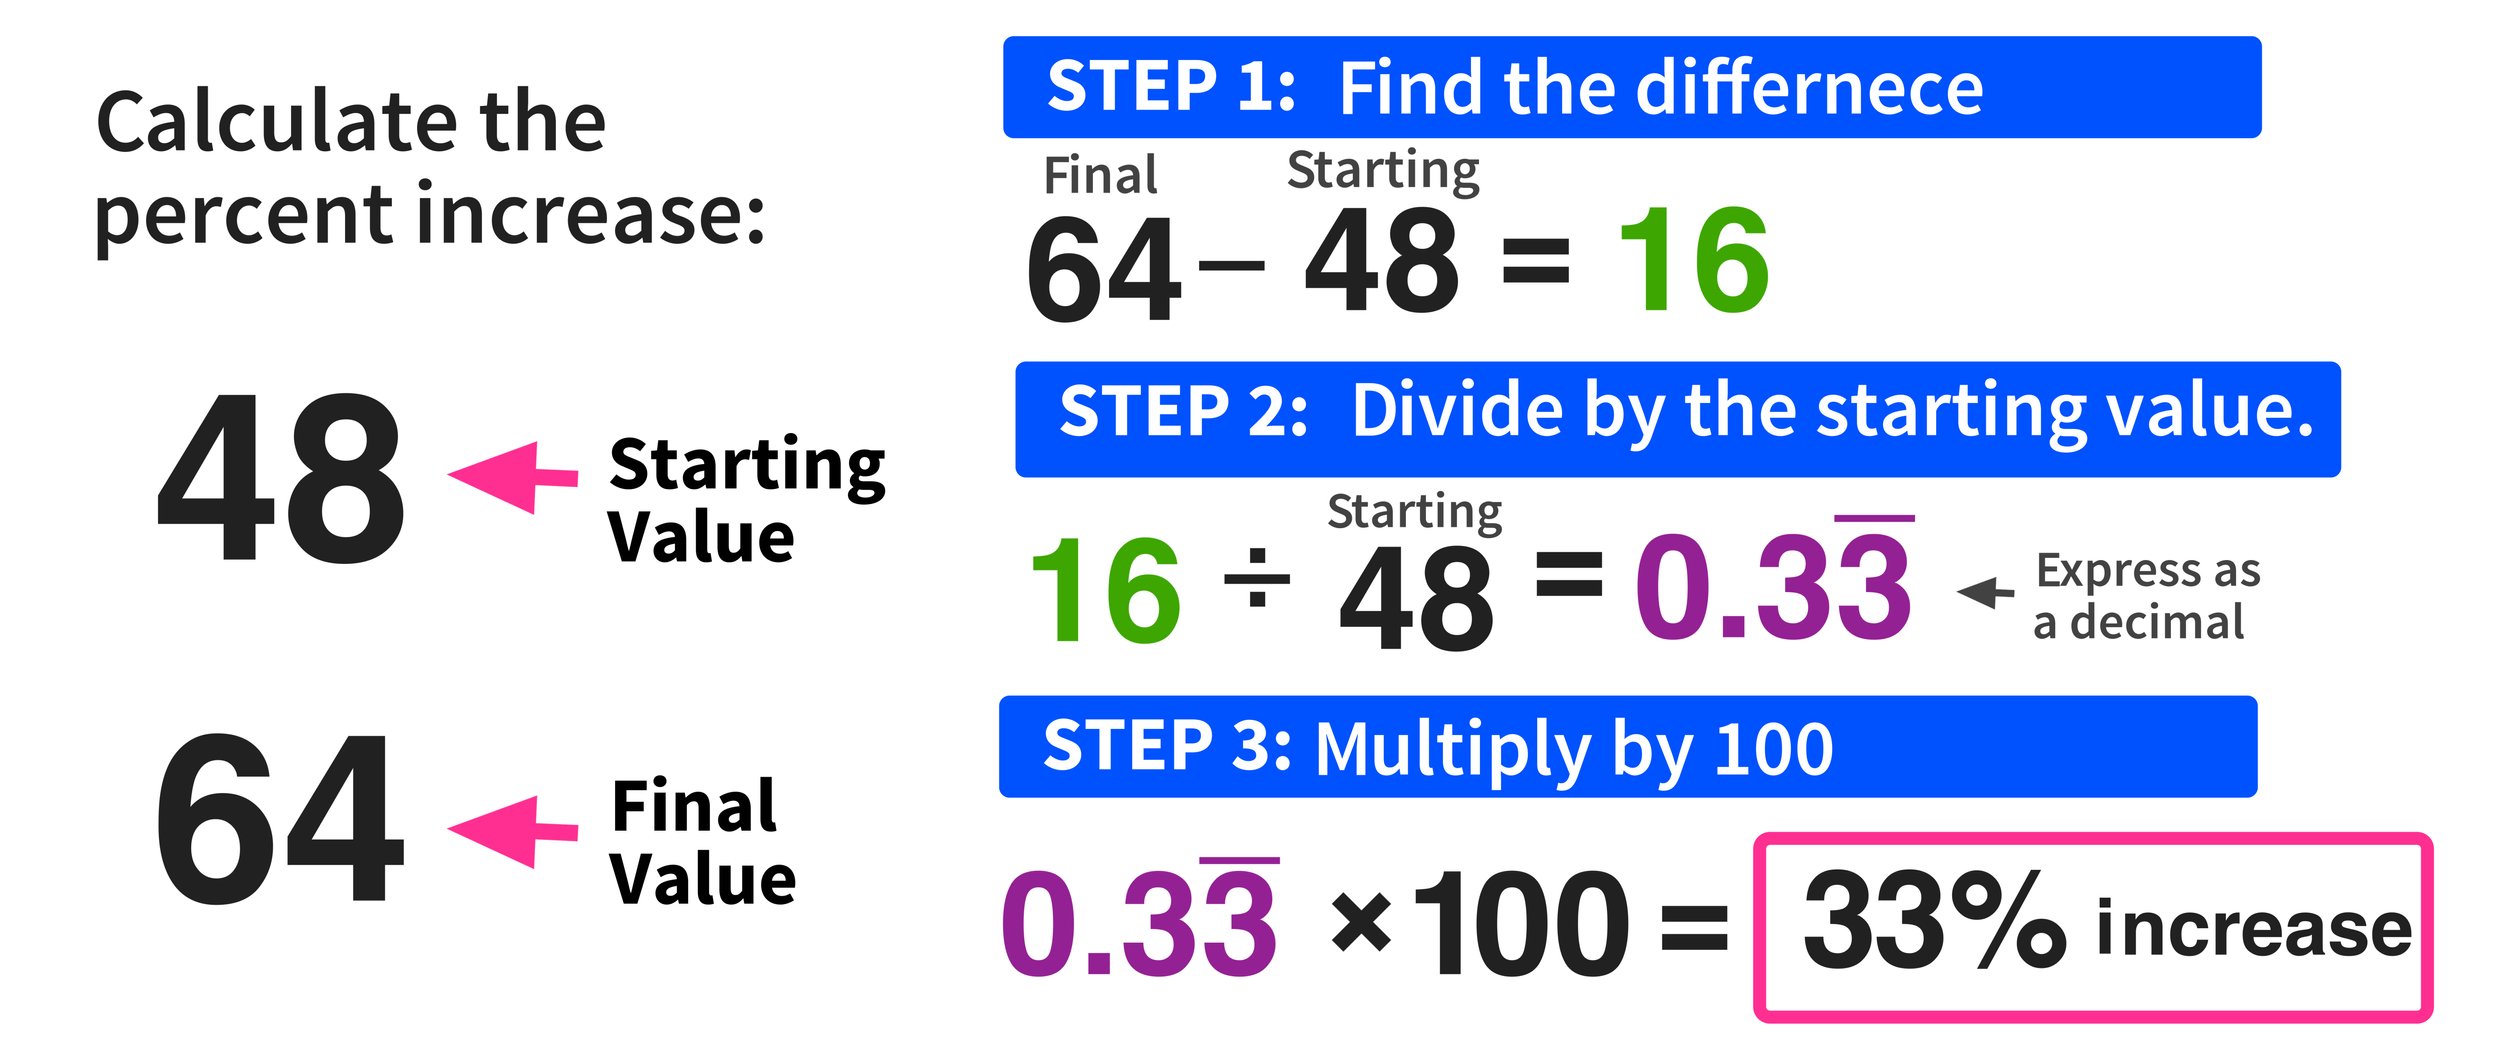
The mathematical formula for percentage increase is straightforward, yet its applications are infinite. To find the percentage increase between two values, you follow these steps:
- Subtract the original (old) value from the new value to find the “increase.”
- Divide that increase by the original value.
- Multiply the result by 100 to arrive at the percentage.
Formula: ((New Value - Original Value) / Original Value) * 100 = Percentage Increase
For example, if you purchased a share of a tech stock for $150 and its current market value is $195, the calculation would be:
($195 - $150) = $45
$45 / $150 = 0.3
0.3 * 100 = 30%
In this scenario, your investment has seen a 30% increase. This single figure tells a much clearer story of success than simply stating you gained $45.
Why Decimals and Ratios Matter in Finance
In professional financial analysis, the decimal form (the result before multiplying by 100) is often just as important as the percentage itself. Known as the “multiplier,” this figure is used extensively in compounding calculations. If a value increases by 30%, the multiplier is 1.30. Financial analysts use these multipliers to project future growth over multiple periods. Understanding the relationship between the decimal and the percentage is crucial when moving from basic arithmetic to complex financial modeling, such as discounted cash flow (DCF) analysis or assessing compound annual growth rates (CAGR).
Applying Percentage Increases to Personal Wealth
For the individual, percentage increases serve as the ultimate yardstick for financial health. Without these calculations, it is difficult to know if your wealth is truly outpacing the cost of living or if your career trajectory is meeting your financial goals.
Assessing Annual Salary Increments
When a professional receives a raise, the absolute dollar amount is often the focus. However, the percentage increase is the true measure of career progression. A $5,000 raise means something very different to someone earning $50,000 (a 10% increase) than it does to someone earning $200,000 (a 2.5% increase).
By calculating the percentage increase of a job offer or a promotion, you can better negotiate your worth. If the industry standard for a specific role has increased by 15% over two years, but your salary has only increased by 3%, you have quantitative evidence that your compensation is lagging behind the market. This data-driven approach is essential for effective personal branding and financial advocacy in the workplace.
Tracking Investment Portfolio Gains
Investors use percentage increases to evaluate the performance of diverse asset classes. If you have $10,000 in a High-Yield Savings Account (HYSA) and $10,000 in an Index Fund, the only way to compare their efficacy is through the percentage of growth.
If the HYSA grows to $10,450 (a 4.5% increase) while the Index Fund grows to $11,200 (a 12% increase), the percentage clarifies the “opportunity cost” of keeping too much cash in a savings account. Furthermore, tracking percentage increases over various timeframes—monthly, quarterly, and annually—allows investors to identify volatility and trends that raw dollar amounts might obscure.
Understanding Compound Interest and Yield
Percentage increases are the “fuel” for compound interest. When your investment increases by a certain percentage, and that new, larger amount increases by a percentage again in the next period, you are experiencing exponential growth. A 10% increase on $1,000 results in $1,100. The following 10% increase is calculated on the $1,100, resulting in $1,210. Over decades, these incremental percentage increases result in the vast majority of long-term wealth accumulation.
Business Finance: Measuring Performance and Scale
In the corporate world, percentage increases are used to communicate success to stakeholders, justify budget expansions, and signal market dominance.
Revenue and Profit Margin Growth
For a business, “Revenue Growth” is perhaps the most watched metric. If a company’s revenue was $1.2 million last year and reaches $1.5 million this year, the 25% increase indicates a healthy, scaling business. However, savvy financial managers look deeper into profit margins.
If revenue increases by 25% but operating costs increase by 40%, the business is actually becoming less efficient. By calculating the percentage increase of expenses versus the percentage increase of income, management can identify “margin squeeze.” This high-level analysis is what separates a sustainable business from one that is simply “growing broke.”
Customer Acquisition and Market Penetration
Beyond the balance sheet, percentages measure the success of marketing and operational strategies. A 15% increase in the customer base is a standard Key Performance Indicator (KPI). If a subscription-based service moves from 10,000 active users to 11,500, the 15% growth rate is used to project future server needs and staffing requirements.
In business finance, these percentages are also used to compare a company against its competitors. If the overall market for a product is growing at 5% per year, but your company’s sales are increasing by 15%, you are successfully capturing market share from competitors.
Avoiding Common Financial Pitfalls and Misinterpretations
While calculating a percentage increase is mathematically simple, interpreting the results requires a nuanced understanding of financial context. Misreading these numbers can lead to poor investment choices or a false sense of security.
The “Base Effect” Trap
One of the most common errors in financial reporting is ignoring the “base.” A large percentage increase can be misleading if the starting value was exceptionally low. For example, if a new cryptocurrency increases by 1,000%, it sounds impressive. However, if it increased from $0.0001 to $0.0011, the actual value remains negligible.
Conversely, for a massive corporation like Apple or Microsoft, a “mere” 5% increase in annual revenue represents billions of dollars in new capital. When evaluating financial news or company reports, always look at the absolute numbers alongside the percentages to get a full picture of the scale.
Nominal vs. Real Growth: Accounting for Inflation
In the world of money, not all increases are “wins.” This is where the distinction between nominal and real growth becomes vital. A nominal increase is the raw percentage change. Real growth is the percentage increase adjusted for inflation.
If you received a 5% raise this year, but the Consumer Price Index (CPI) indicates that inflation is at 7%, your “real” income has actually decreased by 2%. Despite the numerical increase in your paycheck, your purchasing power has eroded. To be truly financially literate, you must subtract the inflation rate from your percentage increases to determine if you are actually moving forward or simply treading water.
Tools and Strategies for Continuous Financial Monitoring
In the modern digital age, you don’t need to carry a calculator everywhere to track your growth. Utilizing technology can automate these calculations, providing real-time insights into your financial status.
Leveraging Spreadsheets for Automation
Excel and Google Sheets are the gold standard for financial tracking. By setting up simple formulas, you can create a living dashboard of your net worth or business performance. Using a formula like =(B2-A2)/A2 (where A2 is last month’s balance and B2 is this month’s) allows you to see your growth instantly.
Advanced users can use “Conditional Formatting” to highlight cells in green when a percentage increase exceeds a certain goal (e.g., 10%) or red when it falls below a benchmark. This visual feedback loop is essential for staying disciplined with savings and investment goals.
Setting Benchmarks for Success
Finally, a percentage increase is most useful when compared against a benchmark. In personal finance, this might be the S&P 500 index. If your stock portfolio increased by 8% this year, that sounds great in isolation. However, if the S&P 500 increased by 15% in the same period, your “increase” actually indicates underperformance relative to a simple index fund.
By establishing these benchmarks, you can objectively evaluate whether your financial strategies—be it active trading, real estate, or business ventures—are worth the effort and risk.

Conclusion
Mastering how to work out a percentage increase is more than a lesson in arithmetic; it is the acquisition of a lens through which all financial activity can be clearly viewed. From the micro-level of a monthly budget to the macro-level of global market trends, percentages provide the context necessary to turn data into wisdom. By understanding the formula, applying it to your personal and professional life, and remaining wary of common misinterpretations like the base effect and inflation, you position yourself for long-term financial success and clarity.
aViewFromTheCave is a participant in the Amazon Services LLC Associates Program, an affiliate advertising program designed to provide a means for sites to earn advertising fees by advertising and linking to Amazon.com. Amazon, the Amazon logo, AmazonSupply, and the AmazonSupply logo are trademarks of Amazon.com, Inc. or its affiliates. As an Amazon Associate we earn affiliate commissions from qualifying purchases.