
The Consumer Price Index (CPI) is a critical economic indicator that gauges the average change over time in the prices paid by urban consumers for a market basket of consumer goods and services. It’s a fundamental tool for understanding inflation, adjusting wages and benefits, and informing economic policy. While the official CPI is calculated by government agencies, understanding its underlying principles and how to figure out CPI-related data is crucial for individuals and businesses alike, especially when making financial decisions. This article delves into the practicalities of understanding and interpreting CPI, focusing on its implications for personal finance, investing, and business operations.
Understanding the CPI Calculation: A Framework for Analysis
The Bureau of Labor Statistics (BLS) in the United States, and similar agencies in other countries, meticulously collect data to construct the CPI. While the exact methodologies are complex and involve sophisticated statistical models, grasping the core components provides a robust understanding of how it works. This knowledge empowers individuals to better interpret reported CPI figures and their potential impact on their financial lives.
The Market Basket: Representing Consumer Spending
The foundation of CPI calculation lies in defining a representative “market basket” of goods and services that consumers typically purchase. This basket is not static; it is periodically updated to reflect evolving consumption patterns. The BLS conducts extensive surveys, such as the Consumer Expenditure Survey, to identify the relative importance of different spending categories.
Food and Beverages
This category encompasses a wide range of items, from groceries purchased for home consumption to meals eaten at restaurants. It’s further broken down into sub-categories like “cereals and bakery products,” “meats, poultry, fish, and eggs,” and “dairy and related products.” Fluctuations in the prices of these items can significantly impact the overall CPI, particularly for lower-income households where food expenditure constitutes a larger portion of their budget.
Housing
Housing costs are a major component of the CPI and are divided into two primary areas: shelter and utilities. Shelter includes rent for renters and the “owners’ equivalent rent” (OER) for homeowners, which estimates the change in the cost of owning a home. Utilities encompass electricity, natural gas, and water and sewer services. Changes in housing prices and energy costs are often significant drivers of inflation.
Apparel
This category covers the cost of clothing and footwear for men, women, and children. While historically a larger component of consumer budgets, its relative importance has decreased due to factors like globalization and increased availability of affordable clothing.
Transportation
Transportation costs include a broad spectrum of expenses, such as new and used vehicles, motor fuel, vehicle maintenance and insurance, and public transportation fares. The price of gasoline, in particular, is a highly volatile component and can exert considerable influence on the monthly CPI.
Medical Care
This segment includes expenditures on health insurance, medical services (physician visits, hospital stays), prescription drugs, and medical supplies. The rising cost of healthcare is a persistent concern, and its trends are closely monitored within the CPI.
Recreation
The recreation category covers a diverse array of goods and services, including televisions, computers, sporting goods, pets, and admissions to entertainment venues. Changes in the cost of these items reflect shifts in consumer demand and technological advancements.
Education and Communication
This category includes expenses related to schooling, such as tuition and fees, as well as communication services like internet access, telephone services, and postage. The increasing reliance on technology for education and communication makes these components important to track.
Other Goods and Services
This residual category captures a variety of items not accounted for in the preceding categories, such as tobacco products, personal care services, and financial services.
Price Data Collection: The Eyes and Ears of the CPI
To accurately reflect price changes, the BLS employs a dedicated team of data collectors who visit thousands of retail stores, service establishments, rental units, and doctors’ offices across the country. They record the prices of hundreds of specific goods and services within each category of the market basket. This rigorous data collection process ensures that the CPI reflects real-world price movements.
Sampling Methodology
The selection of outlets and the specific items priced within those outlets are determined through a carefully designed sampling methodology. This ensures that the collected data is representative of the broader consumer market. For instance, when pricing a product like a television, collectors might specify certain brands, models, and features to ensure consistent comparisons over time.
Data Verification and Quality Control
Extensive quality control measures are in place to ensure the accuracy and reliability of the collected price data. This includes verifying the accuracy of reported prices, identifying and correcting errors, and ensuring that price changes are due to genuine shifts in the market rather than changes in product quality or specifications.
Interpreting CPI Data: From Raw Numbers to Financial Insights
Once the price data is collected and aggregated, it is used to calculate the CPI. Understanding how to interpret this data is crucial for making informed financial decisions. The CPI is typically reported as an index number and as a percentage change, indicating inflation or deflation.
The CPI Index: A Baseline for Comparison
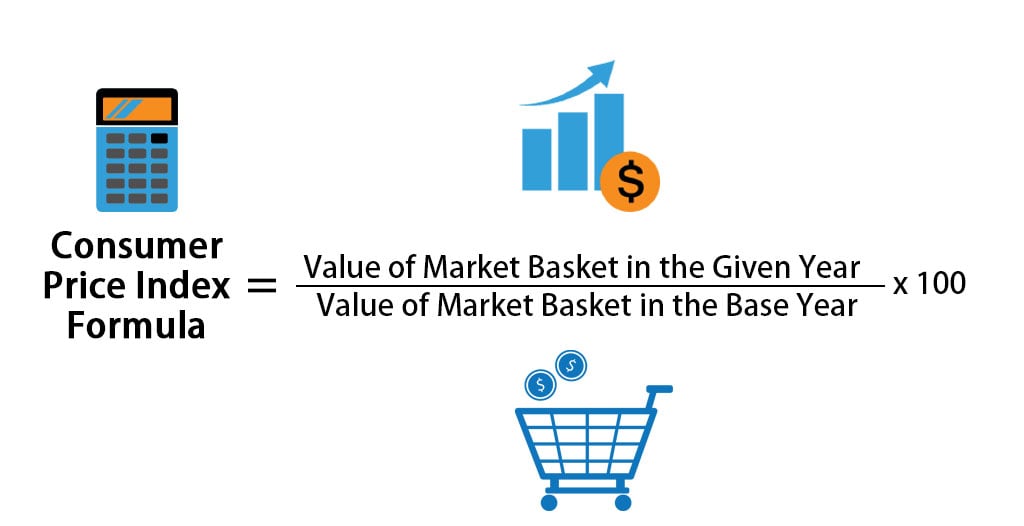
The CPI is typically presented as an index number, with a base year set to 100. For example, if the CPI for a particular month is 110, it means that prices have increased by 10% since the base year. This index allows for easy comparison of price levels over extended periods.
Understanding the Base Year
The choice of base year is important. It serves as a reference point against which all other periods are compared. When the BLS updates the CPI’s market basket and relative weights, it also typically updates the base year to ensure the index remains relevant.
Calculating Price Changes Using the Index
To calculate the percentage change in prices between two periods, you can use the following formula:
Percentage Change = [(CPI in Period 2 – CPI in Period 1) / CPI in Period 1] * 100
For instance, if the CPI was 250 in December and 255 in January, the monthly inflation rate would be [(255 – 250) / 250] * 100 = 2%.
Inflation and Deflation: The Economic Implications

The CPI is most commonly used to measure inflation, which is a general increase in the prices of goods and services. Conversely, deflation is a general decrease in prices. Understanding the magnitude and direction of these changes is vital for economic planning.
Annual Inflation Rate
The annual inflation rate, usually calculated by comparing the CPI of the current month to the CPI of the same month in the previous year, is a key indicator of economic health. High inflation can erode purchasing power, while persistent deflation can signal economic weakness.
Core Inflation: Excluding Volatile Components
To get a clearer picture of underlying inflation trends, economists often look at “core inflation.” This measure excludes volatile components like food and energy prices, which can fluctuate significantly due to temporary factors. Core inflation provides a more stable indicator of the general price level.
Practical Applications of CPI in Personal Finance and Business
The CPI has far-reaching implications for individuals and businesses. From adjusting salaries to setting prices, understanding how CPI affects financial decisions is essential.
Personal Finance: Protecting Your Purchasing Power
For individuals, understanding CPI is crucial for managing their personal finances effectively and ensuring their savings and income keep pace with rising costs.
Wage Adjustments and Cost-of-Living Allowances (COLAs)
Many employment contracts and government benefits include Cost-of-Living Adjustments (COLAs) that are tied to the CPI. These adjustments are designed to maintain the real value of wages and benefits by increasing them in line with inflation. If your salary is not keeping pace with CPI, your real purchasing power is declining.
Budgeting and Financial Planning
When creating budgets and long-term financial plans, it’s essential to factor in expected inflation as measured by the CPI. This helps in setting realistic savings goals, estimating future expenses, and ensuring adequate funds for retirement. For example, if you anticipate a 3% annual inflation rate, you’ll need to save more to maintain the same lifestyle in retirement.
Investment Decisions
Inflation erodes the real return on investments. Investors must consider the impact of inflation when choosing investment vehicles. Investments that historically outperform inflation, such as stocks and real estate, are often favored during periods of rising prices. Conversely, fixed-income investments like bonds can lose value in real terms if their yield is lower than the inflation rate.
Business Finance: Strategic Pricing and Operational Adjustments
Businesses use CPI data to make informed decisions regarding pricing, cost management, and strategic planning.
Pricing Strategies
Businesses often benchmark their pricing strategies against CPI trends. If their costs are rising faster than the general inflation rate, they may need to increase their prices to maintain profitability. Conversely, if their costs are rising slower, they might have opportunities to adjust prices to gain market share.
Cost Management and Forecasting
Understanding CPI helps businesses forecast future input costs, such as raw materials, labor, and energy. This information is vital for effective inventory management, production planning, and negotiating supplier contracts. Businesses that can accurately forecast cost increases can better prepare for them.
Economic Forecasting and Strategic Planning
For businesses, the CPI is a key component of broader economic forecasting. By analyzing CPI trends, businesses can anticipate changes in consumer spending, assess market demand, and make strategic decisions about expansion, investment, and product development. A consistent upward trend in CPI might signal a need to focus on cost-saving measures and value-oriented product offerings.
Beyond the Headline Number: Advanced CPI Considerations
While the headline CPI provides a broad overview of inflation, a deeper understanding involves looking at more granular data and understanding the nuances of its calculation and application.
Regional CPI Data: Localized Inflation Impacts
The BLS also publishes regional CPI data, which can differ significantly from the national average. This is because price levels and consumption patterns vary geographically. For example, housing costs in major metropolitan areas are often much higher than in rural regions, leading to different inflation experiences.
Understanding Regional Variations
When making decisions related to cost of living, such as relocation or setting regional salaries, it’s crucial to consult the relevant regional CPI data. This provides a more accurate reflection of price changes in a specific area.
Impact on Local Businesses
Local businesses must also consider regional CPI data. If inflation in their specific region is higher than the national average, they may face increased pressure to raise wages and adjust their pricing accordingly.
The Limitations of CPI: What It Doesn’t Tell You
It’s important to acknowledge that the CPI, while a powerful tool, has its limitations. Understanding these limitations helps in interpreting the data critically.
Substitution Bias
The CPI assumes a fixed basket of goods and services. In reality, consumers tend to substitute away from goods that become relatively more expensive. The CPI may not fully capture this substitution effect, potentially overstating inflation.
Quality Changes
It’s challenging to perfectly account for changes in the quality of goods and services over time. Improvements in technology or product features can mean consumers are getting more value for their money, even if the price hasn’t changed significantly. The BLS attempts to make quality adjustments, but it remains a complex area.
New Products
The CPI basket is updated periodically, but there can be a lag before new and innovative products are incorporated. This means that the CPI might not fully reflect the impact of new technologies or goods that can improve consumers’ well-being or reduce their costs.
By understanding the intricacies of CPI calculation, its practical applications, and its inherent limitations, individuals and businesses can better navigate the complexities of a fluctuating economic landscape and make more informed financial decisions. Whether it’s protecting your savings from inflation or strategizing for your business’s future, a firm grasp of how to figure out CPI is an invaluable asset.
aViewFromTheCave is a participant in the Amazon Services LLC Associates Program, an affiliate advertising program designed to provide a means for sites to earn advertising fees by advertising and linking to Amazon.com. Amazon, the Amazon logo, AmazonSupply, and the AmazonSupply logo are trademarks of Amazon.com, Inc. or its affiliates. As an Amazon Associate we earn affiliate commissions from qualifying purchases.