Inflation, a persistent and often concerning economic phenomenon, is the rate at which the general level of prices for goods and services is rising, and subsequently, purchasing power is falling. Understanding how inflation is calculated is not merely an academic exercise; it’s fundamental for consumers making budgeting decisions, investors navigating financial markets, and policymakers shaping economic strategies. While the concept of rising prices might seem straightforward, the precise measurement of inflation involves complex statistical methodologies and a careful consideration of what is being measured.
At its core, calculating inflation relies on tracking the changes in the prices of a broad basket of goods and services over time. However, the devil is in the details: how is this basket defined? Which prices are included? How are different goods and services weighted? These are the questions that statisticians and economists grapple with to produce the inflation figures that are widely reported and relied upon. The primary tools for this measurement are price indexes, which provide a snapshot of price levels at a given point in time relative to a base period.
The most prominent inflation measures in many developed economies are the Consumer Price Index (CPI) and the Producer Price Index (PPI). While both track price changes, they focus on different segments of the economy. The CPI aims to capture the average change over time in the prices paid by urban consumers for a market basket of consumer goods and services. The PPI, on the other hand, measures the average change over time in the selling prices received by domestic producers for their output. Understanding the distinctions between these indexes, as well as the methodologies behind their construction, is crucial for a comprehensive grasp of inflation’s calculation.
The Foundation: What is Measured?
The accurate calculation of inflation hinges on defining and consistently measuring the prices of a representative basket of goods and services. This “basket” is not static; it evolves to reflect changing consumption patterns and the introduction of new products. The selection and weighting of these items are critical to ensuring that the inflation measure accurately reflects the economic reality faced by consumers and businesses.
Defining the Market Basket
The “market basket” is the cornerstone of inflation calculation. It’s a hypothetical collection of goods and services that represents the typical purchases of a specific population group. For consumer inflation, this basket includes a wide array of items, from essential foodstuffs and housing costs to transportation, healthcare, education, and entertainment. The specific composition of this basket is determined through extensive consumer expenditure surveys. These surveys gather data on how households spend their income, allowing statisticians to identify which goods and services are most commonly purchased and in what quantities.
For instance, the U.S. Bureau of Labor Statistics (BLS), which calculates the CPI, conducts the Consumer Expenditure Survey to determine the relative importance of different goods and services in the average consumer’s budget. This ensures that the prices of items that make up a larger portion of household spending have a greater impact on the overall inflation rate than those that represent a smaller share. A significant increase in the price of rent, which constitutes a substantial part of many households’ budgets, will therefore have a more pronounced effect on the CPI than a small increase in the price of a niche electronic gadget.
Price Data Collection
Once the market basket is defined, the next crucial step is collecting price data for each item within it. This is a monumental and ongoing task. Price collectors, either in person, by phone, or through online methods, gather price information for thousands of specific goods and services across numerous retail outlets and service providers in various geographic locations. For example, to track the price of a loaf of bread, price collectors might visit multiple supermarkets in different cities, noting the price of a specific brand and size of bread. Similarly, the cost of a doctor’s visit, a gallon of gasoline, or a movie ticket would be meticulously recorded.
The frequency of price collection varies depending on the item. More volatile goods, like gasoline or fresh produce, might have their prices collected daily or weekly, while less volatile items, such as rent or tuition fees, might be collected monthly or quarterly. Consistency in data collection is paramount. Price collectors are trained to record prices under comparable conditions – for example, noting the price for the same size and brand of an item, excluding sales tax unless it’s a regular component of the price, and recording prices at the same time of day or week. This rigorous data collection process forms the raw material from which inflation indexes are constructed.
Weighting and Index Construction
The prices collected are then used to construct a price index. This involves assigning a “weight” to each item or category in the market basket, reflecting its relative importance in overall consumer spending. As mentioned, these weights are derived from the expenditure surveys. For example, if housing costs represent 30% of a typical household’s expenditure, then the price changes in housing will carry a weight of 0.30 in the CPI calculation.
A price index is typically calculated relative to a base period, which is assigned a value of 100. For instance, if the base period is 1982-1984, and the index value for a particular month is 250, it means that prices have risen by 150% since the base period (250 – 100 = 150). The formula for calculating the index for a given period is essentially the current cost of the market basket divided by the cost of the market basket in the base period, multiplied by 100.
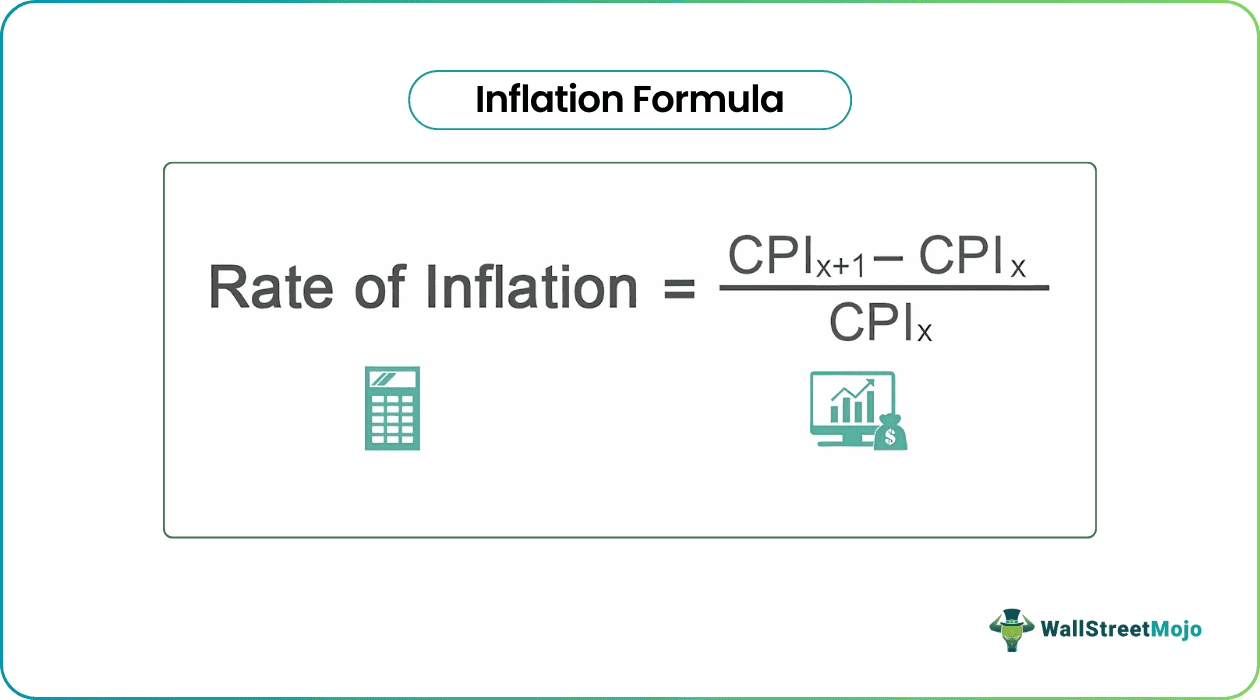
The inflation rate between two periods is then calculated as the percentage change in the price index. For example, if the CPI was 250 in one month and 255 in the next, the monthly inflation rate would be ((255 – 250) / 250) * 100 = 2%. This systematic approach ensures that the inflation figure is not just a reflection of random price fluctuations but a statistically robust measure of the broad trend in prices.
Key Inflation Measures
While the general principle of calculating inflation remains consistent, different economic indicators are used to track price changes for various purposes. The Consumer Price Index (CPI) and the Producer Price Index (PPI) are two of the most widely cited and influential measures. Understanding their nuances and how they are calculated provides a clearer picture of the inflationary pressures within an economy.
The Consumer Price Index (CPI)
The Consumer Price Index (CPI) is arguably the most familiar measure of inflation. It tracks the average change over time in the prices paid by urban consumers for a fixed market basket of consumer goods and services. The CPI is designed to reflect the cost of living for households, making it a crucial indicator for wage adjustments (through cost-of-living adjustments or COLAs), social security benefits, and economic policy decisions.
There are different versions of the CPI. In the United States, for instance, the CPI-U (Consumer Price Index for All Urban Consumers) is the most commonly reported. There is also the CPI-W (Consumer Price Index for Urban Wage Earners and Clerical Workers), which focuses on a specific segment of the population. The market basket for the CPI includes around 80,000 items, covering categories such as food and beverages, housing, apparel, transportation, medical care, recreation, education and communication, and other goods and services.
The calculation of the CPI involves several steps. First, extensive price data is collected from thousands of retail outlets in hundreds of urban areas. This data is then aggregated and weighted according to the relative importance of each item in the consumer’s budget, as determined by the Consumer Expenditure Survey. The index is then computed by comparing the current cost of this weighted basket to its cost in the base period. The percentage change in the index from one period to the next represents the inflation rate for consumers.
The Producer Price Index (PPI)
While the CPI focuses on what consumers pay, the Producer Price Index (PPI) measures the average change over time in the selling prices received by domestic producers for their output. The PPI tracks price changes from the perspective of the seller, not the buyer. It encompasses prices for a wide range of goods, services, and construction.
The PPI is often considered a leading indicator of inflation. Changes in producer prices can, over time, be passed on to consumers in the form of higher prices for finished goods. For example, an increase in the price of steel for manufacturers could eventually lead to higher prices for automobiles or appliances. The PPI also provides insights into the cost pressures faced by businesses.
The PPI is calculated using price data collected directly from producing establishments. The basket for the PPI is structured differently from the CPI, reflecting the stages of production. There are indexes for crude goods, intermediate goods, and finished goods. Services also form a significant part of the PPI. Like the CPI, the PPI uses a system of weights based on the value of production to ensure that the prices of more significant sectors have a greater influence on the overall index. The calculation process is similar to the CPI, involving price collection, weighting, and the computation of an index relative to a base period.
Core Inflation vs. Headline Inflation

When discussing inflation, you will often hear the terms “headline inflation” and “core inflation.” These are important distinctions that help in analyzing underlying price trends.
Headline Inflation refers to the total inflation rate, which includes all items in the market basket. This is the most commonly reported inflation figure. For example, the overall CPI number is headline inflation. While it provides a comprehensive picture, it can be volatile due to fluctuations in the prices of certain goods, particularly energy and food, which are subject to seasonal and global supply-and-demand shocks.
Core Inflation, on the other hand, is a measure of inflation that excludes the prices of volatile categories, most notably food and energy. The rationale behind excluding these items is to provide a clearer view of the underlying, persistent inflationary pressures in the economy. For instance, a temporary surge in oil prices due to geopolitical events might temporarily inflate the headline CPI, but core inflation would remain unaffected, indicating that the broader trend of price increases in other sectors is more stable.
Economists and central banks often look at core inflation as a better indicator of long-term inflation trends and a more reliable guide for monetary policy decisions. If core inflation is rising steadily, it suggests that inflation is becoming embedded in the economy. Conversely, if core inflation is stable, it indicates that the price increases seen in headline inflation are likely temporary. The calculation of core inflation involves simply removing the price data for food and energy from the overall CPI or PPI basket before computing the index.
Factors Influencing Inflation Calculations
The accuracy and interpretation of inflation calculations are influenced by a variety of factors, ranging from the methodologies employed by statistical agencies to the inherent complexities of a dynamic economy. Understanding these influencing factors allows for a more nuanced appreciation of the inflation figures we encounter.
Adjustments for Quality and New Goods
One of the significant challenges in calculating inflation is accounting for changes in the quality of goods and services and the introduction of new products. As technology advances and production processes improve, the quality of many goods tends to increase over time. For example, a smartphone today offers vastly more functionality and processing power than a smartphone from a decade ago. If the price of a smartphone remains the same, but its quality has significantly improved, simply tracking the nominal price change would overstate inflation.
To address this, statistical agencies employ “quality adjustment” techniques. These methods attempt to isolate the pure price change from the change in the quality of the good or service. For instance, a portion of the price increase of a new smartphone might be attributed to its enhanced features, thereby reducing the measured inflation rate for that item. Similarly, when new goods enter the market, they are gradually incorporated into the market basket. This process, known as “substitution bias,” aims to ensure that the basket remains representative of consumer preferences and that the index doesn’t lag behind evolving consumption patterns.
Seasonality and Seasonal Adjustment
Many goods and services experience predictable price fluctuations throughout the year due to seasonal factors. For example, the prices of fresh produce are often lower in the summer when they are in season and higher in the winter. Airfares tend to be more expensive during holiday periods. If these seasonal variations are not accounted for, they can distort the month-to-month inflation figures, making it difficult to discern underlying trends.
To mitigate this, statistical agencies produce “seasonally adjusted” data. Seasonal adjustment is a statistical technique that removes predictable seasonal patterns from a time series. For example, if airfares typically rise by 20% in December compared to November, and the measured inflation shows a 1.5% increase in December, the seasonally adjusted figure would reflect the price change after removing that expected 20% seasonal jump. This allows for a clearer comparison of inflation rates across different months and provides a better understanding of the underlying inflationary momentum in the economy.
Geographic and Demographic Variations
It’s important to recognize that inflation doesn’t affect everyone uniformly. The cost of living can vary significantly depending on where you live and your demographic characteristics. For example, housing costs are typically much higher in major metropolitan areas than in rural regions. Similarly, the expenditure patterns of different demographic groups can vary. A young family with children might spend a larger proportion of their income on childcare and education than a retired couple.
While the headline CPI and PPI aim to provide national averages, statistical agencies often publish regional CPI data, which can highlight significant price differences across different geographic areas. Furthermore, while the main CPI is designed to represent a broad range of urban consumers, understanding how inflation impacts specific demographic groups or regions requires looking beyond the headline figures and potentially analyzing more granular data or specialized indexes. This acknowledges that a single inflation number may not perfectly capture the economic reality for every individual or household.
The Importance of Accurate Inflation Measurement
The calculation of inflation is far more than an academic exercise in statistical methodology; it has profound and far-reaching implications for individuals, businesses, and governments alike. Accurate inflation measurement is the bedrock upon which critical economic decisions are made, impacting everything from personal savings to national fiscal policy.
Impact on Purchasing Power and Cost of Living
At the most fundamental level, inflation directly erodes purchasing power. When prices rise, the same amount of money buys fewer goods and services. This means that individuals’ real incomes decline unless their nominal incomes increase at least at the rate of inflation. Accurate inflation calculations allow individuals to understand how their cost of living is changing and to make informed decisions about budgeting, saving, and spending. For instance, if inflation is running at 5%, and an individual’s income only increases by 2%, their real purchasing power has decreased. This understanding is crucial for maintaining financial well-being and making informed financial planning decisions, such as adjusting savings goals or seeking salary increases.
Role in Wage Negotiations and Benefits
Inflation plays a critical role in determining wages and benefits. Many employment contracts, union agreements, and government benefits, such as Social Security payments, are indexed to inflation. This means that wages and benefits are automatically adjusted upwards to compensate for the rising cost of living. The Consumer Price Index (CPI) is the primary measure used for these adjustments. If the CPI is calculated inaccurately, it can lead to either an undercompensation or overcompensation for the effects of inflation, impacting the real income of millions of people. For example, if inflation is underestimated, recipients of inflation-adjusted benefits will experience a decline in their real standard of living.
Guiding Monetary and Fiscal Policy
Central banks and governments rely heavily on inflation data to guide their monetary and fiscal policies. Central banks, like the Federal Reserve in the United States, often have a mandate to maintain price stability, which typically means keeping inflation at a low and predictable level. Inflation calculations help them assess whether their current policies are effective in achieving this goal. If inflation is too high, central banks might raise interest rates to slow down economic activity and curb price increases. Conversely, if inflation is too low or negative (deflation), they might lower interest rates to stimulate the economy.
Fiscal policy, which involves government spending and taxation, is also influenced by inflation. Governments need to understand inflation to forecast future government revenues and expenditures, particularly for programs that are sensitive to price changes. Accurate inflation data allows policymakers to make more informed decisions about managing the national debt, allocating resources, and ensuring the long-term health of the economy. Without reliable inflation metrics, economic policymaking would be akin to navigating without a compass.

Conclusion: The Continuous Quest for Accurate Measurement
The calculation of inflation is a complex, dynamic, and essential process. It involves carefully defining what is being measured, meticulously collecting vast amounts of price data, and applying sophisticated statistical techniques to transform this raw data into meaningful economic indicators. The Consumer Price Index (CPI) and the Producer Price Index (PPI), along with their various sub-measures like core inflation, serve as crucial thermometers for the health of an economy.
The challenges of accurately capturing price changes, especially in the face of evolving consumption patterns, quality improvements, and the introduction of new goods, mean that the methodologies for calculating inflation are constantly being refined. Statistical agencies around the world are engaged in a continuous quest to ensure that their inflation measures are as representative and accurate as possible.
Ultimately, understanding how inflation is calculated empowers individuals and informs the decisions of policymakers. It provides the necessary context for understanding the erosion of purchasing power, the fairness of wage and benefit adjustments, and the effectiveness of economic policies designed to foster stability and growth. In a world where prices are constantly in flux, the accurate measurement of inflation remains a cornerstone of sound economic understanding and prudent financial management.
aViewFromTheCave is a participant in the Amazon Services LLC Associates Program, an affiliate advertising program designed to provide a means for sites to earn advertising fees by advertising and linking to Amazon.com. Amazon, the Amazon logo, AmazonSupply, and the AmazonSupply logo are trademarks of Amazon.com, Inc. or its affiliates. As an Amazon Associate we earn affiliate commissions from qualifying purchases.