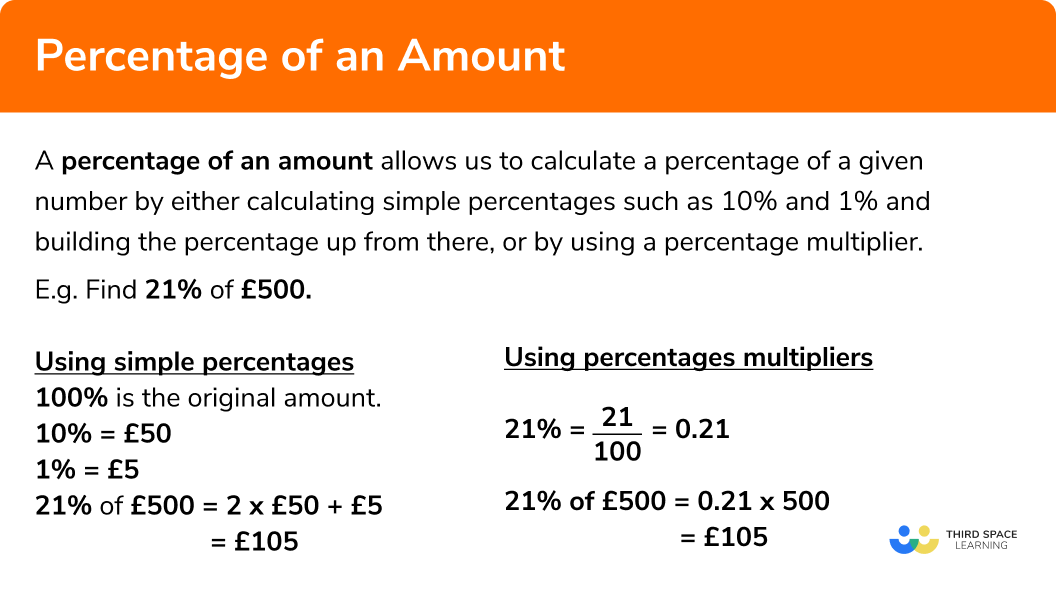
In the world of finance, numbers rarely exist in a vacuum. A figure like $10,000 might seem significant to a college student, yet it is a mere rounding error for a multinational corporation. To bring meaning to financial data, we must look at relationships. This is where the fundamental question arises: “What is the percentage of what?”
Whether you are managing a household budget, evaluating a stock portfolio, or running a high-growth startup, understanding the relationship between two numbers—expressed as a percentage—is the key to making informed decisions. Percentages provide a standardized language that allows us to compare performance, assess risk, and project future growth across different scales and industries. This article explores the critical financial ratios and benchmarks where the “percentage of what” determines success or failure.
The Core of Investing: Calculating Return on Investment (ROI)
The most common application of percentages in the financial world is the Return on Investment (ROI). When an investor asks about the performance of an asset, they are asking for the percentage of profit relative to the initial capital invested.
Understanding the ROI Formula
At its simplest, ROI is calculated by taking the net profit of an investment, dividing it by the original cost, and multiplying by 100. For example, if you buy a stock for $1,000 and sell it for $1,200, your profit is $200. The “percentage of what” in this scenario is $200 (the gain) relative to $1,000 (the basis), resulting in a 20% ROI.
However, professional investors look deeper. They must account for the time horizon. A 20% return over one year is exceptional; a 20% return over ten years barely keeps pace with historical inflation. Therefore, the Annualized Return becomes the more vital percentage to track, allowing investors to compare the efficiency of different asset classes over identical time frames.
Nominal vs. Real Returns: Factoring in Inflation
A common trap in personal finance is focusing solely on nominal returns—the raw percentage increase in your account balance. To understand true wealth accumulation, one must subtract the inflation rate from the nominal return to find the “Real Return.”
If your high-yield savings account offers a 4% interest rate, but inflation is currently running at 3%, your real gain is only 1%. In this context, the “percentage of what” is the purchasing power of your money. If the percentage of inflation exceeds the percentage of your investment growth, you are effectively losing money, despite a rising balance.
Personal Finance Benchmarks: The “Percentage of What” for Budgeting
Managing personal wealth requires a constant evaluation of how income is distributed. Financial planners often use “percentage-based budgeting” to ensure that individuals are not overleveraged and are adequately preparing for the future.
The 50/30/20 Rule: Allocating Your Net Income
One of the most popular frameworks in personal finance is the 50/30/20 rule. This strategy suggests that 50% of your after-tax income should go toward “Needs” (housing, utilities, groceries), 30% toward “Wants” (dining out, hobbies, travel), and 20% toward “Savings and Debt Repayment.”
The genius of this rule lies in its scalability. As your income grows, the “what” (the total dollar amount of your paycheck) increases, but the percentages remain a guardrail for lifestyle creep. If you receive a raise and immediately increase your “Wants” to 40% of your income, you are compromising the 20% allocated for your future self. Success in personal finance is often less about how much you make and more about the percentage of what you keep.
Debt-to-Income Ratio: How Lenders View Your Stability
When you apply for a mortgage or an auto loan, lenders are not just looking at your credit score; they are looking at your Debt-to-Income (DTI) ratio. This is the percentage of your gross monthly income that goes toward paying debts.
Most lenders prefer a DTI ratio below 36%, with no more than 28% of that debt going toward mortgage or rent payments. If your DTI is too high, it indicates that a significant percentage of your “what” (income) is already spoken for, making you a higher risk for default. Understanding this percentage allows individuals to strategically pay down debt before seeking major financing.
Business Vitality: Profit Margins and Revenue Growth
For entrepreneurs and business leaders, the “percentage of what” is the ultimate measure of operational efficiency. A company can generate millions in revenue, but if its expenses are equally high, the business is a “hollow shell” with no real value.
Gross vs. Net Profit Margin: What They Reveal
Profit margins are perhaps the most scrutinized percentages in the business world.
- Gross Profit Margin: This is the percentage of revenue remaining after subtracting the Cost of Goods Sold (COGS). It measures the efficiency of production and pricing.
- Net Profit Margin: This is the “bottom line”—the percentage of revenue left after all operating expenses, taxes, and interest have been paid.
A software company might have a massive 80% gross margin because it costs very little to deliver code to an additional customer. However, if they spend heavily on marketing and research, their net margin might only be 10%. Conversely, a grocery store might operate on a razor-thin 2% net margin but succeed through massive volume. Knowing which percentage to optimize is the difference between a scaling business and a failing one.
Customer Acquisition Cost (CAC) vs. Lifetime Value (LTV)
In the modern digital economy, the relationship between CAC and LTV is the primary predictor of a company’s longevity. LTV represents the total revenue a business expects to earn from a single customer over time. CAC is the cost spent on marketing and sales to acquire that customer.
Investors typically look for an LTV that is at least 300% (or 3x) the CAC. If the percentage of what you spend to get a customer is too close to the percentage of what that customer pays you, the business model is unsustainable. By tracking these percentages, businesses can decide when to “step on the gas” with advertising or when to pivot their strategy.
Risk Management: Asset Allocation and Portfolio Diversification
In investing, the “percentage of what” also applies to how your total wealth is distributed across different categories. This is known as asset allocation, and it is the single most important factor in determining the volatility of your portfolio.
The Percentage of Equities vs. Bonds
The classic “60/40” portfolio—60% stocks and 40% bonds—was long considered the gold standard for balanced investing. The “what” is your total investable assets. By keeping 40% in bonds, you provide a cushion for the 60% in stocks, which are more volatile but offer higher growth potential.
As an investor ages, these percentages typically shift. A 25-year-old might have 90% of their “what” in equities because they have decades to recover from market downturns. A 65-year-old entering retirement might shift to 40% equities to protect their principal. The “percentage of what” in this context is a tool for managing the trade-off between growth and security.
Rebalancing Strategies for Long-Term Growth
Market movements naturally change your percentages over time. If the stock market has a stellar year, your 60/40 split might drift to 70/30. This means you are now more exposed to risk than you intended to be.
Financial discipline requires “rebalancing”—selling a portion of the outperforming asset (stocks) and buying more of the underperforming one (bonds) to return to your target percentages. This forced “buy low, sell high” strategy is one of the most effective ways to build long-term wealth without emotional interference.
The Impact of Compounding and Interest Rates
Finally, we must consider the percentage that acts as the “engine” of wealth: interest rates. In the world of debt and savings, the way a percentage is calculated can drastically change the outcome.
APR vs. APY: The Percentage Difference
When looking at credit cards or savings accounts, you will see two terms: Annual Percentage Rate (APR) and Annual Percentage Yield (APY).
- APR is the simple interest rate.
- APY includes the effect of compounding.
If you have a savings account with a 5% APR that compounds monthly, the APY is actually 5.11%. While 0.11% sounds negligible, when applied to a “what” of $100,000 over 20 years, it results in thousands of dollars in additional wealth. Understanding the “percentage of what” in terms of compounding frequency is essential for maximizing passive income.
The Rule of 72: Estimating Growth Timelines
The “Rule of 72” is a quick financial shorthand to understand the power of percentages. By dividing 72 by your annual interest rate, you can estimate how many years it will take for your money to double.
If you earn a 7% return, your money doubles in roughly 10.2 years. If you earn 10%, it doubles in 7.2 years. This simple math highlights how a small increase in the percentage of return can lead to a massive difference in the final “what”—your total net worth—over a lifetime of investing.
Conclusion
The question “What is the percentage of what?” is the foundation of financial literacy. It moves us away from looking at raw numbers in isolation and toward understanding the dynamics of growth, efficiency, and risk. By mastering these ratios—whether they are your profit margins, your debt-to-income ratio, or your asset allocation—you gain the clarity needed to navigate the complexities of the financial world with confidence. In the end, wealth is not just about the size of the “what,” but the intelligence behind the percentages that govern it.
aViewFromTheCave is a participant in the Amazon Services LLC Associates Program, an affiliate advertising program designed to provide a means for sites to earn advertising fees by advertising and linking to Amazon.com. Amazon, the Amazon logo, AmazonSupply, and the AmazonSupply logo are trademarks of Amazon.com, Inc. or its affiliates. As an Amazon Associate we earn affiliate commissions from qualifying purchases.