In the world of high finance, the question “What did the S&P do today?” is more than just a casual inquiry; it is a fundamental pulse check on the health of the American economy. The Standard & Poor’s 500, or simply the S&P 500, represents approximately 80% of the available market capitalization of the U.S. stock market. When an investor asks about its daily movement, they are seeking to understand the collective sentiment of thousands of institutional players, millions of retail traders, and the overarching direction of global capital.
Understanding daily fluctuations requires looking beyond a single green or red percentage. It involves dissecting the macro-economic catalysts, the sectoral shifts, and the psychological underpinnings that drive price action. For the disciplined investor, “today’s” performance is a single data point in a much larger narrative of wealth creation and risk management.
Analyzing the Macro Drivers Behind Daily Market Movement
The daily movement of the S&P 500 is rarely random. It is usually a response to a constant stream of information that the market must “price in” in real-time. To understand what the index did today, one must first look at the economic calendar and the prevailing narrative of the week.
The Role of Central Bank Policy and Interest Rates
One of the most potent drivers of the S&P 500’s daily performance is the Federal Reserve. Investors hang on every word of the Fed Chair, looking for signals regarding interest rate hikes or cuts. When interest rates rise, the cost of borrowing increases for corporations, potentially squeezing profit margins. Conversely, a “dovish” stance often leads to a rally. If the S&P 500 moved significantly today, there is a high probability that a Fed official spoke or an economic report—such as the Consumer Price Index (CPI) or employment data—was released, influencing expectations for future rate paths.
Corporate Earnings and Fundamental Health
The S&P 500 is an index of companies, and companies are valued based on their ability to generate profit. During “earnings season,” the daily movement of the index is heavily dictated by the financial reports of its largest constituents. Because the S&P 500 is market-capitalization-weighted, the performance of “mega-cap” tech stocks can disproportionately move the entire index. If a major tech leader reports stellar earnings, it can drag the entire index upward, even if the majority of the other 499 stocks are trading flat or down.
Geopolitical Events and Global Sentiment
In an interconnected global economy, events occurring thousands of miles away can dictate what the S&P 500 does today. Trade tensions, conflicts in energy-producing regions, or economic instability in major trading partners like the Eurozone or China can trigger a “risk-off” environment. On such days, investors may flee equities for the safety of bonds or gold, leading to a dip in the index regardless of domestic corporate performance.
Sector Rotation: Who Led and Who Lagged?
The S&P 500 is comprised of 11 different sectors, including Technology, Healthcare, Financials, and Energy. Understanding the day’s movement requires a look at which of these sectors were the engines of growth and which were the anchors.
Cyclical vs. Defensive Performance
On a day when the economy feels robust, “cyclical” sectors—those that rely on discretionary spending and economic growth, like Industrials and Consumer Discretionary—tend to outperform. However, on days marked by uncertainty or recessionary fears, the S&P 500 may be propped up by “defensive” sectors. These include Utilities and Consumer Staples, which provide products and services people need regardless of the economic climate. Observing this internal “sector rotation” provides clues about what institutional investors are bracing for in the coming months.
The Influence of the “Magnificent Seven”
In recent years, the concentration of the S&P 500 has become a major talking point. A small group of high-growth technology companies—often referred to as the Magnificent Seven—now commands a massive percentage of the index’s total weight. When analyzing what the S&P did today, it is essential to check if the movement was broad-based or if it was driven solely by a handful of tech giants. A “healthy” market day is typically characterized by high “breadth,” meaning a large majority of stocks across various sectors are participating in the move.
Energy and Commodity-Linked Fluctuations
The Energy sector often moves independently of the broader tech-heavy index, dictated instead by the fluctuations in crude oil and natural gas prices. On days when energy prices spike, the S&P 500 may see a divergence where the broader market struggles due to fears of rising inflation, while the Energy sector hits new highs. This tug-of-war is a common feature of daily market volatility.
Decoding Market Sentiment and Volatility
Numbers alone don’t tell the whole story. To truly understand what the S&P 500 did today, an investor must look at the way it moved—the velocity and the volume of the trades.
The VIX: The Market’s “Fear Gauge”
The CBOE Volatility Index, or VIX, is a real-time market index that represents the market’s expectation of 30-day forward-looking volatility. It is derived from the prices of S&P 500 index options. If the S&P 500 was down today and the VIX spiked, it indicates a high level of fear and uncertainty among investors. If the index was down but the VIX remained calm, it suggests a controlled “pullback” or profit-taking rather than a panic-driven sell-off.
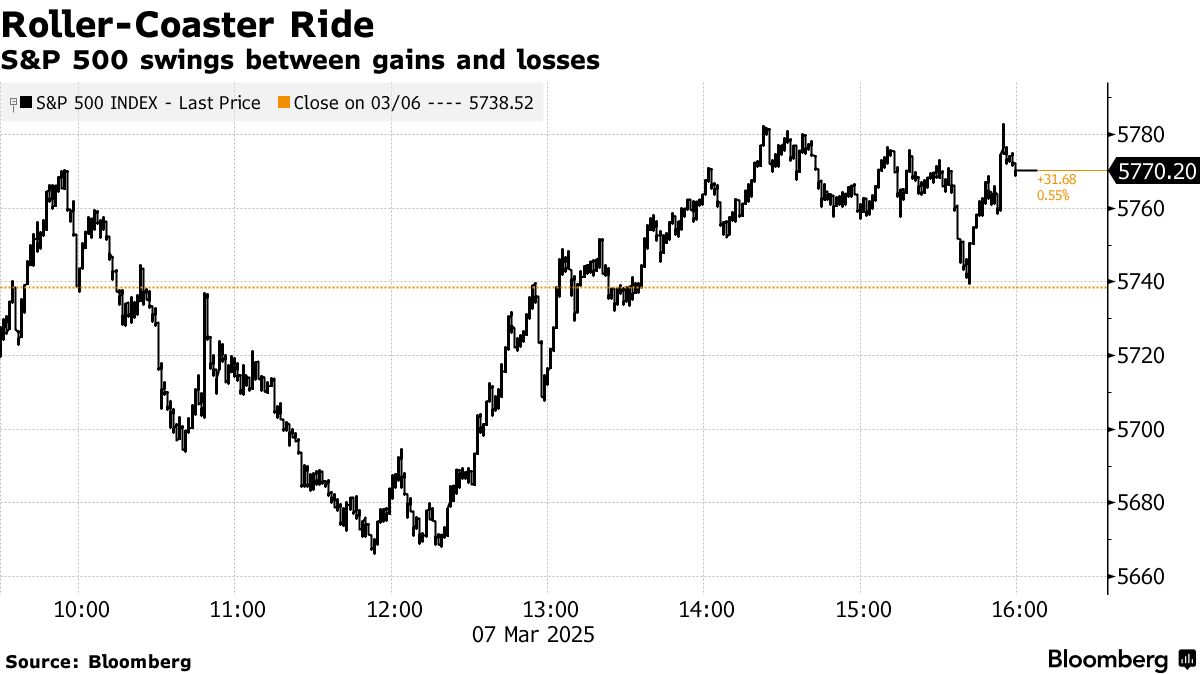
Institutional vs. Retail Trading Patterns
Modern markets are a blend of high-frequency algorithmic trading and human decision-making. Often, what the S&P 500 does in the final hour of trading—the “Power Hour”—reveals the true conviction of institutional investors. Large pension funds and hedge funds often execute their largest trades near the close. A “late-day rally” is usually seen as a bullish sign for the following day, whereas a “late-day fade” suggests that investors are hesitant to hold positions overnight.
The Impact of Technical Levels
Traders often watch specific price levels, such as the 50-day or 200-day moving averages. If the S&P 500 “bounces” off one of these levels today, it signifies that technical buyers are stepping in to support the market. Conversely, “breaking” below a key support level can trigger automated sell orders, accelerating a decline. Understanding these technical “battlegrounds” helps explain why the index might have stopped falling or rising at a specific price point.
How to React (or Not React) to Daily Fluctuations
For the individual investor, the daily noise of the S&P 500 can be overwhelming. Developing a strategy for how to interpret these movements is crucial for long-term financial success.
The Pitfalls of Market Timing
One of the most dangerous reactions to what the S&P 500 did today is the urge to “time the market.” Trying to jump in at the bottom and out at the top is a strategy that even professional fund managers struggle to execute consistently. Studies have shown that missing just a few of the market’s best days—which often occur immediately following the worst days—can drastically reduce long-term returns. For most, the best response to a volatile day is to stick to a pre-determined investment plan.
Using Volatility as an Opportunity
For those who practice Dollar Cost Averaging (DCA), a “bad” day for the S&P 500 is actually an opportunity. When the index drops, your scheduled investment buys more shares at a lower price. Over decades, this lowers your average cost basis and accelerates wealth accumulation. Instead of viewing a daily drop as a loss of wealth, savvy investors view it as the market going “on sale.”
Reassessing Risk Tolerance
While you shouldn’t react impulsively to daily changes, a particularly volatile day can serve as a “stress test” for your portfolio. If what the S&P 500 did today kept you awake at night or caused genuine emotional distress, it may be a sign that your portfolio is too aggressive for your actual risk tolerance. This is a moment to consult with a financial advisor to see if your asset allocation—perhaps the balance between stocks and bonds—needs a strategic adjustment.
The Long-Term Perspective: Signal vs. Noise
In the grand scheme of a 20 or 30-year investment horizon, what the S&P 500 did today is rarely more than “noise.” However, understanding that noise helps investors stay the course.
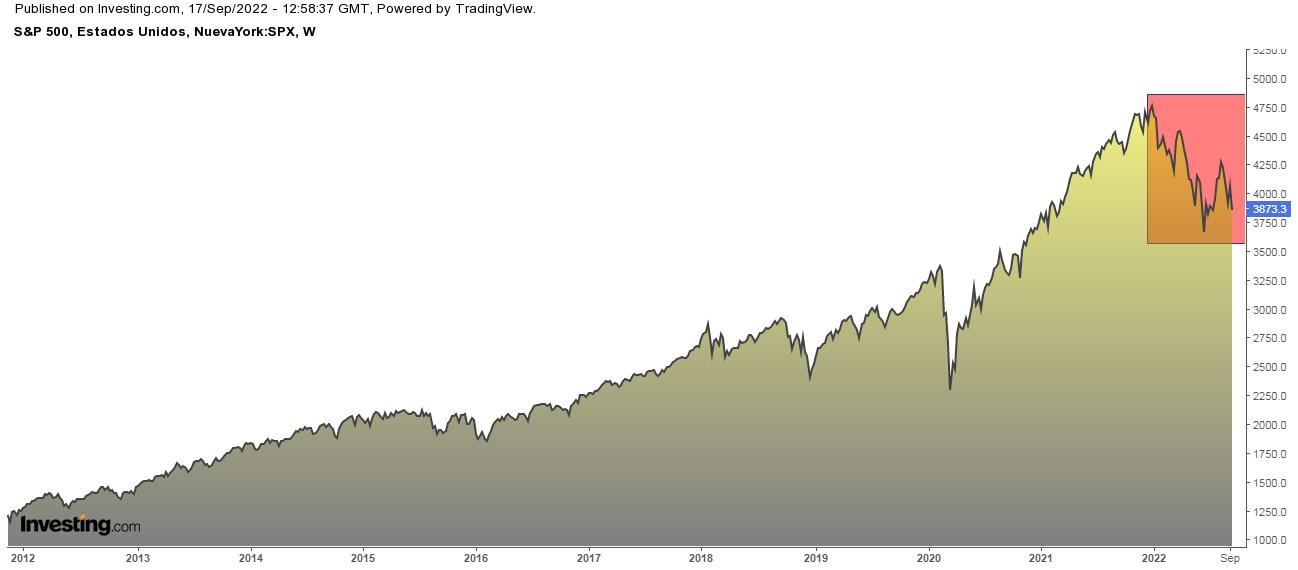
The Power of Compounding
The S&P 500 has historically provided an average annual return of roughly 10% before inflation. This return isn’t delivered in a straight line; it is the result of thousands of days of ups and downs. By understanding the factors that moved the market today—whether it was a Fed announcement, a tech earnings beat, or a geopolitical tremor—investors can demystify the process and avoid the emotional pitfalls that lead to poor financial decisions.

Staying Informed without Being Influenced
Being an informed investor means knowing what happened in the markets without letting it dictate your mood or your lifestyle. The S&P 500 is a tool for wealth creation, not a scoreboard for your self-worth. By analyzing the day’s performance through the lens of macroeconomics, sector health, and market psychology, you transform from a passive observer into a strategic participant in the global economy.
In conclusion, when we ask “what did the S&P do today,” we are looking at a snapshot of human progress, corporate innovation, and economic tension. Whether the index finished in the green or the red, the most important takeaway is always the same: the market is a forward-looking machine, and your success depends far more on your time in the market than your ability to predict any single day’s outcome.
aViewFromTheCave is a participant in the Amazon Services LLC Associates Program, an affiliate advertising program designed to provide a means for sites to earn advertising fees by advertising and linking to Amazon.com. Amazon, the Amazon logo, AmazonSupply, and the AmazonSupply logo are trademarks of Amazon.com, Inc. or its affiliates. As an Amazon Associate we earn affiliate commissions from qualifying purchases.