
Social Security is often described as the bedrock of American retirement planning. For millions of workers, the Federal Insurance Contributions Act (FICA) taxes deducted from every paycheck are a long-term investment in their future financial security. However, as the economic landscape shifts and inflation remains a persistent concern, many individuals are asking a fundamental question: What does the Social Security Administration (SSA) actually payout in benefits per year, both in total and to the individual?
Understanding these figures is not just an exercise in macroeconomics; it is a vital component of personal finance. Whether you are decades away from retirement or currently navigating your golden years, grasping the scale of the SSA’s annual expenditures and the mechanics of individual payouts is essential for building a robust financial strategy.
The Massive Scale of Social Security Payouts
The Social Security Administration manages one of the largest government programs in the world. The sheer volume of money moved through the SSA annually is staggering, reflecting the program’s role as the primary safety net for retirees, the disabled, and the families of deceased workers.
Total Annual Expenditure and the Federal Budget
In recent fiscal years, the SSA has paid out well over $1 trillion in benefits annually. As of the mid-2020s, that figure has climbed toward $1.5 trillion. To put this into perspective, Social Security expenditures typically account for about 5% of the U.S. Gross Domestic Product (GDP).
The vast majority of these funds—roughly 80%—are directed toward Old-Age and Survivors Insurance (OASI), which covers retirees and their families. The remaining portion is allocated to Disability Insurance (DI). For investors and taxpayers, these numbers represent the largest single slice of the federal budget, highlighting the program’s systemic importance to the national economy.
The Growing Beneficiary Population
The annual payout continues to rise not just because of inflation, but because of demographics. Currently, more than 70 million Americans receive some form of Social Security benefit. This number is bolstered by the “Silver Tsunami”—the aging Baby Boomer generation. As roughly 10,000 people reach retirement age every day, the SSA must scale its annual payouts to accommodate a larger pool of recipients. This demographic shift is a primary driver behind the annual increases in total program costs, necessitating a deep look into how these benefits are structured for the individual.
Breaking Down Individual Benefit Amounts
While the trillion-dollar “big picture” is important for policy, most people care more about the “small picture”: how much will arrive in their bank account? The answer varies significantly based on earnings history, the age at which one begins collecting, and the type of benefit received.
Average Monthly and Yearly Payments for Retirees
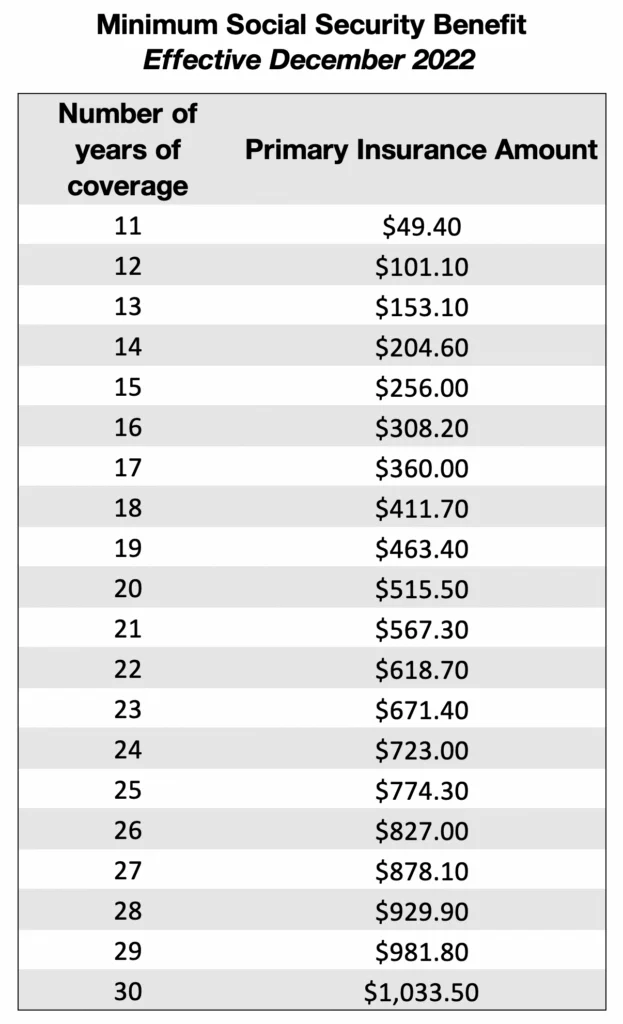
As of 2024, the average monthly Social Security benefit for a retired worker is approximately $1,900. On an annual basis, this translates to roughly $22,800. While this is a significant sum, it is rarely enough to cover all living expenses in most parts of the United States.
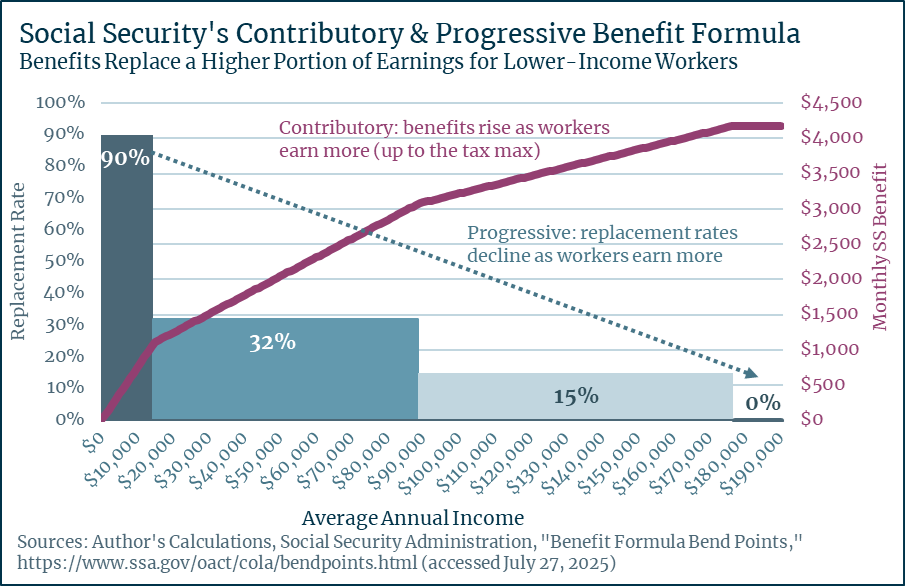
From a personal finance perspective, this average serves as a “floor” for retirement planning. It is designed to replace about 40% of the average worker’s pre-retirement income. High earners will find that Social Security replaces a smaller percentage of their income, while lower earners may find it replaces a larger portion.
Maximum Benefit Caps and How to Reach Them
For those who have been high earners throughout their careers, the SSA offers a “Maximum Benefit.” To achieve this, a worker must have earned at least the maximum taxable earnings limit (which adjusts annually) for at least 35 years of their working life.
Furthermore, the age at which you claim determines the cap. For someone retiring at the Full Retirement Age (FRA) in 2024, the maximum monthly benefit is approximately $3,822. However, for those who exercise financial patience and wait until age 70 to claim, the maximum benefit jumps significantly to over $4,800 per month, or nearly $58,000 per year. This highlights the “Money” aspect of Social Security: it is a flexible financial tool that rewards delayed gratification.
Disability and Survivor Benefit Averages
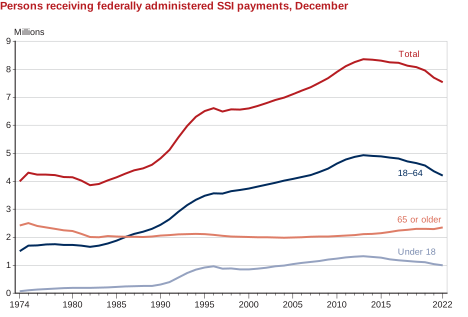
Social Security is not exclusively for the elderly. The SSA also pays out billions annually in Social Security Disability Insurance (SSDI) and survivor benefits. The average SSDI payment is generally lower than the retirement average, often hovering around $1,500 per month. Survivor benefits—paid to widows, widowers, and children of deceased workers—also play a critical role in family financial security, providing an average of $1,500 to $1,700 per month depending on the worker’s previous earnings.
Factors That Determine the Annual Payout Fluctuations
The amount the SSA pays out per year is not static. It is subject to legislative rules and economic indicators that ensure the purchasing power of the benefits does not erode over time.
The Role of COLA (Cost of Living Adjustments)
Perhaps the most important factor in the annual change of SSA payouts is the Cost of Living Adjustment, or COLA. Based on the Consumer Price Index for Urban Wage Earners and Clerical Workers (CPI-W), the SSA calculates an annual increase to keep pace with inflation.
In years of high inflation, such as 2023, the COLA can be as high as 8.7%. In more stable years, like 2024, it may be a more modest 3.2%. For a retiree, these adjustments are the difference between maintaining their lifestyle and falling behind as the price of goods and services rises. From a wealth management perspective, the COLA is a unique feature of Social Security—few private annuities or pensions offer a guaranteed, inflation-adjusted lifetime income stream.
Full Retirement Age (FRA) and Its Financial Impact
The year you were born dictates your Full Retirement Age, which for most current workers is 67. The SSA’s annual payout to an individual is penalized if they claim early (as early as 62) and incentivized if they claim late.
Choosing to take benefits at 62 results in a permanent reduction of about 30% compared to the amount you would receive at age 67. Conversely, every year you wait past your FRA adds an 8% “delayed retirement credit” to your annual payout. This 8% guaranteed return is virtually unmatched in the low-risk investment world, making the timing of SSA claims one of the most important financial decisions a person can make.
The Role of SSA Benefits in Your Personal Finance Strategy
Viewing Social Security as your only source of income is a recipe for financial hardship. Instead, it should be viewed as one of three “legs” of the retirement stool, alongside personal savings (401ks/IRAs) and private pensions or home equity.
Bridging the Gap: Social Security vs. Personal Savings
Because the SSA payouts average around $23,000 a year, most retirees face a “retirement gap.” If your desired lifestyle costs $60,000 a year, you need to generate $37,000 from other sources.
Sophisticated financial planning involves using the SSA payout as the “fixed” portion of your portfolio. This allows you to be slightly more aggressive with your personal investments, such as stocks or real estate, knowing that the SSA provides a steady, inflation-indexed floor that will never run out, regardless of market volatility.
Tax Implications of Social Security Benefits
A common misconception is that Social Security benefits are tax-free. In reality, the “Money” side of the equation is more complex. Depending on your “provisional income” (which includes half of your Social Security benefits plus your other taxable income and tax-exempt interest), you may owe federal income taxes on up to 85% of your benefits.
If you are a high-net-worth individual with significant distributions from a traditional IRA or 401(k), your SSA payout may be diminished by the tax man. Strategic withdrawals from Roth accounts—which do not count toward the provisional income calculation—can help you keep more of your annual SSA payout.
Looking Ahead: The Future Stability of SSA Payouts
No discussion of what the SSA pays out is complete without addressing the long-term solvency of the program. This is a frequent topic of concern in the world of business finance and personal investing.
The Trust Fund Outlook and Legislative Changes
The Social Security Trust Funds (OASI and DI) are currently projected to be depleted by the mid-2030s. It is important to clarify what “depleted” means: it does not mean the SSA will stop paying out benefits. Even if the trust funds are exhausted, incoming payroll taxes are projected to cover roughly 77% to 80% of scheduled benefits.
For a young professional today, this means your financial “Money” strategy should perhaps account for a 20% “haircut” in projected benefits, or better yet, treat Social Security as a secondary bonus while prioritizing self-funded accounts. Most economists agree that Congress will eventually intervene—likely by raising the retirement age, increasing the taxable earnings cap, or adjusting benefit formulas—to ensure the program remains a viable pillar of the American economy.
Conclusion
The Social Security Administration pays out an immense sum—nearly $1.5 trillion—every year to ensure the financial survival of tens of millions of people. For the individual, the annual payout is a reflection of a lifetime of work, influenced by inflation, the timing of the claim, and tax strategy.
By understanding that the average payout is approximately $23,000 per year, but can scale significantly higher with strategic planning, you can better position yourself for a secure future. Social Security is more than just a government check; it is a sophisticated financial tool that, when integrated correctly into a broader personal finance plan, provides a level of security that the private market simply cannot replicate.
aViewFromTheCave is a participant in the Amazon Services LLC Associates Program, an affiliate advertising program designed to provide a means for sites to earn advertising fees by advertising and linking to Amazon.com. Amazon, the Amazon logo, AmazonSupply, and the AmazonSupply logo are trademarks of Amazon.com, Inc. or its affiliates. As an Amazon Associate we earn affiliate commissions from qualifying purchases.