
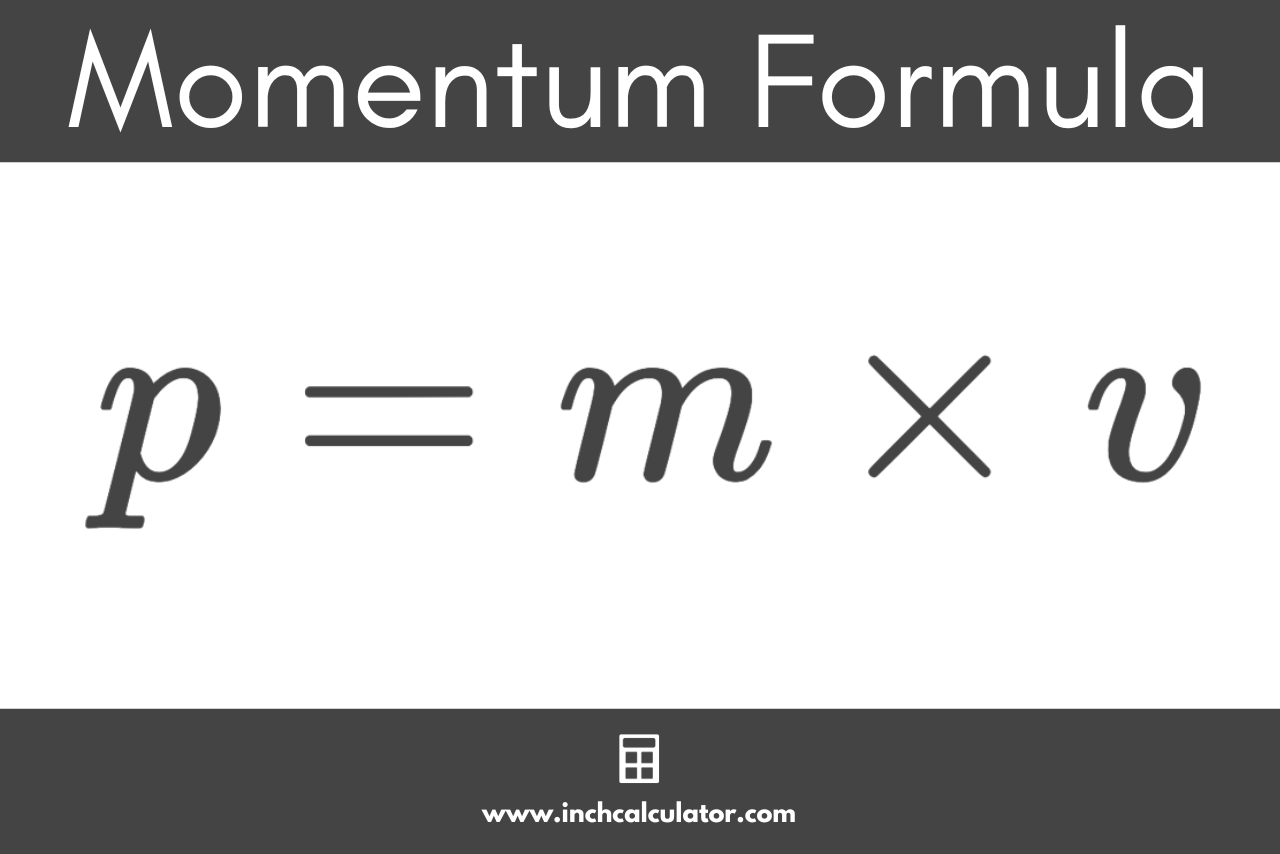
In the world of physics, momentum is a simple calculation: mass times velocity. It describes the power of a moving object and the effort required to stop it. However, in the high-stakes arena of finance and wealth creation, the formula for momentum is far more nuanced. It is the lifeblood of successful portfolios, the engine behind bull markets, and the primary indicator used by professional traders to identify when an asset has transitioned from a stagnant state to a high-velocity growth phase.
Understanding the formula for momentum is the difference between catching a wave at its crest and being pulled under by the undertow. For the modern investor, momentum is not just a mathematical curiosity; it is a systematic approach to capital allocation that prioritizes “what is working now” over “what might work later.” This article explores the quantitative and qualitative formulas for financial momentum, providing a blueprint for how individuals can harness market inertia to accelerate their path to financial independence.
The Quantitative Core: Calculating Market Velocity
To apply momentum to a portfolio, one must first look at the mathematical frameworks that define it. Unlike value investing, which seeks to find a discrepancy between price and intrinsic worth, momentum investing assumes that assets moving in one direction are statistically more likely to continue in that direction than to reverse.
The Rate of Change (ROC) and Relative Strength
The most basic formula for financial momentum is the Rate of Change (ROC). This calculation measures the percentage change in price between the current period and a period n days ago. If a stock was priced at $100 a year ago and is $150 today, its momentum is high, suggesting a strong trend.
However, professional investors often look deeper at Relative Strength (RS). This formula compares the performance of a specific asset against a benchmark, such as the S&P 500. The “Momentum Formula” in this context is:
Momentum = (Current Price / Price n-periods ago) – 1
When this result is higher than the broader market’s average, the asset is said to have “excess momentum,” indicating that capital is flowing into this specific sector or stock at a rate that outpaces the general economy.
Dual Momentum: Absolute vs. Relative
A sophisticated evolution of the momentum formula is “Dual Momentum,” a concept popularized by Gary Antonacci. This strategy utilizes two distinct filters:
- Relative Momentum: Comparing an asset to its peers (e.g., does Gold have more momentum than the S&P 500?).
- Absolute Momentum: Comparing an asset to its own history or a “risk-free” rate like T-bills (e.g., is the S&P 500 actually going up, or just losing less than Gold?).
By applying these filters, investors ensure they are not just buying the “best of a bad bunch” during a bear market, but are instead positioned in assets that are exhibiting true upward velocity.
The Behavioral Formula: Why Momentum Persists
If markets were perfectly efficient, the momentum formula wouldn’t work; prices would adjust instantly to new information. However, markets are driven by human psychology, which creates the “friction” and “acceleration” that momentum investors exploit. To understand the formula for momentum, one must understand the three stages of investor behavior: Underreaction, Herding, and Overreaction.
The Underreaction Phase
Momentum often begins with a fundamental catalyst—an earnings beat, a technological breakthrough, or a shift in interest rates. Initially, the market underreacts. Conservative investors wait for more data, and skeptics doubt the news. This creates a slow, steady climb. The formula at this stage is driven by “Information Diffusion”—the time it takes for the masses to realize a significant change has occurred.
Herding and the Feedback Loop
As the price continues to rise, it begins to appear on “top gainers” lists and algorithmic screeners. This is where the velocity increases. This phase is characterized by “Fear of Missing Out” (FOMO). As more capital enters, the price rises further, which attracts even more capital. This feedback loop is the purest expression of momentum in action. The mass (capital) increases, and the velocity (price change per unit of time) accelerates.
The Danger of Overreaction
Eventually, momentum moves from a rational response to information to an irrational surge. When the formula for momentum becomes detached from fundamental reality, we enter a “Momentum Bubble.” Recognizing the point where velocity outstrips sustainability is the hallmark of a seasoned investor. Successful momentum strategies include an “exit velocity” component—a predetermined signal, such as a breach of a 200-day moving average, to protect gains before the inevitable mean reversion.
Strategic Implementation: Integrating Momentum into Wealth Management
Knowing the formula is only half the battle; the other half is the disciplined application of that formula within a financial plan. Momentum is not limited to day trading; it can be the foundation of a robust, long-term wealth-building strategy through sector rotation and smart asset allocation.
Sector Rotation and the “Winner’s Effect”
The “Winner’s Effect” suggests that sectors that have outperformed over the last 6 to 12 months are likely to continue doing so for the next 3 to 6 months. By using a momentum formula to rank sectors—Tech, Energy, Healthcare, Utilities—investors can rotate their capital into the areas where the “wind is at their backs.” This prevents the common mistake of “averaging down” on losing positions, which is essentially betting against momentum.
Risk Management: The Volatility Filter
The greatest risk to a momentum-based strategy is the “momentum crash”—a sharp, sudden reversal. To mitigate this, professionals add a volatility component to the formula. Instead of just looking at raw price change, they look at Risk-Adjusted Momentum. This involves dividing the total return by the standard deviation of that return. A stock that rises 20% with very little fluctuation has “cleaner” momentum than a stock that rises 20% but swings wildly every week. Clean momentum is more predictable and easier to ride for long-term gains.
Momentum in Online Income and Business Finance
Beyond the stock market, the formula for momentum ($P = M times V$) applies to business growth and side hustles. In a business context, “Mass” represents your customer base and brand equity, while “Velocity” represents your sales cycle and lead conversion rate. A business gains momentum when it uses its current profits to increase the speed of customer acquisition. In personal finance, this looks like the “Snowball Method” of debt repayment or the “Compounding Machine” of dividend reinvestment—where every dollar earned adds more mass to the vehicle, allowing it to move faster toward the goal.
Tools and Technology for Momentum Tracking
In the digital age, individual investors have access to the same high-powered momentum formulas once reserved for Wall Street hedge funds. Utilizing these tools is essential for maintaining a competitive edge.
Quantitative Screeners and Heat Maps
Platforms like Finviz, TradingView, and Bloomberg Terminal allow users to filter thousands of assets based on momentum indicators. Key metrics to look for include:
- 52-Week Highs: Stocks trading near their yearly highs often have the least “overhead resistance” and the strongest momentum.
- Moving Average Convergence Divergence (MACD): A trend-following momentum indicator that shows the relationship between two moving averages of a security’s price.
- Relative Strength Index (RSI): While often used to find “oversold” conditions, a high RSI (above 70) that stays high is a sign of powerful, sustained momentum.
The Rise of Momentum ETFs
For investors who prefer a “set it and forget it” approach, the financial industry has codified the momentum formula into Exchange Traded Funds (ETFs). Funds like the iShares MSCI USA Momentum Factor ETF (MTUM) use algorithmic rules to automatically buy stocks with the highest price momentum and sell those that are slowing down. This allows individuals to capture the “Momentum Premium” without having to perform the manual calculations themselves.

Conclusion: Making Momentum Your Financial North Star
The formula for momentum is more than a mathematical equation; it is a philosophy of growth. It acknowledges that the hardest part of any financial journey is the beginning—overcoming the static friction of debt, low savings, or a stagnant portfolio. Once movement is established, however, the laws of financial physics begin to work in your favor.
By focusing on assets and strategies that exhibit high velocity and increasing mass, you align yourself with the natural flow of the market rather than fighting against it. Whether you are a disciplined value investor looking to add a “momentum tilt” to your holdings, or an entrepreneur seeking to accelerate business growth, mastering this formula is the key to achieving exponential results. Momentum, once captured, is the most powerful force in the financial universe; your task is simply to calculate it correctly, board the trend early, and have the wisdom to exit before the friction of reality sets in.
aViewFromTheCave is a participant in the Amazon Services LLC Associates Program, an affiliate advertising program designed to provide a means for sites to earn advertising fees by advertising and linking to Amazon.com. Amazon, the Amazon logo, AmazonSupply, and the AmazonSupply logo are trademarks of Amazon.com, Inc. or its affiliates. As an Amazon Associate we earn affiliate commissions from qualifying purchases.