In the rapidly evolving landscape of technology, from the development of sophisticated AI models to the optimization of user interfaces through A/B testing, the ability to distinguish between meaningful signals and random noise is paramount. At the heart of this distinction lies a fundamental statistical concept that has become a cornerstone of modern data-driven technology: the t-statistic, or “t-stat.”
While the term might sound like a relic from an introductory college statistics course, the t-stat is an essential tool in the arsenal of software engineers, data scientists, and product managers. It provides the mathematical rigor necessary to validate technological advancements, ensuring that a new algorithm or a software update actually delivers the performance improvements it promises. This article explores the depths of the t-stat within the tech niche, examining its application in AI, software development, and the digital tools that make modern computing possible.
The Fundamentals of the T-Stat in Modern Software Engineering
In its simplest form, a t-statistic is a ratio that helps tech professionals determine if the difference between two sets of data is statistically significant. In the context of technology, we are rarely looking at a total population; instead, we work with samples—sets of server logs, user interaction data, or training datasets for machine learning.
What is a T-Stat in Technical Terms?
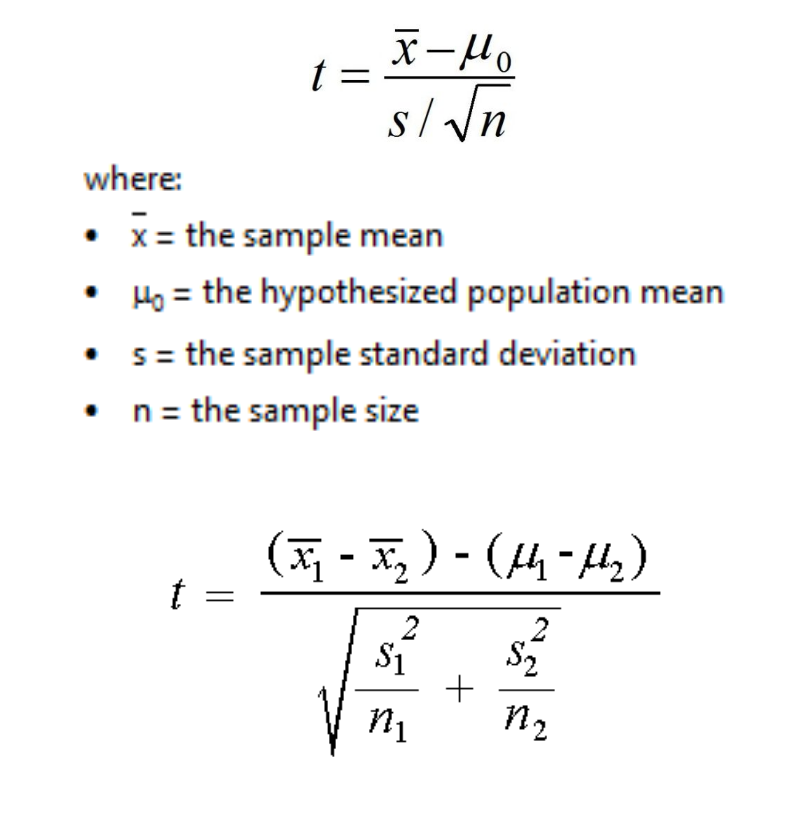
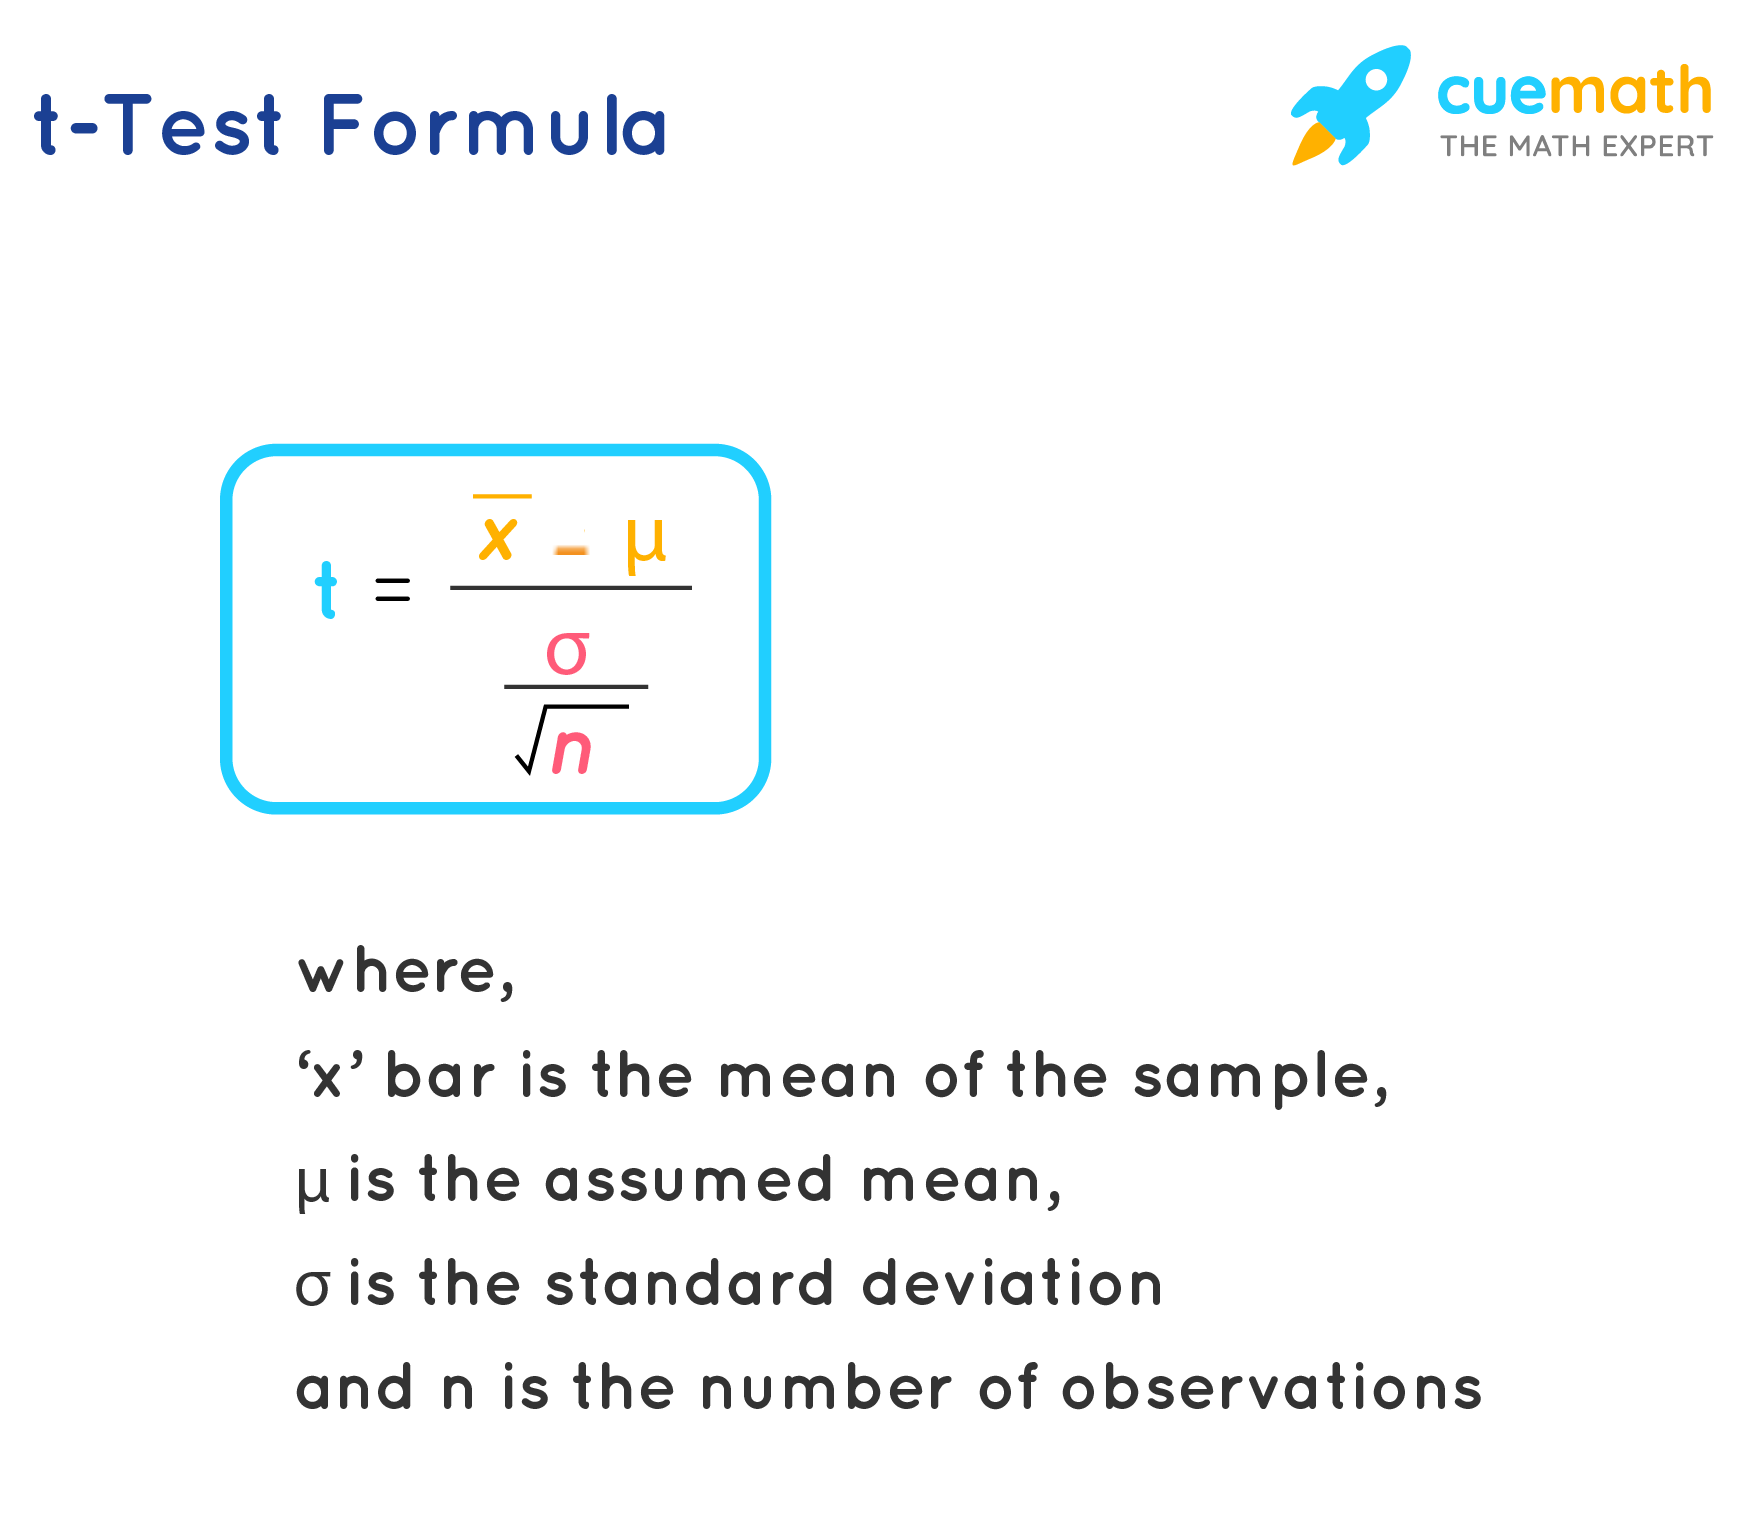
The t-stat measures the size of the difference relative to the variation in your sample data. When a software engineer runs a performance test on two different versions of a piece of code, the t-stat is calculated by taking the difference in average execution times and dividing it by the standard error of that difference. A high t-stat suggests that the difference is real and not just a result of random fluctuations in CPU load or network latency.
The Null Hypothesis in Code Validation
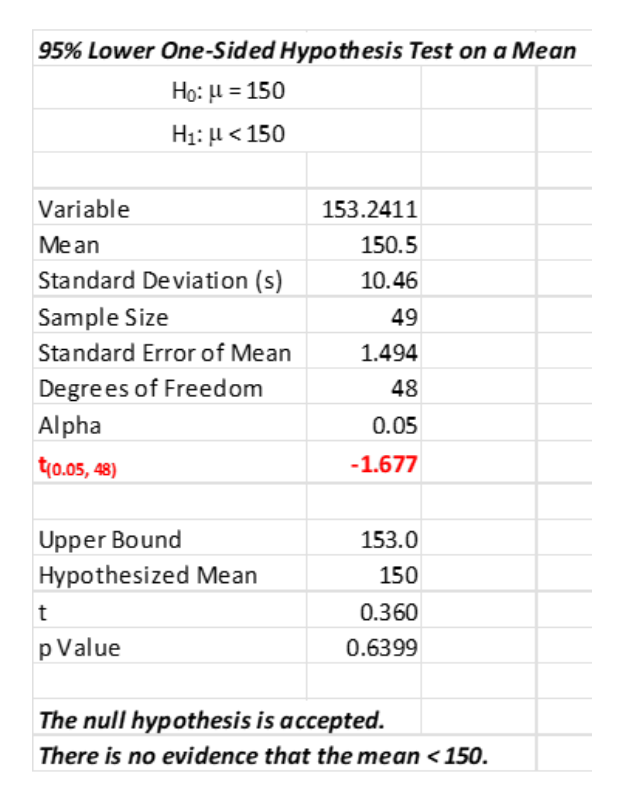
In tech development, we operate under the “Null Hypothesis” (H0), which assumes that any observed change in a system’s performance is due to chance. For example, if a developer implements a new caching layer, the Null Hypothesis states that the new layer has no effect on latency. The t-stat is the tool used to “reject” this hypothesis. If the t-stat is sufficiently large, the developer can confidently state that the software optimization is effective, providing a green light for deployment.
Degrees of Freedom and Sample Size
For tech leads managing large-scale apps, understanding “degrees of freedom” is crucial. This value, closely related to sample size, adjusts the t-stat to account for the reliability of the data. In the world of Big Data, where we might have millions of entries, t-stats become incredibly precise, allowing for the detection of even minute improvements in software efficiency that can save a company thousands of dollars in cloud computing costs.
Implementing T-Stats in AI and Machine Learning
As artificial intelligence moves from research labs to production environments, the need for rigorous validation has never been higher. The t-stat plays a pivotal role in ensuring that AI models are not just “overfitting” to their training data but are actually learning patterns that generalize to the real world.
Model Comparison and Selection
When data scientists develop multiple iterations of a neural network, they must decide which model performs best. By using t-tests to compare the mean absolute error (MAE) or accuracy scores of two models across different folds of cross-validation, they can use the t-stat to prove that “Model B” is significantly better than “Model A.” This prevents the tech team from switching to a more complex, computationally expensive model that doesn’t actually provide a meaningful boost in performance.
Feature Selection and Engineering
In the “AI Tools” category, feature engineering is where much of the magic happens. Tech professionals use t-stats to determine which input variables (features) have a statistically significant impact on the model’s output. If a specific data point—such as a user’s time-of-day access—yields a low t-stat in relation to the target variable, it may be discarded. This streamlines the software, reduces memory usage, and speeds up inference times, which is critical for mobile apps and edge computing.
Validating AI Fairness and Bias
One of the most pressing trends in technology is the ethical implementation of AI. T-stats are frequently used to audit algorithms for bias. By comparing the outcomes of an AI tool across different demographic groups, developers can calculate t-stats to see if there is a statistically significant discrepancy in how the software treats different users. A high t-stat in this context is a “red flag,” signaling a need for immediate algorithmic adjustment to ensure digital equity.
The Role of T-Stats in Digital Product Optimization (A/B Testing)
For app developers and UI/UX designers, the t-stat is the engine behind A/B testing—the industry standard for digital product optimization. Whether it’s Netflix testing a new thumbnail or Spotify tweaking its recommendation algorithm, the t-stat provides the “go/no-go” signal.
Determining User Engagement
When a tech company launches a “Champion vs. Challenger” test (A/B test), they track metrics like Click-Through Rate (CTR) or Session Duration. The t-stat allows the product team to determine if the 2% increase in engagement on the “Challenger” version is a result of the new design or just a lucky day of traffic. This data-driven approach removes subjectivity from design, allowing software to evolve based on empirical evidence rather than “gut feelings.”
Significance Levels and P-Values
In software documentation and research papers, you will often see the t-stat paired with a “p-value.” The p-value is derived from the t-stat and tells the tech team the probability that the observed results happened by chance. In the tech industry, a p-value of less than 0.05 (corresponding to a certain t-stat threshold) is usually required to justify a full-scale software rollout. This level of rigor prevents “feature creep,” where unnecessary changes are made to a product without proven benefit.
Scaling Experiments with Automated Tools
Modern “Growth Tech” stacks now include automated experimentation platforms like Optimizely or Google Optimize. These tools calculate t-stats in real-time, providing dashboards that visualize the statistical significance of ongoing tests. For tech startups, these tools are vital for rapid iteration, allowing them to fail fast or scale successful features with mathematical certainty.
Tools and Software Libraries for Statistical Computing
For the modern developer, calculating a t-stat doesn’t involve manual pen-and-paper math. A vast ecosystem of software and AI tools has made statistical analysis an integrated part of the coding workflow.
Python: The Powerhouse of Data Tech
Python has become the lingua franca of the tech world, largely due to its robust libraries for statistics. SciPy and Statsmodels are the primary tools used to calculate t-stats. With just a few lines of code (e.g., stats.ttest_ind(data_a, data_b)), a developer can perform a complex analysis on gigabytes of data. This accessibility has democratized data science, allowing even front-end developers to incorporate statistical validation into their workflows.
R and Specialized Statistical Software
While Python dominates general tech, the R programming language remains a favorite for deep statistical research and academic-leaning tech projects. R provides an even more granular level of control over t-stat calculations, making it ideal for biotech and high-stakes digital security analysis where the cost of a “False Positive” is extreme.
Visualization and Dashboards
Tech trends are shifting toward “Observability”—the ability to see what is happening inside complex software systems in real-time. Tools like Tableau, Power BI, and Grafana can be configured to display t-stats and confidence intervals on live data streams. This allows DevOps teams to monitor system health and detect anomalies (which manifest as sudden shifts in t-stats) before they lead to system-wide outages.
The Future of the T-Stat in an AI-Driven World
As we look toward the future of technology, the role of the t-stat is evolving but remains foundational. We are moving toward a world of “Automated Machine Learning” (AutoML), where software writes its own statistical tests.
Automated Statistical Inference
New AI tools are being developed that can automatically identify which parts of a codebase are underperforming by running continuous t-tests on internal metrics. This “self-healing” software uses statistical thresholds to trigger automatic rollbacks if a new update causes a significant drop in performance.
Security and Anomaly Detection
In the realm of digital security, the t-stat is being utilized to identify cyberattacks. By establishing a “baseline” of normal network traffic, security software can use t-stats to flag deviations that are statistically improbable. This helps in identifying D-DoS attacks or unauthorized data exfiltration in their infancy, protecting digital infrastructure from increasingly sophisticated threats.
Conclusion: Why Every Tech Professional Needs to Know the T-Stat
In a world saturated with data, the t-stat is the gatekeeper of truth. For the software developer, it is the difference between an optimized app and a bloated one. For the data scientist, it is the shield against false discoveries in AI. For the tech leader, it is the metric that justifies a multi-million dollar pivot.
Understanding “what is the t-stat” is more than just knowing a formula; it is about embracing a scientific mindset in technology. It ensures that the digital tools we build are robust, reliable, and truly effective. As AI and software continue to integrate into every facet of human life, the t-stat will remain an indispensable tool for verifying that our technological progress is real, measurable, and statistically significant.