When we ask the question, “What country has the most tornadoes?” the answer is often delivered as a simple geographic fact. However, from a technological and data-science perspective, the answer is a complex narrative written in satellite imagery, doppler radar pulses, and sophisticated predictive algorithms. While the United States consistently ranks as the global leader in tornado frequency, the “why” and “how” behind this ranking are deeply rooted in the evolution of meteorological technology.
In the modern era, identifying tornado frequency is no longer just about visual confirmation from storm chasers; it is a high-stakes endeavor involving petabytes of data, machine learning, and a global network of sensors. To understand which country leads the world in severe weather, we must look through the lens of the technology that detects, tracks, and archives these volatile atmospheric events.
The Global Leader in Severe Weather: A Data-Driven Analysis
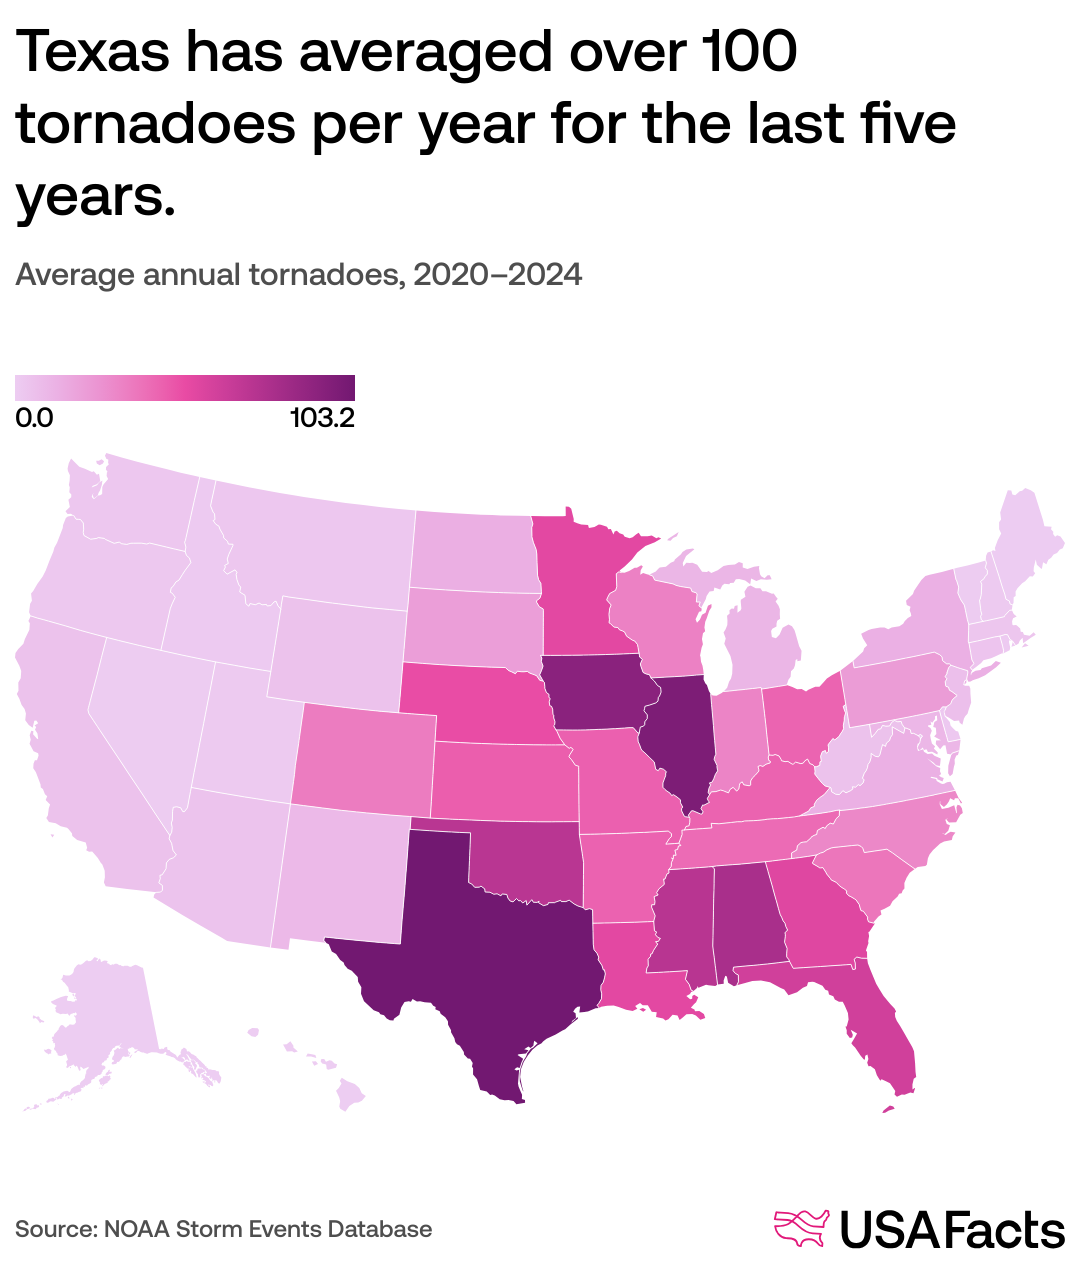
Statistically, the United States records more tornadoes than any other country on Earth, averaging over 1,200 per year. This is significantly higher than its closest competitors, such as Canada, Russia, and the United Kingdom. However, the designation of “most tornadoes” depends heavily on how a country’s technological infrastructure captures and records small-scale events.
Why the United States Dominates Global Storm Metrics
The United States is uniquely positioned geographically, where warm, moist air from the Gulf of Mexico meets cold, dry air from the Rockies. But from a tech perspective, the U.S. also possesses the most dense and advanced weather monitoring network in the world. The National Oceanic and Atmospheric Administration (NOAA) utilizes the NEXRAD (Next-Generation Radar) system—a network of 160 high-resolution S-band Doppler radar sites. This infrastructure allows for the detection of “debris balls” and “tornadic vortex signatures” (TVS) that other countries might miss due to lack of radar coverage.
Comparative Data: The United Kingdom, Canada, and Bangladesh
When looking at the data from a “per square mile” perspective, the United Kingdom often surprises analysts. Tech-driven tracking shows that the UK actually has more tornadoes relative to its land area than the U.S. However, these are typically weak (EF0 or EF1) and often go undetected by standard public sensors.
In contrast, Bangladesh represents a tragic data point in meteorological history. While it doesn’t have the highest frequency, it has the highest mortality rate from tornadoes. The technology gap here is evident; the lack of a sophisticated Doppler network and real-time digital alerting systems means that even a low-frequency event can have a disproportionate impact on the population compared to technologically shielded nations.
The Evolution of Meteorological Technology: From Visual Spotting to AI
The ability to accurately answer which country has the most tornadoes has improved exponentially with the shift from analog to digital observation. In the mid-20th century, tornado counts were largely based on human testimony. Today, we rely on a stack of hardware and software that identifies rotation before a funnel even touches the ground.
Dual-Polarization Radar: The Game Changer in Detection
The implementation of Dual-Polarization (Dual-Pol) radar technology in the early 2010s revolutionized how we categorize storm intensity. Unlike legacy radar that only sent out horizontal pulses, Dual-Pol sends both horizontal and vertical pulses. This allows meteorologists to distinguish between heavy rain, hail, and non-meteorological objects—like shingles or insulation lofted into the air. This “Tornado Debris Signature” (TDS) provides definitive proof of a tornado’s existence in real-time, even in the middle of the night or wrapped in rain, leading to much more accurate annual counts and historical databases.
Satellite Imaging and GOES-R Series Innovations
While ground-based radar is essential, the view from above provides the “big picture” data necessary for global comparisons. The GOES-R (Geostationary Operational Environmental Satellite) series has introduced the Geostationary Lightning Mapper (GLM). This tech tracks rapid increases in lightning activity—often a precursor to tornadogenesis. By analyzing lightning density via satellite, tech hubs can now identify potential tornado activity in remote regions of Siberia or the Amazon where ground radar is non-existent, providing a more balanced view of global tornado distribution.
The Role of Big Data and Predictive Analytics in Tornado Modeling
Identifying where tornadoes happen is the first step; predicting them requires massive computational power. The “most tornadoes” metric is constantly being refined by software that can simulate atmospheric conditions with incredible precision.
High-Resolution Ensemble Forecasts (HREF)
Modern meteorology relies on High-Resolution Ensemble Forecasts (HREF). This software takes multiple models—each with slightly different initial atmospheric conditions—and runs them simultaneously on supercomputers. By analyzing where these models converge, data scientists can predict “tornado outbreaks” with high probability days in advance. This software-driven approach has shifted the focus from “reactive” observation to “proactive” modeling, allowing countries to prepare their digital infrastructure for incoming threats.
Machine Learning and the Future of Warning Times
Artificial Intelligence (AI) and Machine Learning (ML) are currently being integrated into the National Weather Service’s workflow. AI tools are trained on decades of radar data to recognize the subtle “hook echoes” and “velocity doublets” that precede a tornado. These tools can process information faster than any human meteorologist, potentially increasing warning lead times from the current average of 14 minutes to over 20 minutes. For tech-heavy nations, this means fewer “false alarms” and a more accurate historical record of exactly where and when tornadoes occur.
Digital Security and Public Safety Tech: Alerting Systems
The country with the most tornadoes must also be the country with the most robust emergency tech infrastructure. The “last mile” of tornado technology is the delivery of life-saving data to the end-user.
Wireless Emergency Alerts (WEA) and Geofencing
In the United States, the Integrated Public Alert & Warning System (IPAWS) utilizes geofencing technology to send Wireless Emergency Alerts (WEA) to mobile devices within a specific polygon of danger. This tech ensures that alerts are not sent to entire counties (which leads to “warning fatigue”) but only to those in the direct path of the storm. The precision of this digital security measure is a hallmark of how technology mitigates the danger in high-frequency tornado zones.
The Internet of Things (IoT) in Early Warning Infrastructure
The future of tornado detection lies in the Internet of Things (IoT). New research is exploring how barometric pressure sensors in smartphones and connected home weather stations can act as a massive, crowdsourced sensor network. This mesh network could provide hyper-local data on pressure drops, helping software developers map the exact track of a tornado through a metropolitan area with meter-level precision. This level of granularity will eventually provide the definitive data set for which regions are most at risk.
The Global Expansion of Storm Detection Networks
As technology becomes more affordable and accessible, our understanding of global tornado patterns is shifting. For a long time, the U.S. held the title of “most tornadoes” partly because it had the best tools to find them. As other nations upgrade their tech stacks, the global map is being redrawn.
Scaling Tech for Emerging Regions
Countries like Brazil, Argentina, and South Africa have seen an “increase” in recorded tornadoes over the last decade. This is largely attributed to the proliferation of high-speed mobile internet and the “democratization” of detection tools. Software-defined radio (SDR) and low-cost weather sensors are allowing local communities to build their own detection grids. As this technology scales, we are discovering that the “Tornado Alley” of the United States has smaller, tech-verified cousins in the “Pasillo de los Tornados” in South America.
The Impact of Cloud Computing on Meteorological Collaboration
Cloud computing has enabled international researchers to share massive atmospheric datasets in real-time. Platforms like AWS and Google Cloud host “Open Data” initiatives where satellite and radar archives are available for global analysis. This collaborative tech environment allows a researcher in Europe to use AI models to analyze storm patterns in North America, leading to a more nuanced understanding of how global climate shifts are moving the needle on which country might hold the title for the most tornadoes in the coming century.
In conclusion, while geography dictates where the wind blows, technology dictates what we know about it. The United States currently holds the record for the most tornadoes, supported by the world’s most advanced meteorological tech stack. However, as AI, IoT, and satellite technology continue to evolve and spread globally, our ability to track these elusive storms will only become more precise, turning raw atmospheric data into actionable intelligence for every nation on Earth.
aViewFromTheCave is a participant in the Amazon Services LLC Associates Program, an affiliate advertising program designed to provide a means for sites to earn advertising fees by advertising and linking to Amazon.com. Amazon, the Amazon logo, AmazonSupply, and the AmazonSupply logo are trademarks of Amazon.com, Inc. or its affiliates. As an Amazon Associate we earn affiliate commissions from qualifying purchases.