In the realm of personal and business finance, the ability to calculate and interpret percentages is perhaps the most fundamental skill a professional can possess. While “how do you get the percent” might seem like a simple mathematical query from a primary school classroom, in the context of money, it is the language of growth, risk, and stability. Whether you are analyzing stock market returns, determining the true cost of a loan, or evaluating the profitability of a business venture, percentages provide the standardized metric needed to make informed decisions.
Understanding percentages allows you to move beyond absolute numbers—which can often be misleading—and into the realm of relative value. A $1,000 profit is impressive on a $5,000 investment, but it is mediocre on a $100,000 investment. This article explores the vital role of percentage calculations in the financial landscape, providing a comprehensive guide to mastering the math that drives wealth.
The Fundamentals: Calculating Basic Percentages in Personal Finance
Before diving into complex financial modeling, one must master the basic mechanics of the percentage. At its core, a percentage represents a fraction of 100. In finance, we use this to determine everything from sales tax to the portion of a portfolio dedicated to a specific asset class.
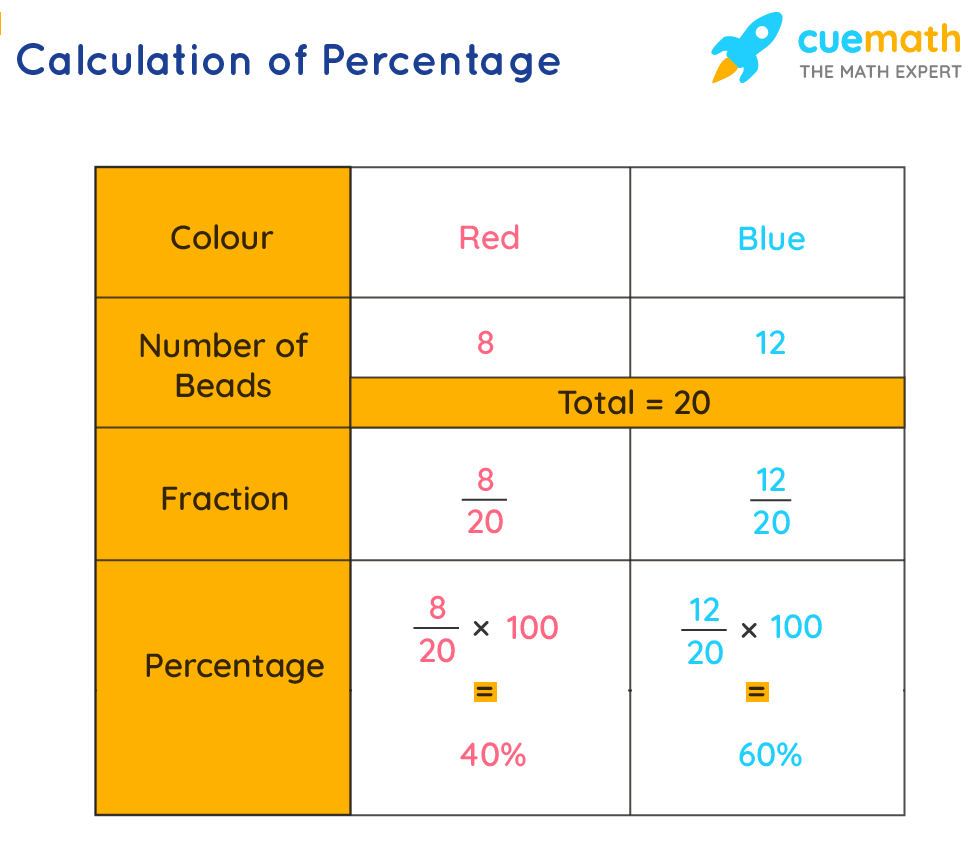
The Standard Formula and Its Application
The basic formula to find a percentage is:
(Part / Whole) × 100 = Percentage
In a personal finance context, this is often used for budgeting. If your monthly income is $5,000 and your rent is $1,500, you determine the percentage of your income spent on housing by dividing 1,500 by 5,000, resulting in 0.3, or 30%. This figure is a benchmark used by many financial advisors to determine housing affordability. Mastering this simple division is the first step in auditing where your money goes.
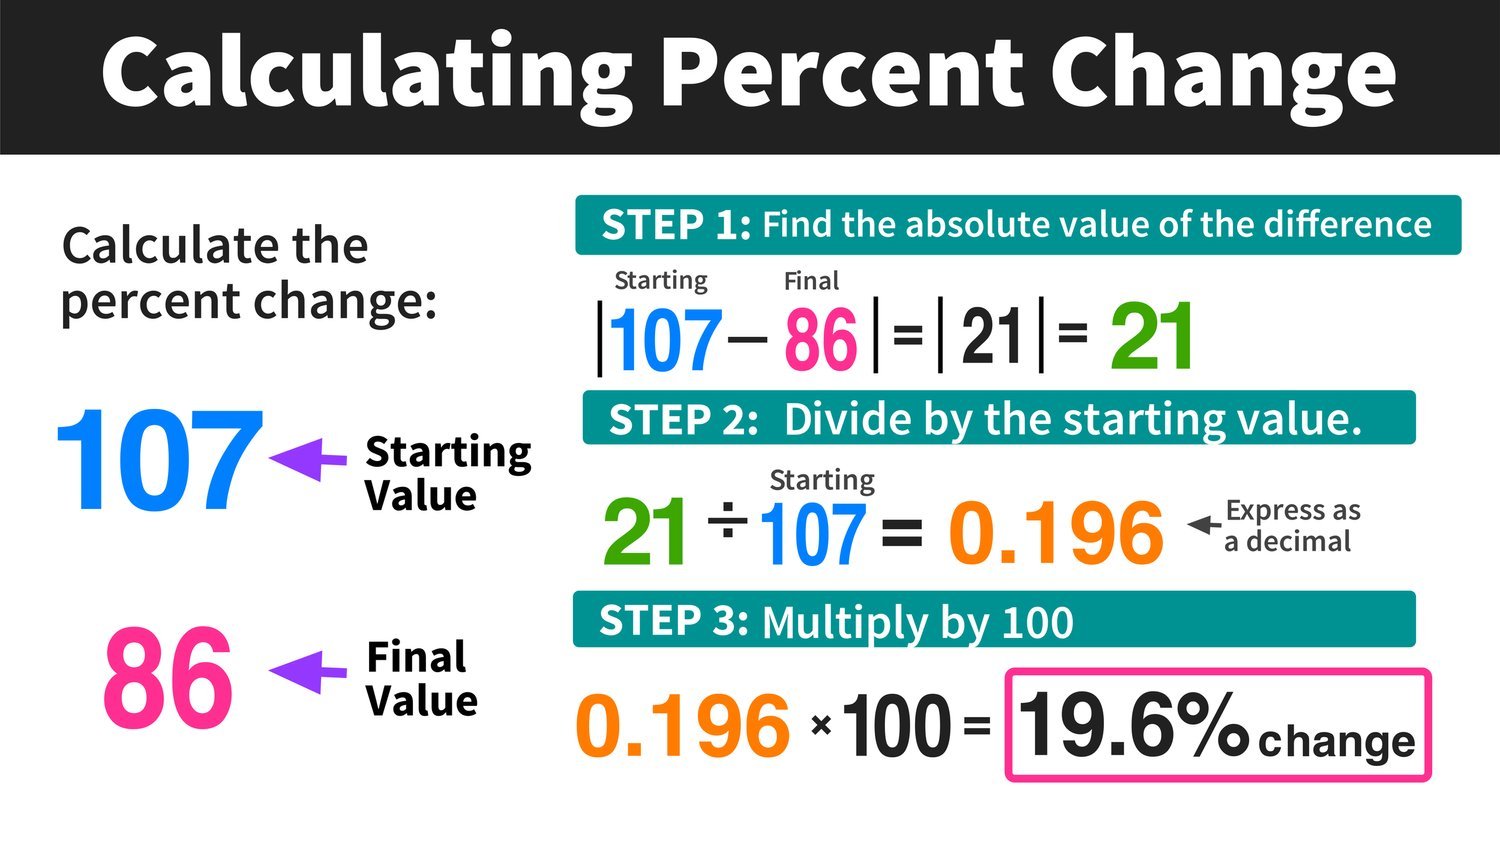
Percentage Change vs. Percentage Point
One of the most common points of confusion in financial reporting is the distinction between a “percentage change” and a “percentage point.” If a savings account interest rate moves from 1% to 2%, it has increased by one percentage point. However, in terms of percentage change, it has increased by 100%.
To calculate percentage change, the formula is:
[(New Value – Old Value) / Old Value] × 100
Understanding this nuance is critical when reading economic reports or bank disclosures. A “0.5% increase” in an interest rate sounds negligible, but if the original rate was 3%, that represents a significant relative increase in the cost of borrowing.
Investment Returns: Measuring the Growth of Your Wealth
In the world of investing, “getting the percent” is the primary way we measure performance. Investors rarely focus on the total dollar amount gained in isolation; instead, they look at the yield or the return on investment (ROI) to compare different opportunities.
Calculating Return on Investment (ROI)
ROI is the ultimate metric for efficiency. It tells you how much profit you have made relative to the cost of the investment. The formula is:
[(Current Value of Investment – Cost of Investment) / Cost of Investment] × 100
For example, if you purchased shares of a technology stock for $10,000 and sold them for $12,500, your capital gain is $2,500. By dividing that gain by your initial $10,000 cost, you find a 25% ROI. This percentage allows you to compare that stock’s performance against other assets, such as real estate or bonds, which may have required much higher initial outlays.
Compound Annual Growth Rate (CAGR)
While simple ROI is useful for a single point in time, it does not account for the time value of money. This is where the Compound Annual Growth Rate (CAGR) becomes essential. CAGR provides a smoothed annual rate of return, essentially telling you what your investment “got” each year as if it had grown at a steady rate with profits reinvested.
Calculating CAGR is more complex:
[(Ending Value / Beginning Value)^(1 / Number of Years)] – 1
Financial professionals use CAGR to compare the performance of two different funds over a five-year period. Without this percentage, it is nearly impossible to tell which investment strategy is actually more effective over the long term, especially when market volatility creates “noisy” year-to-year data.
Debt and Interest: Understanding the Cost of Borrowing
On the flip side of investing is debt. When you borrow money, the percentage—expressed as interest—is the price you pay for the use of someone else’s capital. Knowing how to calculate these percentages can save you thousands of dollars over the life of a loan.

Deciphering the Annual Percentage Rate (APR)
The APR is a broader measure of the cost of a loan than the simple interest rate. It includes not only the interest but also any fees or additional costs associated with the transaction. When a bank offers a mortgage, they provide a nominal interest rate (e.g., 6%) and an APR (e.g., 6.4%).
The higher APR reflects the “real” percentage you are paying once closing costs and origination fees are factored in. When comparing loan offers, the APR is the most honest percentage to use because it levels the playing field between lenders who might have low rates but high hidden fees.
The Debt-to-Income (DTI) Ratio
Lenders use percentages to evaluate your creditworthiness, specifically the Debt-to-Income (DTI) ratio. This is calculated by dividing your total monthly debt payments by your gross monthly income.
Total Monthly Debt / Gross Monthly Income = DTI %
A DTI of 36% or lower is typically viewed as healthy. If you are applying for a mortgage and your DTI is 45%, a lender may see you as high-risk, regardless of how high your actual salary is. In this scenario, “getting the percent” right is the difference between securing a home loan and being rejected.
Business Finance: Percentages in Profitability and Pricing
For entrepreneurs and business owners, percentages are the vital signs of the company. Absolute revenue can be a “vanity metric”; it is the percentage-based margins that determine if a business is sustainable.
Gross Profit Margin vs. Net Profit Margin
Gross profit margin measures the efficiency of production. It is calculated by subtracting the Cost of Goods Sold (COGS) from Revenue, then dividing by Revenue.
[(Revenue – COGS) / Revenue] × 100 = Gross Margin %
However, the Net Profit Margin is the “bottom line” percentage. It takes all expenses into account, including taxes, interest, and operating costs. A company might have a healthy 60% gross margin but a dangerous 2% net margin due to high overhead. Monitoring these percentages allows a business owner to identify exactly where capital is being eroded.
The Markup vs. Margin Trap
One of the most common mistakes in business finance is confusing markup with margin. If a product costs $80 to produce and you want to make a 20% profit, many people mistakenly add 20% to the cost ($16) to set the price at $96. This is a 20% markup.
However, if you want a 20% profit margin, the calculation is different:
Cost / (1 – Desired Margin) = Selling Price
Using this formula ($80 / 0.8), the selling price should be $100. At a $96 price point, your margin is actually only 16.6%. Over thousands of transactions, failing to understand how to get the correct percentage in pricing can lead to a total collapse of business liquidity.
Tools for Precision: Automating Percentage Calculations
In the modern financial era, while it is crucial to understand the logic behind the math, we rarely perform these calculations by hand. Professional-grade financial tools ensure precision and allow for complex “what-if” modeling.
Leveraging Spreadsheet Functions
Software like Microsoft Excel or Google Sheets is built on percentage logic. By formatting a cell as a percentage, the software automatically handles the “multiply by 100” step. Key functions include:
- =SUM(A1:A10)/B1: To find the total percentage of a budget category.
- =(New-Old)/Old: To track portfolio growth.
- =PMT: A complex function that uses interest rate percentages to calculate monthly loan payments.
Financial Calculators and AI Tools
For high-stakes decisions, such as retirement planning or commercial real estate underwriting, dedicated financial calculators (like the HP 12C) or AI-driven financial modeling tools are used. These tools allow you to input variables—such as an annual percentage increase in inflation—to see how it will affect the purchasing power of your savings 30 years from now.
When you ask “how do you get the percent” in these tools, you are often looking for the “Internal Rate of Return” (IRR), a sophisticated percentage that accounts for varying cash flows over time. Mastering these tools elevates a person from a simple saver to a sophisticated manager of capital.
Conclusion: The Power of the Percent
In the world of money, percentages are more than just numbers—they are indicators of health, tools for comparison, and red flags for risk. By understanding how to calculate basic percentages, measure investment returns through ROI and CAGR, audit debt via APR and DTI, and maintain business profitability through proper margins, you gain a level of financial clarity that absolute numbers can never provide.
Whether you are managing a household budget or a corporate balance sheet, the answer to “how do you get the percent” is the key to unlocking better financial outcomes. Math is the foundation of money, and the percentage is its most vital measurement.
aViewFromTheCave is a participant in the Amazon Services LLC Associates Program, an affiliate advertising program designed to provide a means for sites to earn advertising fees by advertising and linking to Amazon.com. Amazon, the Amazon logo, AmazonSupply, and the AmazonSupply logo are trademarks of Amazon.com, Inc. or its affiliates. As an Amazon Associate we earn affiliate commissions from qualifying purchases.